


STH and LTH Realized Price are the two cost-basis layers that define bull and bear structure in Bitcoin. Learn the crossover signal, current levels, and how to trade each zone.
TL-DR
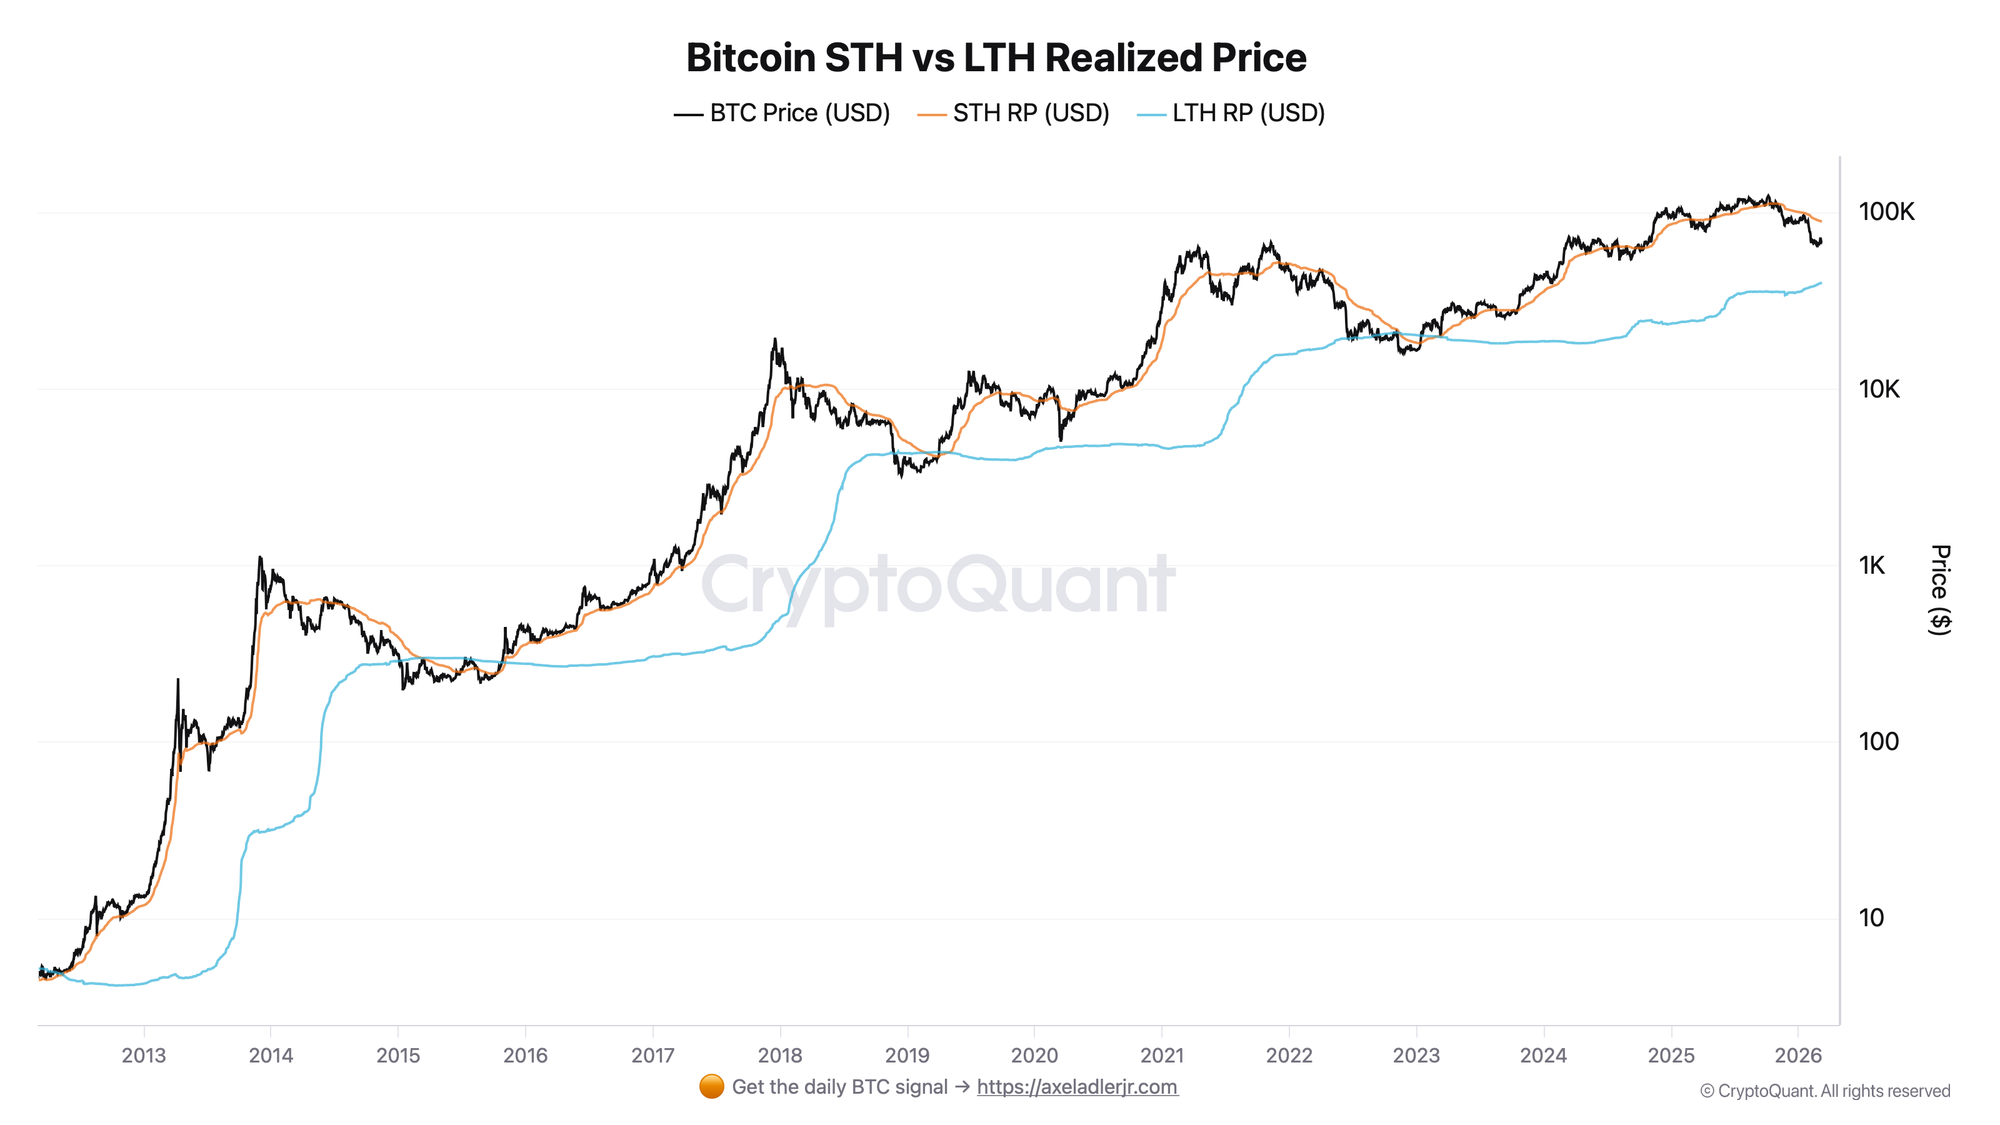
- STH Realized Price = average cost basis of coins held under 155 days (~$112,000 at the peak in Q4 2025, declining to ~$89,000 by March 2026)
- LTH Realized Price = average cost basis of coins held over 155 days (~$39,000 as of February/March 2026)
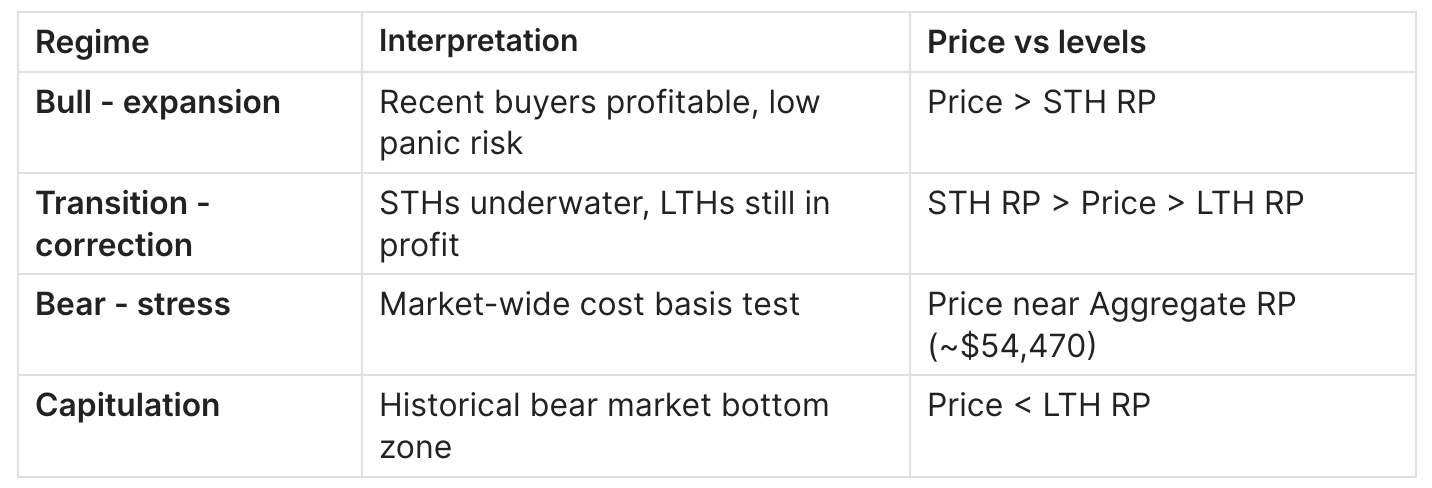
- Price above STH RP = most recent buyers profitable = bull structure intact
- Price below STH RP but above LTH RP = transition zone - weak hands under water, strong hands still holding
- Price below LTH RP = historically coincides with final capitulation and bear market bottom
- Signal rule: STH RP crossing below LTH RP = bear market approaching bottom; STH RP reclaiming above LTH RP = bull market ignition
The Signal Rule
Two levels separate four distinct market regimes:
- Level 1 - STH Realized Price (as of March 8, 2026: approximately $89,000)
- Level 2 - LTH Realized Price (as of February 24, 2026: approximately $39,000)
- Aggregate Realized Price (as of March 8, 2026: ~$54,470)
Crossover signal:
- STH RP drops below LTH RP = capitulation confirmed, historically marks final bear bottom (2015, 2018, 2022)
- STH RP reclaims above LTH RP and trends higher = bull market re-ignition
Current status (March 2026): BTC ~$67,175. STH RP ~$89,000. Price is significantly below STH RP - transition zone. LTH RP ~$39,000. Crossover has not occurred. STH Realized Cap declined from $658B (November 2025) to $535B (March 2, 2026), a contraction of $123B.
Key Definitions
- STH Realized Price - The UTXO-weighted average acquisition price of all coins that moved on-chain within the last 155 days. Represents the cost basis of newer, more reactive market participants. Updated daily on-chain.
- LTH Realized Price - The UTXO-weighted average acquisition price of all coins unmoved for over 155 days. Represents the cost basis of long-term accumulators and institutions. This level rises slowly as old STHs graduate into the LTH cohort.
- 155-day threshold - Statistically derived from Bitcoin's holding patterns. Coins held longer than 155 days become exponentially less likely to be spent - the behavioral inflection point between "weak hands" and "strong hands."
- Aggregate Realized Price - The network-wide average cost basis: total Realized Cap / circulating supply. As of March 8, 2026: $54,470. MVRV = 1.23 (BTC ~$67,175 / $54,470).
- STH Realized Cap - Total dollar value locked in STH positions at their acquisition price. A declining STH Realized Cap (as seen in Nov 2025 - Mar 2026: -$123B) signals that short-term capital is rotating out or being marked down at a loss.
How to Interpret This Metric
Bullish case
Price holds above STH Realized Price after a pullback. The STH RP level acts as dynamic support - when price dips to it and bounces, most recent buyers defended their cost basis, confirming demand. Historically this pattern holds through mid-bull phases. STH RP rising faster than LTH RP indicates accelerating demand and new entrant FOMO.
Bearish case
Price breaks below STH Realized Price and fails to reclaim it. The level flips to resistance. STHs are now underwater on average, increasing sell pressure as they look to exit at breakeven. The deeper and longer price stays below STH RP, the greater the capitulation pressure. If STH RP begins converging toward LTH RP, late-cycle distribution is complete and the market is approaching a structural reset.
Transition / neutral case
Price oscillates around STH RP with no sustained break in either direction. This signals indecision - recent buyers are near breakeven, neither panicking nor buying aggressively. Look for confirmation from Bitcoin STH SOPR and NUPLto confirm regime direction.
What matters most
- Trend over level: A rising STH RP that price is tracking above is more bullish than a static level with price sideways below it.
- Rate of change: When STH RP is falling sharply (cohort selling at a loss), watch for convergence toward Aggregate RP (~$54,470) as the next demand zone.
- Timeframe: STH RP is a weekly/monthly signal - intraday wicks through it are noise.
Historical Examples
Example 1: 2022 Bear Market - STH RP as Resistance Floor
- Period: May - November 2022
- What the metric showed: After the LUNA collapse in May 2022, BTC price broke decisively below STH RP (which was falling from ~$44,600). The STH RP level became hard resistance - every rally attempt that reached it was sold. The LTH RP sat around $17,900 at the start of May. The gap between price and LTH RP narrowed throughout the year.
- What the market did: BTC declined from ~$38,000 in May to ~$16,000 in November 2022 - the FTX collapse triggered final capitulation. At the bottom, price dropped below the LTH RP, which had slowly risen to approximately $20,800 as high-cost 2021 buyers graduated into the LTH cohort.
- Why it worked: The STH RP accurately mapped the "break-even exit zone" for the 2021 cycle buyers. Whenever price reached that level, underwater STHs who had been waiting for relief sold, capping recoveries.
Example 2: Fall 2024 Bull Re-ignition
- Period: September - December 2024
- What the metric showed: Following the ETF approval rally and post-halving accumulation, price sustained itself above STH RP. The STH RP rose from ~$64,000 in September to over ~$76,000 by December, and spot price tracked well above it. LTH RP sat lower, around $20,900 - $23,800. The spread between STH RP and LTH RP expanded, signaling that fresh capital was entering at progressively higher levels while LTHs accumulated through the correction.
- What the market did: BTC rallied from ~$58,300 in September 2024 to a peak of ~$106,700 by December 2024. The STH RP acted as dynamic support during pullbacks in October and November.
- Why it worked: Rising STH RP with price above it = demand absorption confirmed. Each cohort of new buyers raised the floor, preventing deep corrections.
Example 3: Late 2025 - Early 2026 Transition
- Period: October 2025 - March 2026
- What the metric showed: BTC hit an ATH of $124,450 on October 7, 2025. On that day, the weighted STH cost basis was $112,084. As BTC declined from the $124K peak to ~$67,175 by March 2026, the aggregate STH RP declined to ~$89,000, while the STH Realized Cap contracted $123B. The MVRV Z-Score for STHs reached -2.26 (February 22, 2026).
- What the market did: BTC price fell roughly ~46% from ATH. The aggregate STH cohort is deeply underwater. LTH RP (~$39,000) remains far below current price - no LTH capitulation triggered.
- Why it matters now: The STH RP crossover below LTH RP has not happened. The LTH RP at ~$39,000 represents the historical bear bottom zone. The current setup is a deep correction within a cycle, not a structural bear market bottom by this metric - unless price continues declining another ~40% to test LTH RP.
How to Use It in Practice
Setup
STH Realized Price is available on CryptoQuant and Glassnode. Track the daily value alongside current BTC spot price. Note the spread: (spot price - STH RP) / STH RP = STH unrealized PnL %.
Trigger
- Buy signal candidate: Price touches STH RP from above + STH SOPR 7DMA holds above 1.0 + Funding Ratesreset to neutral/negative
- Caution signal: Price breaks below STH RP on volume + STH RP begins declining (cohort selling at a loss)
- Bear confirmation: STH RP converges toward Aggregate Realized Price ($54,470 as of March 2026) with no recovery
Confirm
- STH SOPR 30DMA: above 1.0 = STHs selling at profit (bull), below 1.0 = selling at loss (bear)
- MVRV Ratio: MVRV 1.23 (March 2026) = moderate undervaluation, not extreme
- NUPL: if NUPL turns negative, market-wide capitulation aligns with STH RP break
Invalidates when
- Price reclaims STH RP from below and holds for 2+ weeks = signal reset, regime flipping bullish
- LTH RP rising faster than price decline (LTH cohort absorbing STH sell-offs) = structural support building
Action
Use STH RP as a dynamic reference, not a hard entry/exit. In a bull market: treat STH RP touches as DCA accumulation zones. In a bear market: treat STH RP as the overhead resistance ceiling when evaluating short-term rally exits.
Common Pitfalls
- Treating STH RP as a precise level, not a zone: The STH RP is a weighted average - price can deviate 5-15% from it without regime change. Use ±1 standard deviation bands (STH RP +0.5 STD, STH RP -0.5 STD) for tighter entries. At the ATH in October 2025: STH RP +1 STD = $131,310; STH RP itself = $112,084.
- Ignoring the LTH RP direction: LTH RP rising while price falls narrows the spread. This matters: the "capitulation distance" (how far price must fall to hit LTH RP) is shrinking each cycle as more institutional capital with higher cost bases ages into the LTH cohort. LTH RP is no longer ~$6,000 as in 2018 - it reached ~$39,000 by early 2026.
- Confusing STH Realized Cap with STH Realized Price: STH Realized Cap is the total dollar value of STH positions; STH Realized Price is the per-coin average. Both declined in the 2025-2026 correction, but for different reasons. Cap declined partly due to price falling, partly due to holders exiting at a loss. Track both separately.
- Applying the crossover rule without cycle context: The STH RP / LTH RP crossover (STH below LTH = bottom signal) has been observed in 2015, 2018, and 2022. However, institutional Bitcoin (ETFs, corporate treasuries, sovereign entities) may alter this mechanic. LTH RP rising faster than in prior cycles means the "crossover zone" is structurally higher. A crossover may not happen at all in Cycle 4-5.
- False signals from UTXO consolidation events: Large custodial moves can distort STH RP readings temporarily. On January 23, 2026, a UTXO consolidation of 217,000 BTC in block 933503 created a false signal spike - no economic sale occurred. Filter using 7DMA or 30DMA rather than daily readings.
Ignoring cohort-level granularity: The aggregate STH RP masks wide dispersion. In March 2026: the very newest buyers (1w-1m cohort) have a cost basis much closer to current price, while the 3m-6m cohort is at a massive unrealized loss. These cohorts face very different sell pressures. See
Bitcoin STH Realized Price cost basis framework for per-cohort breakdown.
STH vs LTH Realized Price vs Other Cost Basis Metrics
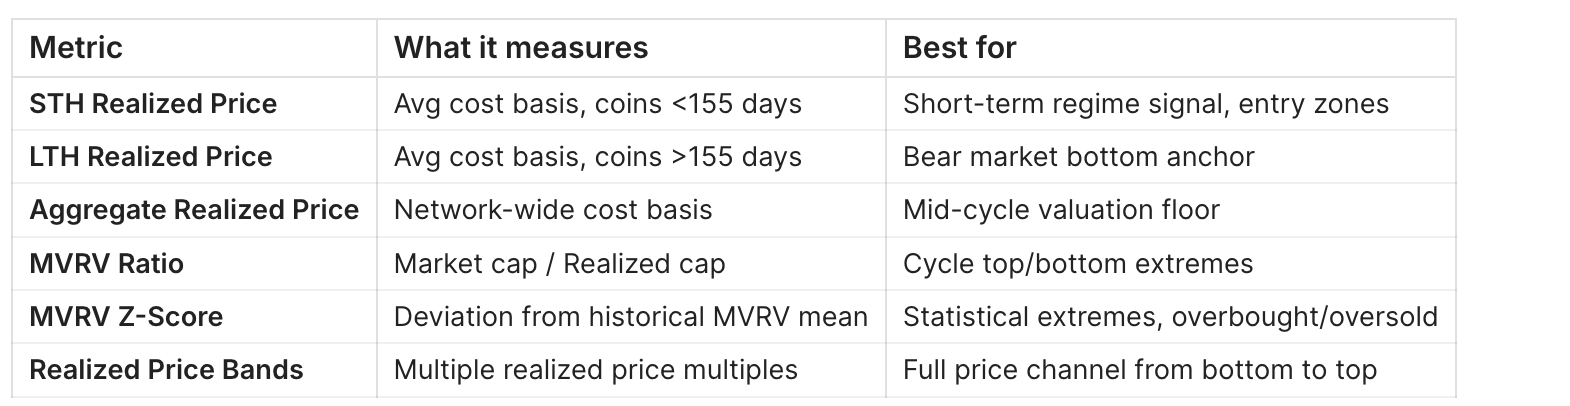
The STH vs LTH comparison is unique because it directly maps the transfer of supply between cohorts - the mechanism of distribution (LTH sells to STH at cycle tops) and re-accumulation (LTH buys from capitulating STH at cycle bottoms).
FAQ
Q: What is the current STH Realized Price in March 2026?
A: As of early March 2026, the aggregate STH Realized Price is approximately $89,000. BTC is trading near $67,175 (March 8, 2026), placing price significantly below the aggregate STH RP - a transition/correction zone.
Q: What is the LTH Realized Price right now?
A: As of late February/early March 2026, LTH Realized Price is approximately $39,000 (Darkfost, CryptoQuant). This is far below current BTC price. LTHs are sitting on massive unrealized profits at current prices. This level has not been tested since the 2022 bear market.
Q: What does it mean when STH Realized Price drops below LTH Realized Price?
A: Historically this crossover has occurred at bear market cycle bottoms (2015, 2018, 2022). It signals that the average recent buyer's cost basis has fallen below the average long-term holder's cost basis - an extreme capitulation event where even "smart money" LTH cohorts are below water relative to the newest buyers. Bull market recovery typically begins when STH RP reclaims above LTH RP. Note: this crossover has not occurred in the current cycle (Q1 2026).
Q: Is the LTH Realized Price a reliable buy zone?
A: Historically yes, but with important caveats. Each cycle the LTH RP is higher (2018: ~$6,000; 2022: ~$20,800; 2026: ~$39,000). The "distance" to LTH RP from current price is still substantial in March 2026. Institutional participation may prevent price from reaching LTH RP in future cycles. Use it as a reference anchor for maximum bear scenario, not a guaranteed entry.
Q: How do ETF inflows affect STH vs LTH Realized Price?
A: ETF-held BTC is classified based on on-chain movement patterns. When ETFs buy and hold, those coins age into the LTH cohort over 155 days, raising LTH RP faster than in pre-ETF cycles. This structural change compresses the spread between STH RP and LTH RP over time and means LTH RP is rising faster than historical precedent. The traditional "crossover = bottom" signal may be weaker going forward.
Q: What is the difference between STH Realized Price and STH Realized Cap?
A: STH Realized Price = average per-coin cost basis for coins held <155 days. STH Realized Cap = total dollar value of all STH positions (Realized Price x number of STH coins). The Cap declined from $658B (November 2025) to $535B (March 2, 2026), a $123B contraction, reflecting both the price decline and capital exiting the short-term cohort.
Q: Where can I find live STH and LTH Realized Price data?
A: CryptoQuant (cryptoquant.com) tracks both metrics with daily granularity and sub-cohort breakdowns (1w-1m, 1m-3m, 3m-6m, 6m-12m). Glassnode and Checkonchain also publish these metrics. For the MVRV breakdown by cohort, use the STH-MVRV and LTH-MVRV charts on CryptoQuant.
Q: Does the 155-day threshold still apply after ETFs and institutions?
A: The 155-day threshold remains the standard used by Glassnode and CryptoQuant, as it is based on on-chain holding behavior patterns that have remained statistically valid. ETF and institutional BTC follows the same UTXO aging rules. However, the behavioral interpretation may evolve as institutions do not panic-sell at the same thresholds as retail STHs, potentially reducing the sell pressure when STH RP is broken.
Related Guides
- Bitcoin LTH vs STH: Supply Dynamics, Cost Basis & Market Structure - Foundational overview of the LTH/STH framework
- Bitcoin STH Realized Price: Definition, Formula & Cost Basis Framework - Per-cohort breakdown of the 1w-1m, 1m-3m, 3m-6m levels
- Bitcoin MVRV Ratio: Definition, Formula & Cycle Signals - MVRV as the ratio version of the same cost basis logic
- MVRV Z-Score: How to Identify Bitcoin Market Tops and Bottoms - Statistical extremes using realized price deviation
- Bitcoin Realized Price Bands Explained - Full price channel framework using realized price multiples
- Bitcoin STH SOPR: What It Is and How to Use It - Confirmation signal for STH regime (profit vs loss on-chain)
- Bitcoin NUPL: Net Unrealized Profit/Loss Explained - Market-wide unrealized PnL framework
- Realized Profit vs Unrealized Profit: What's the Difference - Mechanics of realized vs unrealized gains by cohort
- Bitcoin Supply in Profit: Definition, Thresholds & Market Signals - % of supply in profit as a complementary regime indicator
- Coin Days Destroyed (CDD) & Liveliness - LTH behavioral signal: when old coins move
Key Takeaways
- STH RP (~$89,000 in March 2026) is the critical line separating bull and bear market structure for recent buyers; LTH RP (~$39,000) is the historical bear bottom anchor
- The crossover signal (STH RP below LTH RP) has marked every major cycle bottom since 2015 but has not triggered in the current correction
- Use STH RP as a dynamic support/resistance zone with ±1 STD bands, not a precise entry level; confirm with STH SOPR, MVRV, and NUPL before acting
- Next step: Read Bitcoin LTH vs STH: Supply Dynamics, Cost Basis & Market Structure for the full supply transfer framework between these two cohorts