


TL;DR
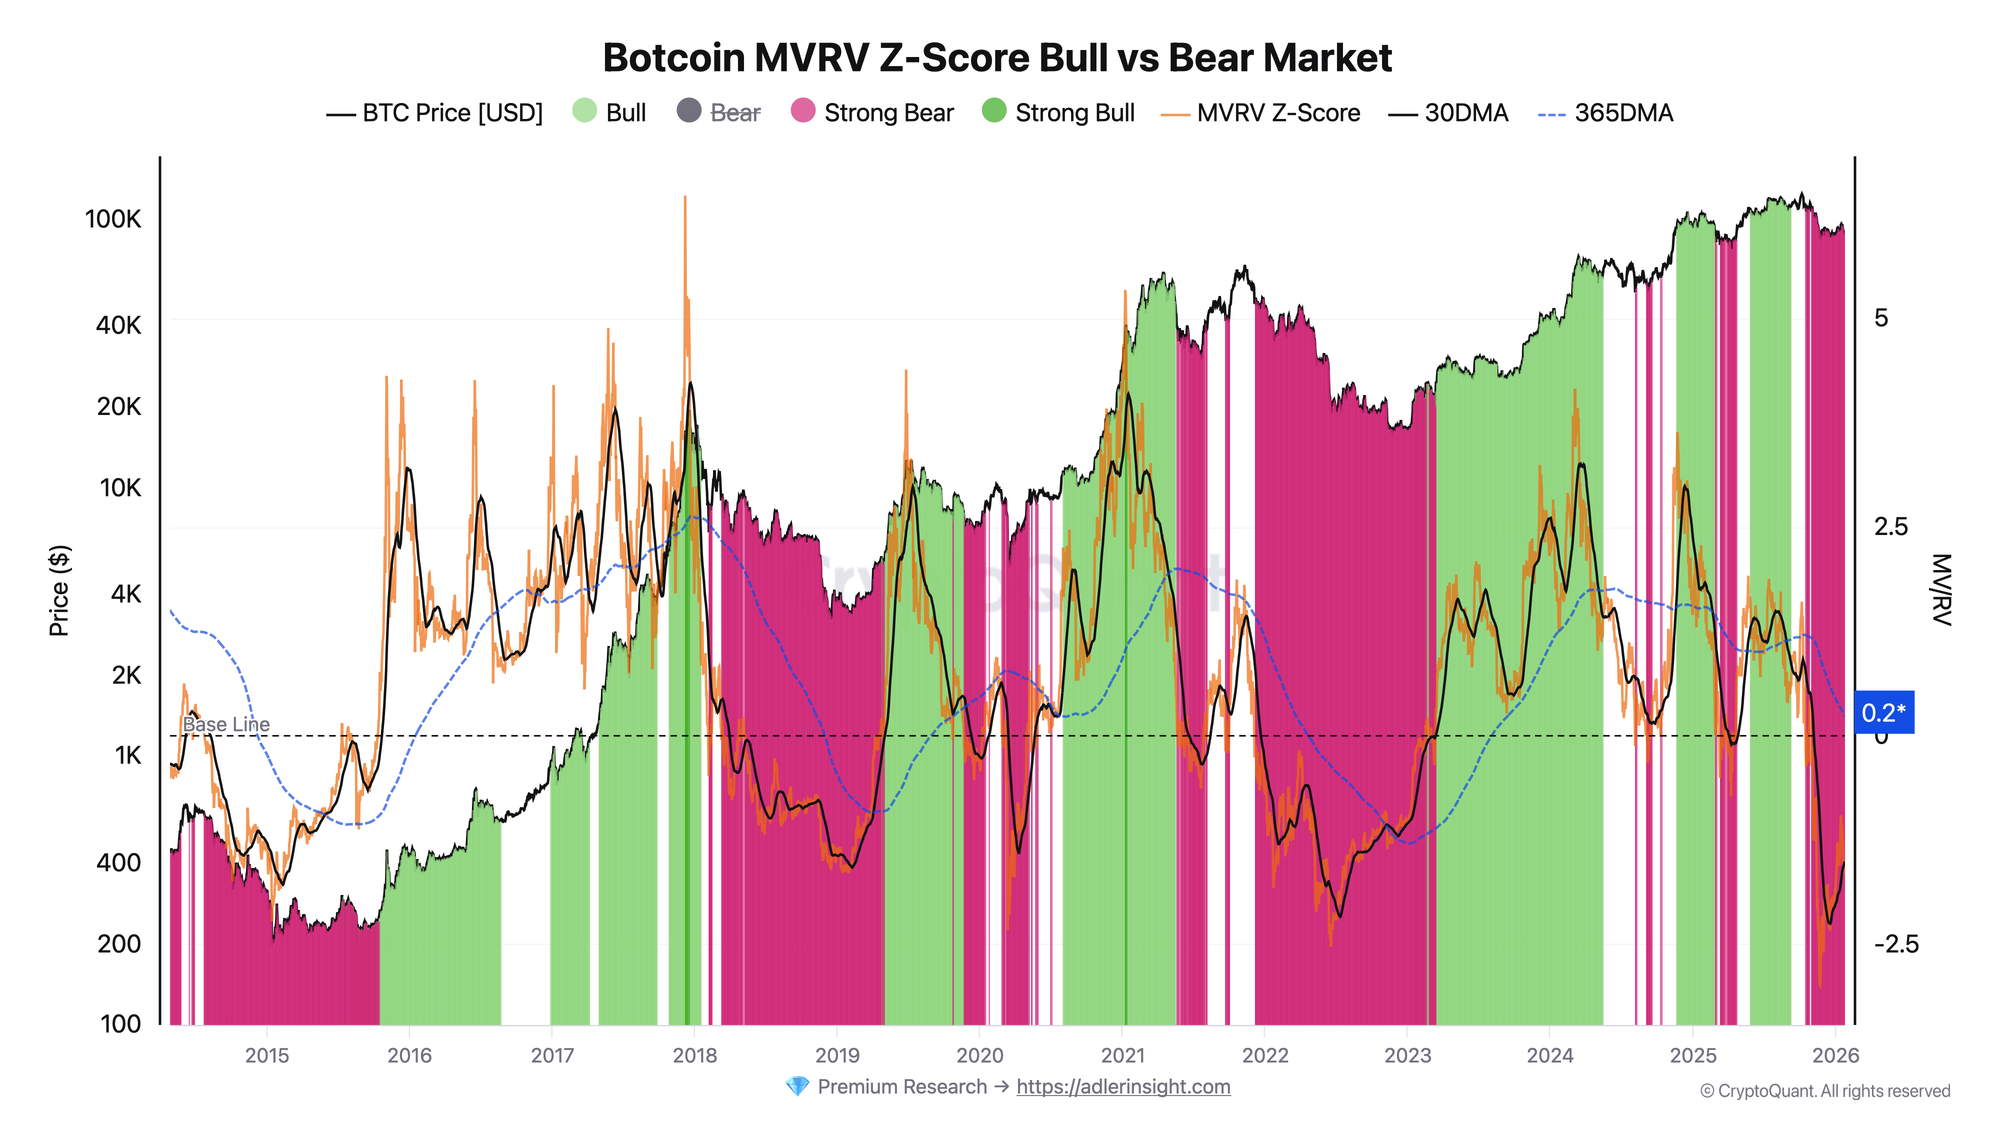
MVRV Z-Score measures how far Bitcoin's market value deviates from its realized value (aggregate cost basis), normalized by historical volatility.
- High Z-Score (>6) → overheating, distribution risk
- Low Z-Score (<0) → capitulation, accumulation opportunity
- Use as a risk zone tool, not a timing signal — always confirm with NUPL, STH SOPR, and Exchange Netflow.
What is MVRV Z-Score?
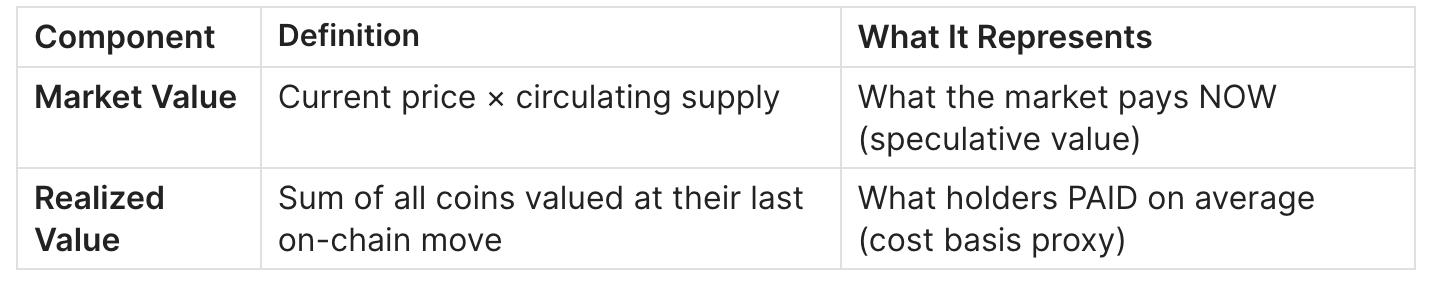
MVRV (Market Value to Realized Value) compares two fundamental valuations:
Bitcoin MVRV Ratio — axeladlerjr.com
MVRV Z-Score normalizes this ratio using standard deviation, making it comparable across different market regimes and cycles.
Why Z-Score Matters
Raw MVRV can be distorted by:
- Regime shifts (spot vs leverage dominance)
- Long consolidation periods
- Lost coins inflating realized value baseline
Z-Score acts as a temperature gauge — it shows how extreme current conditions are relative to Bitcoin's entire history.
Origin
The metric was developed by Murad Mahmudov and David Puell, with further refinement by @aweandwonder. It became one of the most cited on-chain indicators for cycle analysis.
For the foundational MVRV Ratio explanation, see: Bitcoin MVRV Ratio: Definition, Formula & Cycle Signals
The Formula Explained
MVRV Z-Score = (Market Value - Realized Value) / StdDev(Market Value)
Breaking It Down
- Market Value - Realized Value = raw deviation between speculation and cost basis
- Standard Deviation = historical volatility measure
- Result = how many "standard deviations" away from normal
Interpretation:
- Z-Score of +3 means market value is 3 standard deviations above realized value
- Z-Score of -1 means market value is 1 standard deviation below realized value
How to Read the Chart: Critical Thresholds
MVRV Z-Score provides risk zones, not precise timestamps. Markets can remain at extremes for weeks or months.
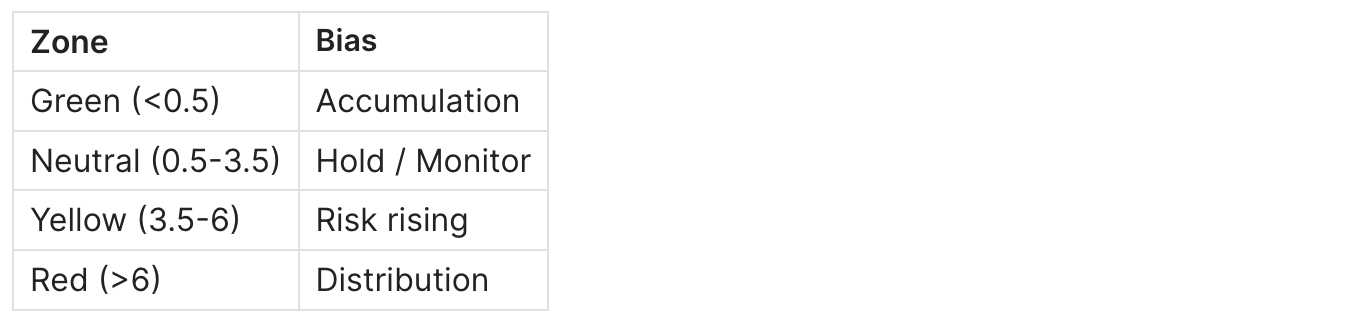
🔴 Red Zone (Z-Score > 6): Extreme Overvaluation
What happens in this zone:
- Most holders sit on large unrealized profits
- Distribution pressure builds
- Late-cycle demand becomes fragile
- Smart money begins scaling out
Historical Examples:

How to act:
- Do NOT "sell everything" — this is a zone, not a signal
- Shift to risk-off posture
- Scale out using confirmation signals (see framework below)
- Avoid adding leverage positions
🟡 Yellow Zone (Z-Score 3.5 - 6): Elevated Risk
This is the distribution prep zone. Bull market can continue, but risk/reward degrades.
Characteristics:
- Price may grind higher
- Leverage and funding rates elevated
- Retail FOMO intensifying
- Smart money reducing exposure
Historical Example:

How to act:
- Keep core position but reduce marginal exposure
- Tighten risk management rules
- Avoid chasing breakouts without confirmation
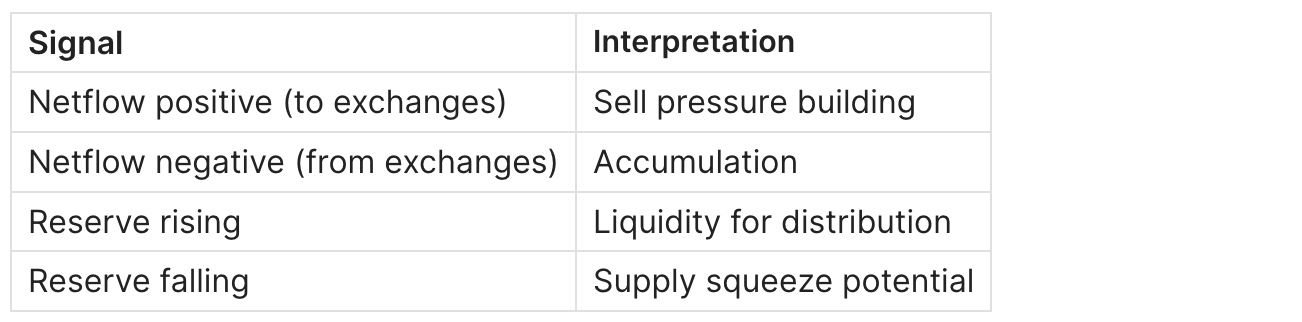
- Monitor Exchange Netflow for distribution signals
🟢 Green Zone (Z-Score < 0.5): Accumulation Territory
What happens in this zone:
- Broad unrealized losses across the market
- Low conviction environment
- Media sentiment negative
- Long-term opportunity zone
Historical Examples:

How to act:
- Allocate gradually (DCA approach)
- Focus on survival and long-term horizon
- Confirm with capitulation signals in NUPL
- Watch LTH vs STH dynamics for accumulation confirmation
Price vs Z-Score Divergence: Advanced Signal
One of the most powerful applications of MVRV Z-Score is identifying divergence between price action and on-chain valuation.
Bearish Divergence (Distribution Warning)
Pattern: Price makes higher highs, but Z-Score makes lower highs.
What it means: Market value is rising, but the rate of speculation relative to cost basis is declining. This suggests:
- New buyers are entering at higher prices (raising realized cap faster)
- Leverage may be driving price more than spot demand
- Distribution is occurring under the surface
Historical Example:
- Q4 2021: BTC price reached $69,000 (new ATH), but Z-Score peaked at 1.73 — far below the 5.34 reading from January 2021. This bearish divergence preceded the 2022 bear market.
Bullish Divergence (Accumulation Signal)
Pattern: Price makes lower lows, but Z-Score makes higher lows.
What it means: Market is finding support at higher valuation floors. Strong hands are accumulating despite price weakness.
Historical Example:
- Q3-Q4 2022: After the FTX collapse, BTC price made new lows around $15,500, but Z-Score (-1.36) was higher than the June 2022 bottom (-2.53). This bullish divergence signaled accumulation phase.
How to Use Divergence
- Identify price trend (higher highs/lower lows)
- Compare Z-Score peaks/troughs at same points
- Divergence = early warning, not immediate signal
- Confirm with NUPL and exchange flow changes
Historical Zone Distribution
Based on data since 2013:
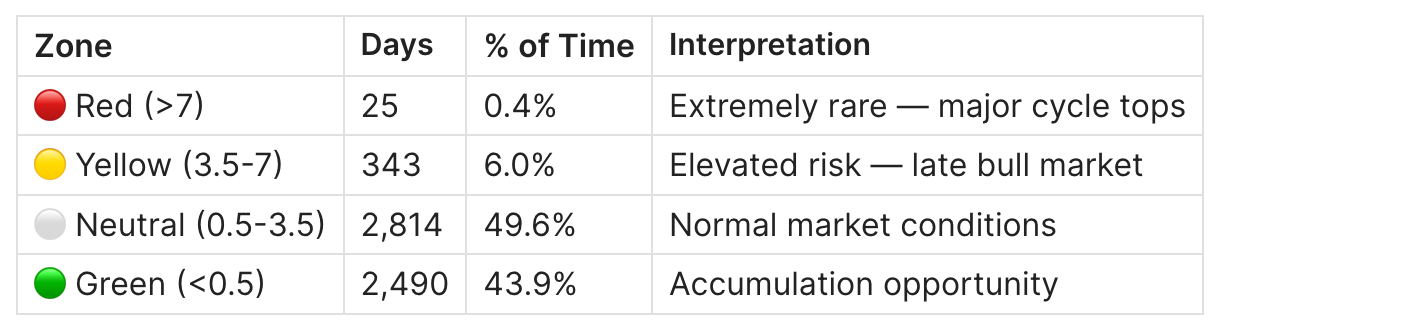
Key insight: Bitcoin spends ~44% of its time in the green zone. Patience is rewarded.
Common Mistakes and Limitations
Mistake #1: Using Z-Score in Isolation
Z-Score alone cannot distinguish between:
- Healthy bull expansion
- Late-cycle overheating
- Temporary pullback vs regime change
Fix: Always confirm with:
- NUPL — sentiment and profit regime
- STH SOPR — short-term selling pressure
- Exchange Netflow — distribution pathways
Mistake #2: Expecting Precise Timing
Z-Score can remain in extreme zones for weeks or months.
Example: In 2013, Z-Score stayed above 6 for over 30 days before the final top.
Fix: Use scale-out rules and confirmation triggers, not single-point exits.
Mistake #3: Ignoring ETF Impact (Post-2024)
Spot Bitcoin ETF approval changed market structure:
- New demand channel (institutional)
- Different flow patterns
- Potentially extended cycle duration
- Classic thresholds may shift
Fix: Add ETF context layer:
- Monitor ETF inflow/outflow alongside Z-Score
- Recognize that high Z-Score periods may last longer
- Adjust expectations for "new normal" in institutional era
Mistake #4: Lost Coin Bias
Permanently lost coins (~3-4M BTC) inflate the Realized Value baseline, affecting Z-Score calculations.
Fix: Treat Z-Score as a comparative risk tool, not absolute truth. Focus on direction and rate of change.
Mistake #5: Confusing MVRV and MVRV Z-Score
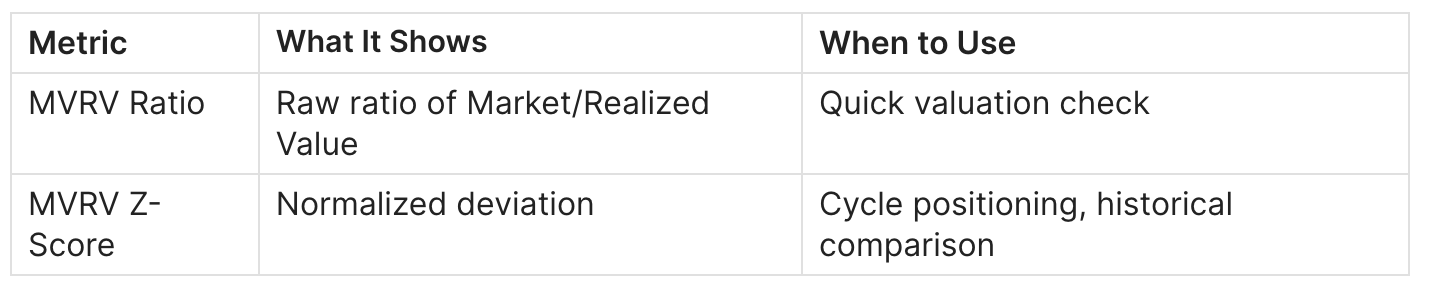
For detailed MVRV explanation: Bitcoin MVRV Ratio Guide
Advanced Variant: MVRV Z-Score 2YR Rolling
The traditional Z-Score uses Bitcoin's entire price history for standard deviation calculation. This includes extreme early-market volatility (2010-2013) that may distort modern readings.
The Problem
As Bitcoin matures:
- Volatility decreases
- Institutional participation changes market structure
- Early extreme data points become less relevant
This can cause traditional Z-Score to:
- Never reach classic "red zone" levels
- Show dampened signals in later cycles
The Solution: 2YR Rolling
Instead of full history, calculate standard deviation using only the previous 2 years of data.
Benefits:
- Better adapts to current market regime
- More responsive to institutional era changes
- Maintains accuracy for top/bottom identification
Tradeoff:
- Loses long-term historical context
- May show more false signals in short-term
Recommendation: Use both variants:
- Traditional Z-Score for long-term cycle positioning
- 2YR Rolling for current regime sensitivity
The Alpha: Multi-Indicator Confirmation Framework
Step 1: Identify Z-Score Zone
Step 2: Confirm with NUPL
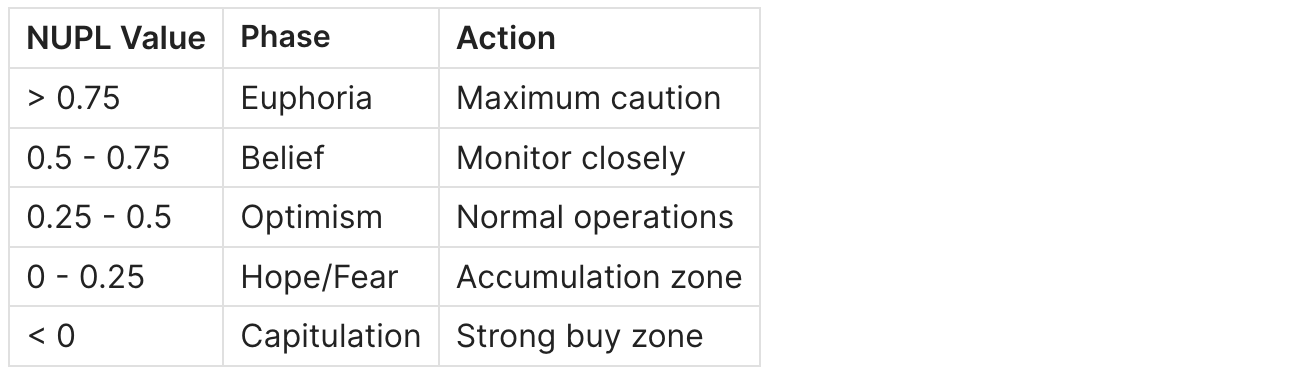
See: NUPL Guide
Step 3: Validate with Exchange Flows
Step 4: Final Check with STH SOPR
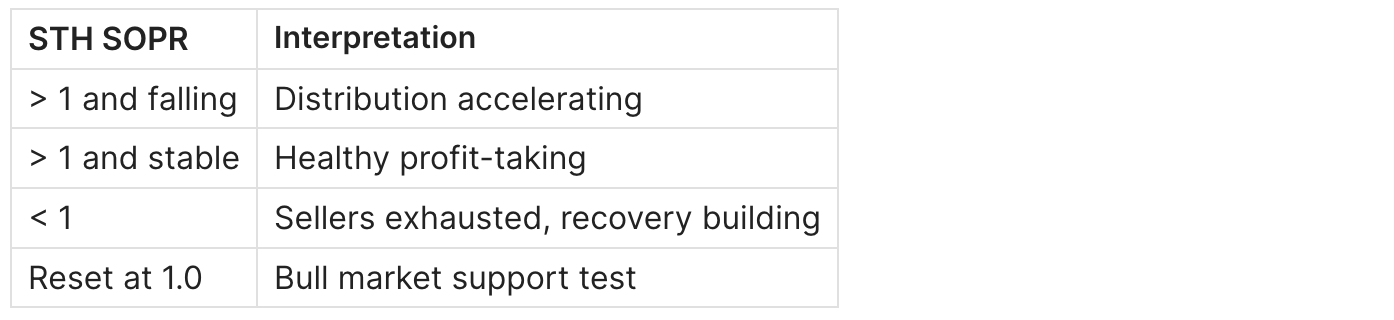
See: STH SOPR Guide
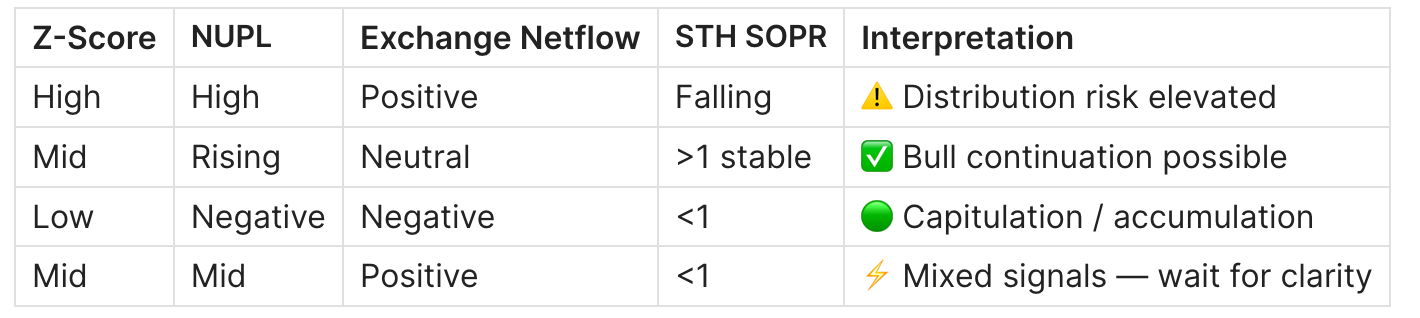
Signal Matrix
Practical Application: Real Trade Examples
Example 1: Q4 2022 Accumulation
Context: Post-FTX collapse
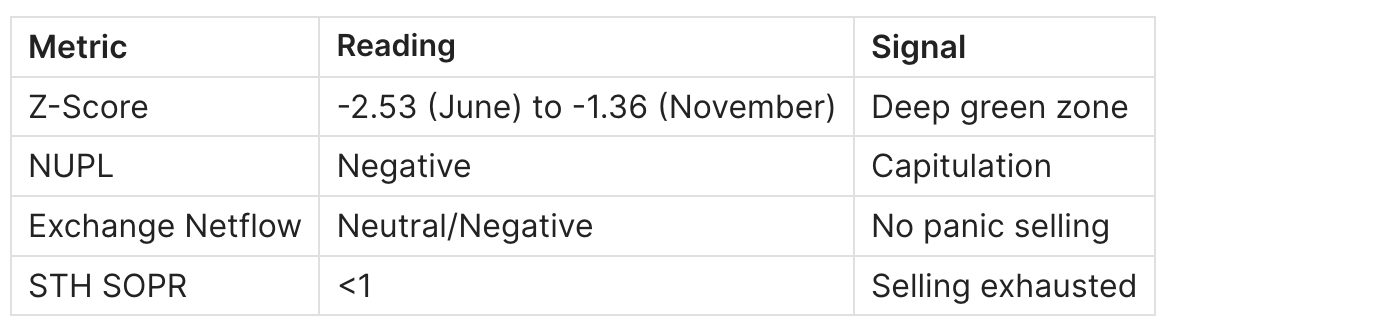
Entry Logic: Scale-in over 2-3 months using DCA
Result: Entry around $16,000-20,000 → BTC reached $73,000 by March 2024 (+350%)
Example 2: Q1 2024 Elevated Risk
Context: Pre-halving rally, ETF approval euphoria
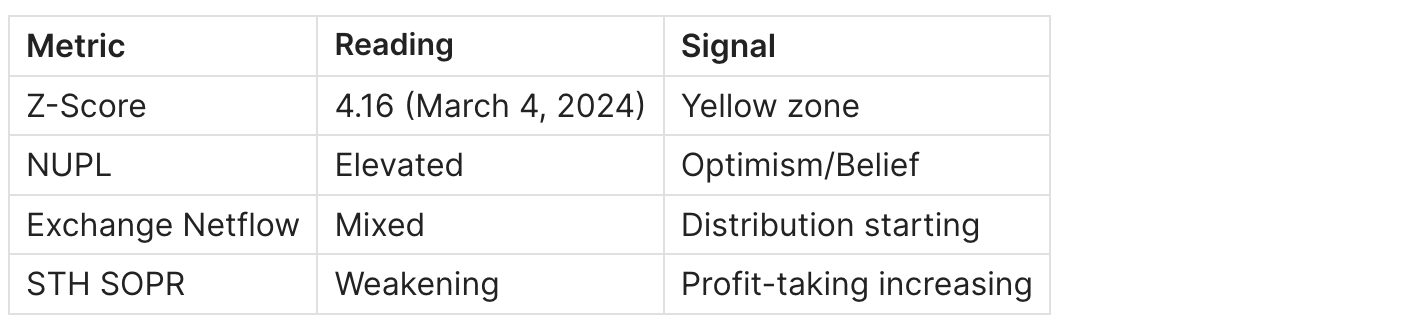
Action: Reduced leverage exposure, scaled out 20% of position
Result: BTC corrected from $65K to $56K (-14%) before halving
Current Market Context

Interpretation
Current Z-Score is in accumulation territory despite price being near all-time highs. This unusual divergence suggests:
- Realized Cap has grown significantly — cost basis of holders elevated
- Market structure shifted — ETF and institutional holdings changed dynamics
- Long-term holders absorbed supply — see LTH vs STH analysis
What to Watch
- NUPL recovery — shift from negative to positive signals sentiment change
- STH SOPR behavior — reset above 1.0 confirms bull support
- Exchange reserves trend — continued decline = bullish supply dynamics
- ETF flow persistence — sustained inflows = structural demand
Where to Track MVRV Z-Score
- Glassnode - Most comprehensive, professional grade
- CryptoQuant - Good alternative, strong derivatives data
- Bitcoin Magazine Pro - Good educational context
FAQ
What is a good MVRV Z-Score to buy Bitcoin?
Historically, Z-Score below 0 has marked strong accumulation opportunities. Values below -1 have preceded major rallies in every cycle since 2013. However, "good" depends on your time horizon — Z-Score of 0-1 may still offer reasonable entry for multi-year holders.
Has MVRV Z-Score ever given false signals?
Yes. Z-Score can remain elevated without immediate reversal. The 2013 cycle saw Z-Score above 6 for over a month. That's why confirmation from other metrics is essential. The best results come from combining Z-Score with NUPL, SOPR, and exchange flow analysis.
What's the difference between MVRV and MVRV Z-Score?
MVRV is a simple ratio (Market Value / Realized Value). Z-Score normalizes this using standard deviation, making it more reliable for cross-cycle comparison. Think of MVRV as raw temperature, Z-Score as "how unusual is this temperature for this time of year."
How often should I check MVRV Z-Score?
Weekly is sufficient for macro positioning. This is a long-term cycle indicator, not a day-trading tool. Checking more frequently may lead to overtrading and noise interpretation.
Can MVRV Z-Score be used for altcoins?
Not reliably. Altcoins have different liquidity profiles, shorter histories, and less robust on-chain data. The realized value concept is most meaningful for Bitcoin due to its UTXO model and long transaction history.
What does negative Z-Score mean?
It means Market Value is below Realized Value — the market is trading below aggregate cost basis. Historically, this is a strong accumulation signal that has preceded every major bull run.
Why doesn't Z-Score reach the same highs as previous cycles?
Several factors contribute to dampening cycle tops:
- Institutional involvement absorbs volatility
- Derivatives market redistributes speculation off-chain
- ETF flows create structural demand that wasn't present before
- Market maturity naturally reduces extreme deviations
Is current Z-Score reliable given ETF changes?
The metric remains valuable but requires contextual adjustment. ETFs don't directly affect on-chain realized value calculations, but they change demand structure and price discovery mechanisms. Use Z-Score alongside ETF flow data for complete picture.
Related Metrics
Build a complete on-chain framework with these complementary indicators:
- Bitcoin MVRV Ratio: Definition, Formula & Cycle Signals
- Bitcoin NUPL: What It Is and How to Use It
- Bitcoin STH SOPR: What It Is and How to Use It
- Bitcoin Exchange Netflow: What It Is and How to Use It
- Bitcoin LTH vs STH: Supply Dynamics & Market Structure
- Bitcoin Realized Price Bands Explained
Key Takeaways
- MVRV Z-Score is a risk zone indicator, not a timing tool
- Historical accuracy is high - every major cycle top and bottom since 2013 was marked by extreme Z-Score readings
- Never use in isolation - combine with NUPL, SOPR, and Exchange Flows
- ETF era may shift thresholds - classic levels need recalibration in institutional market
- Patience is rewarded - Bitcoin spends 44% of time in green zone