


Reading time: ~12 minutes | Level: intermediate / advanced
Three indicators - ETF flows, Coinbase Premium Index, and miner OTC balance - form a unified early-detection system for institutional Bitcoin demand. Unlike retail metrics, they reflect the behavior of players who move the market rather than follow it.
Last updated: June 14, 2026
Institutional Flow Snapshot
| Coinbase Premium Index (SMA-7) | -0.0659 |
| CPI Signal | Negative — US institutional demand absent |
| Exchange Reserve | 2710.6K BTC (+26 BTC vs prev day) |
| Exchange Netflow (7d sum) | +0.0K BTC |
| Miner Reserve | 1802.0K BTC (-123 BTC vs prev day) |
| Signal | 🔴 Bearish — institutional demand absent, supply pressure rising |
Data: CryptoQuant · Updated weekly every Monday · Want daily on-chain signals? Join Adler AM
TL;DR
- ETF flow shows net demand from regulated capital: sustained inflows = structural price support
- Coinbase Premium Index > 0 means US institutional buyers are paying more than the global market - a reliable buy signal
- Miner OTC balance has declined from ~595K BTC (2018) to ~150K BTC (March 2026) - absorption without market impact
- All three indicators work together: a simultaneous signal from all three increases the reliability of the assessment
- Key limitation: ETF data is published with a T+1 delay, OTC is partially opaque, Coinbase Premium reacts to arbitrage noise
Contents
- [Why Track Institutional Flows?]
- [Bitcoin ETF Flows and Liquidity Impulse]
- What it is and how it is calculated
- Interpretation zones
- Historical examples
- [Coinbase Premium Index]
- What it is and the formula
- Interpretation zones
- Historical examples
- [Miner OTC Balance]
- Interpretation zones
- Historical examples
- [The Three-Indicator System: Combined Analysis]
- [Practical Application: Playbook]
- [Comparison with Other Metrics]
- [Limitations]
- [FAQ]
- [Conclusion and CTA]
Why Track Institutional Flows?
Bitcoin has matured. Since January 2024, it has had regulated infrastructure for large capital - spot ETFs in the US. This has changed the nature of the market: a significant portion of demand is now formed not through the exchange order book, but through three hidden channels:
- Regulated ETF funds - BlackRock (IBIT), Fidelity (FBTC), Grayscale (GBTC), and others buy Bitcoin through authorized participants, leaving no trace in the order book.
- Coinbase Pro - the primary trading venue for US institutions; the price divergence from Binance signals their activity.
- OTC desks - off-exchange transactions by large buyers who deliberately avoid market impact.
By analyzing all three channels simultaneously, you can get a leading signal that technical indicators cannot provide.
1. Bitcoin ETF Flows and Liquidity Impulse
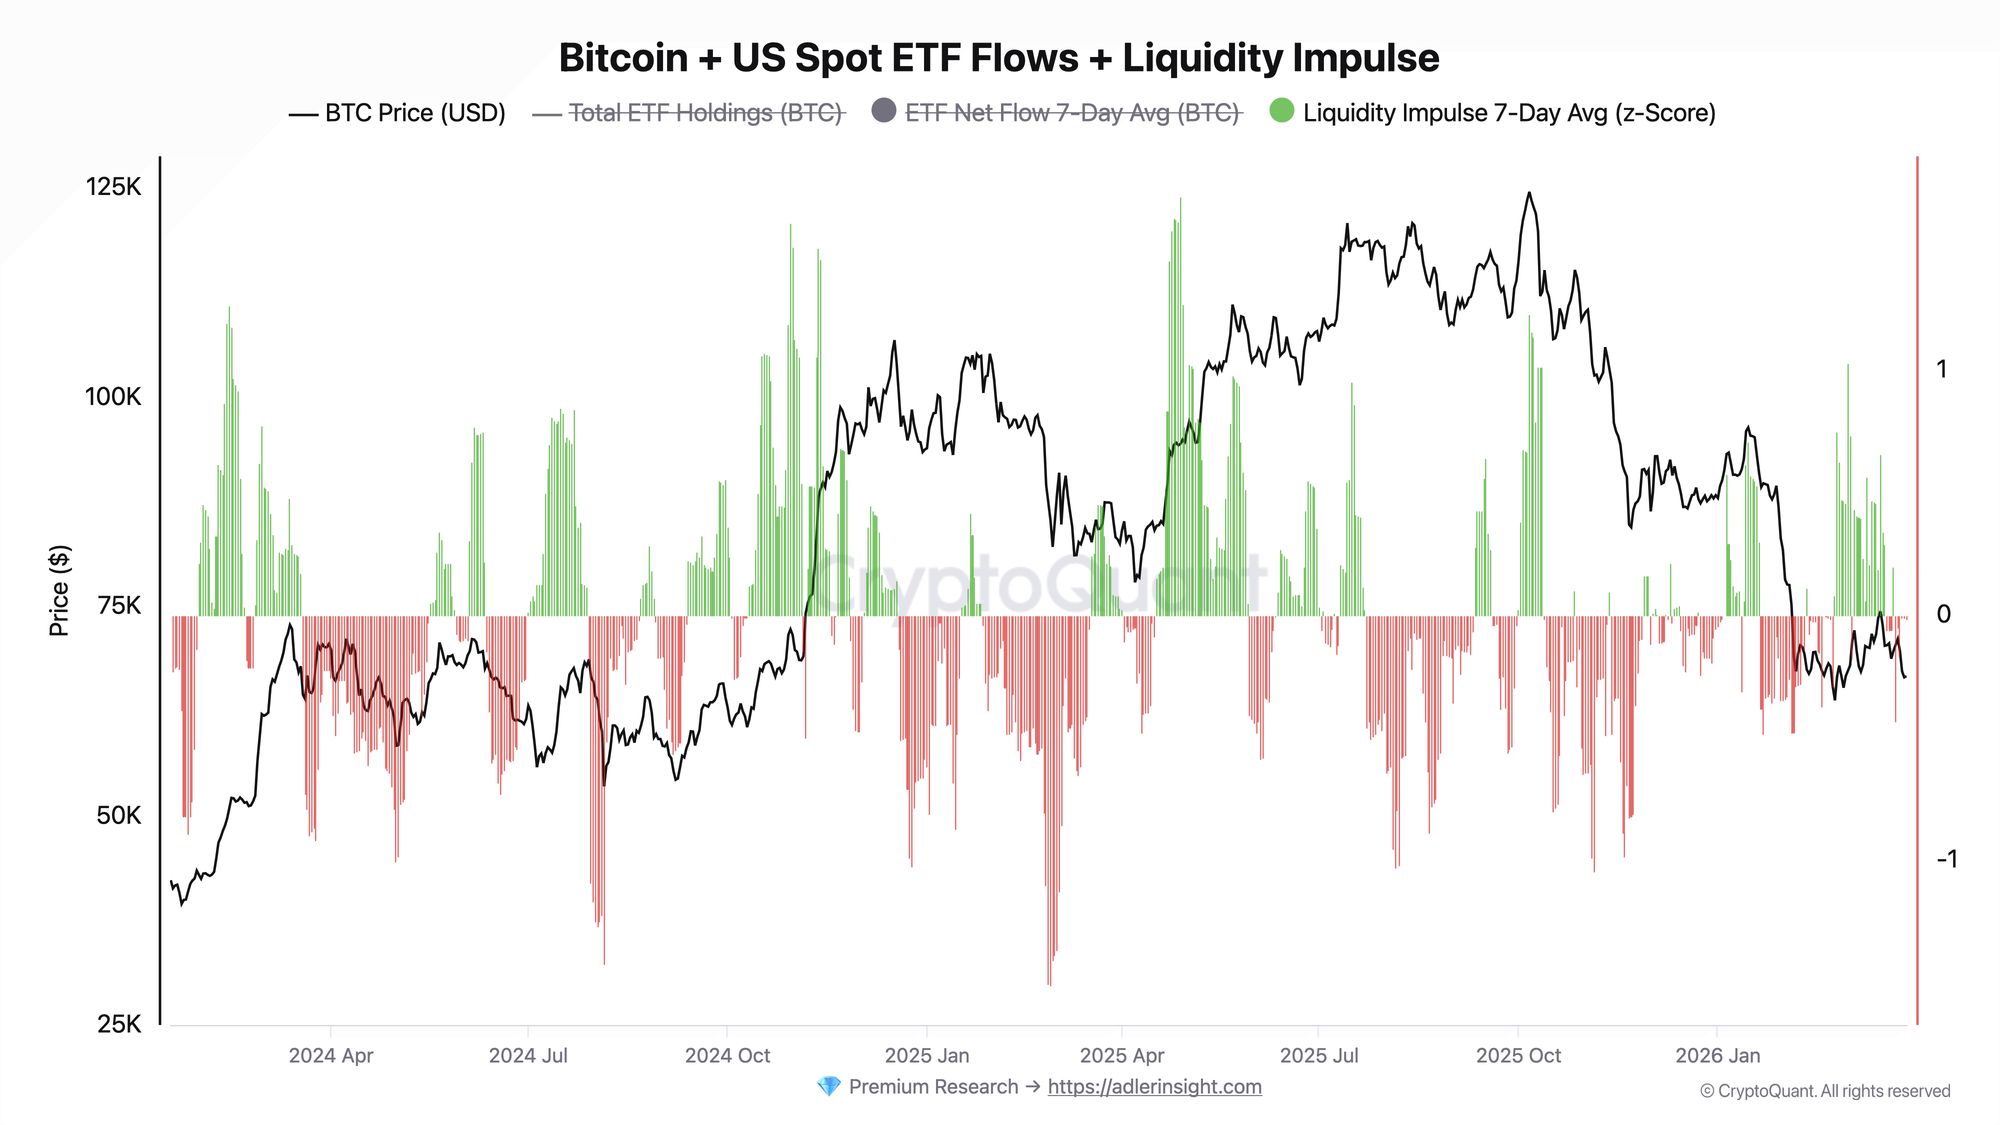
What Are Bitcoin ETF Flows?
Spot Bitcoin ETFs operate through a creation and redemption mechanism. When an authorized participant (a large broker) sees demand, it delivers a basket of assets to the fund and receives new ETF shares - the fund in turn buys real BTC on the market. Redemption works in reverse.
Three key variables:
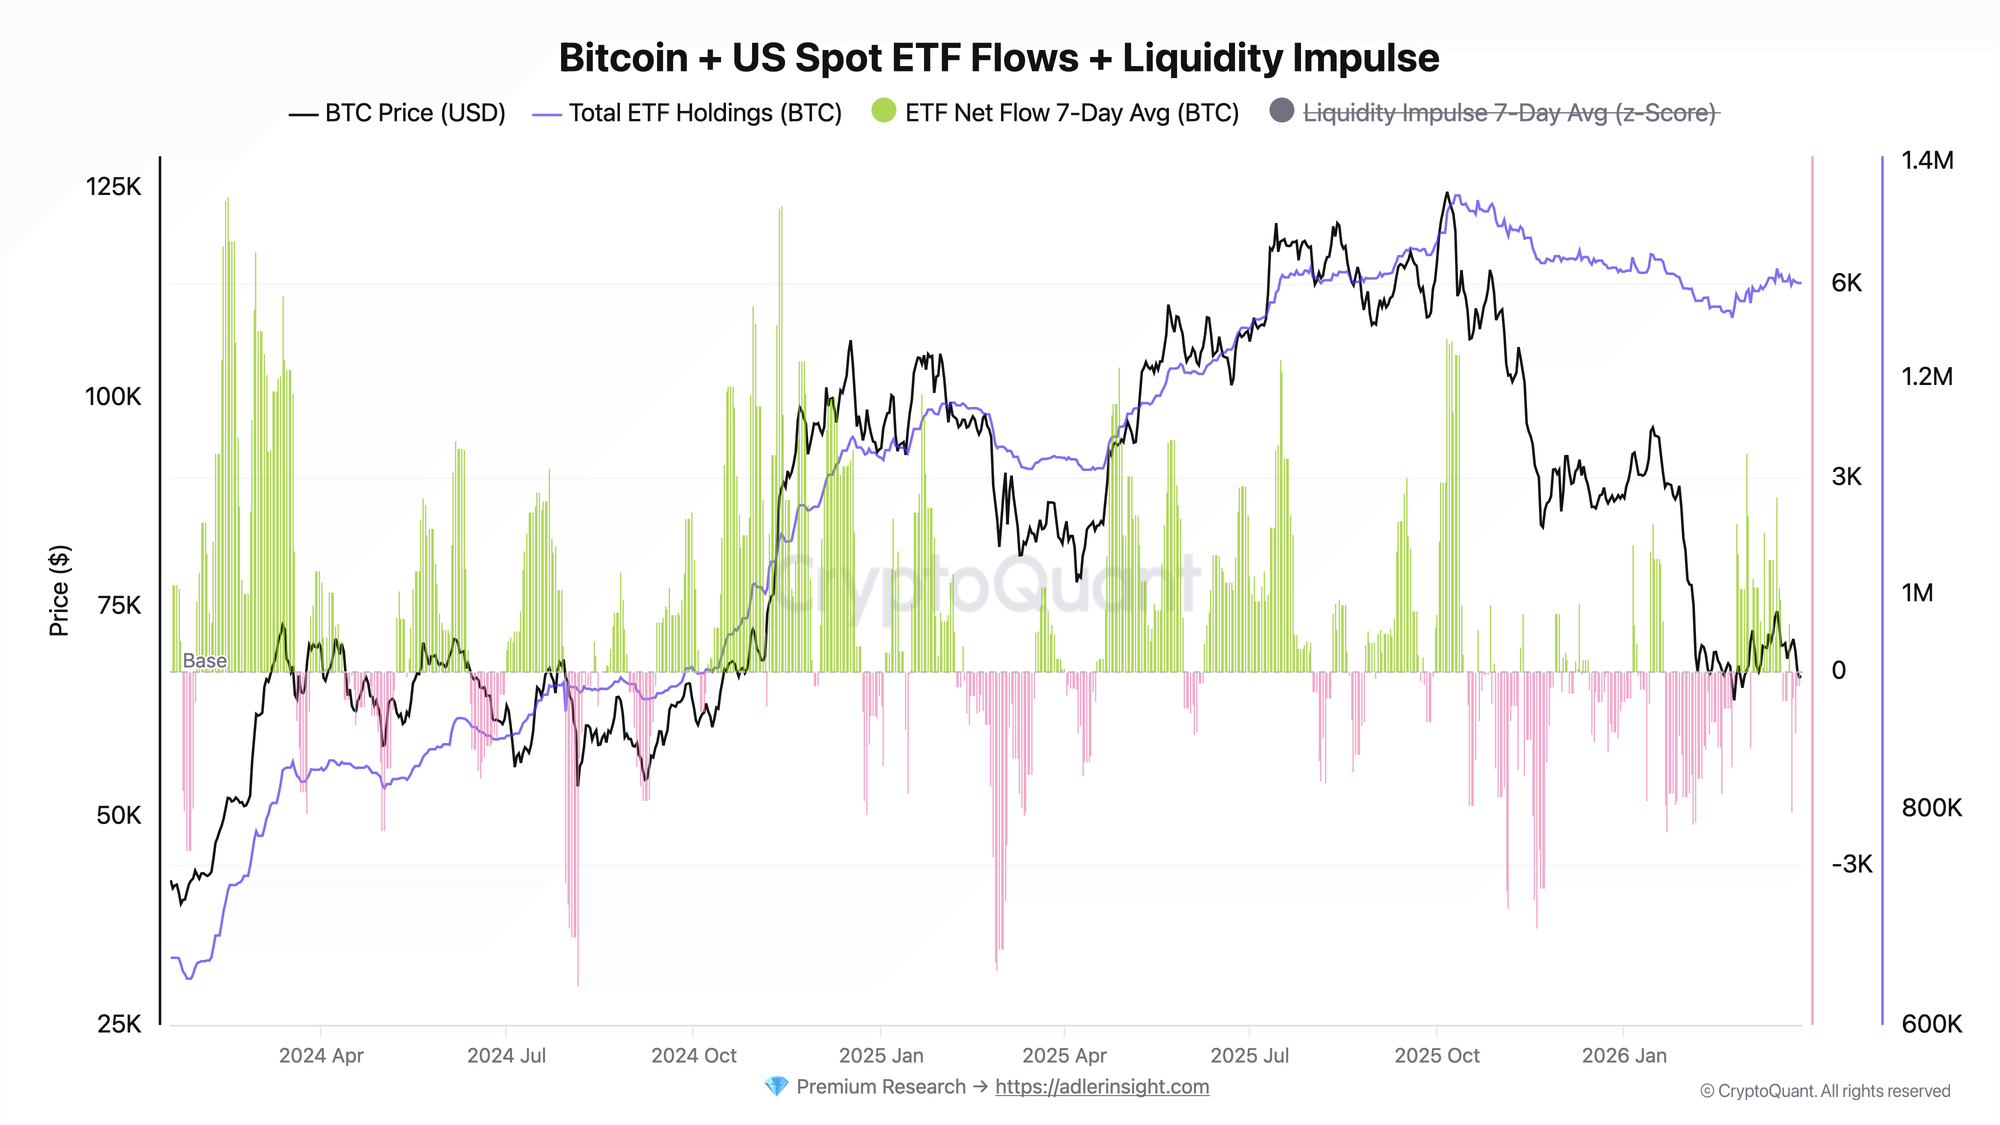
- Total ETF Holdings (BTC) - the total Bitcoin held under management by all ETFs. As of March 2026, it has exceeded 1.28 million BTC (peak in October 2025: ~1.37 million BTC).
- ETF Net Flow 7-Day Avg (BTC) - the moving average of net inflow/outflow over 7 days. Smooths out single-day noise and identifies sustained trends. From January 2024 to March 2026, the average daily flow was approximately +880 BTC.
- Liquidity Impulse 7-Day Avg (z-Score) - a normalized measure of flow strength relative to the historical average. A value > +1.0 indicates an abnormally strong inflow; < -1.0 indicates an abnormal outflow.
Formula
ETF Net Flow (day) = ETF Holdings (day N) - ETF Holdings (day N-1)

Net Flow 7d Avg = Average(Net Flow over the last 7 days)

Liquidity Impulse (z-Score) = (Net Flow 7d Avg - mu) / sigma
where:
  mu = historical mean of Net Flow 7d Avg
  sigma = historical standard deviation of Net Flow 7d Avg
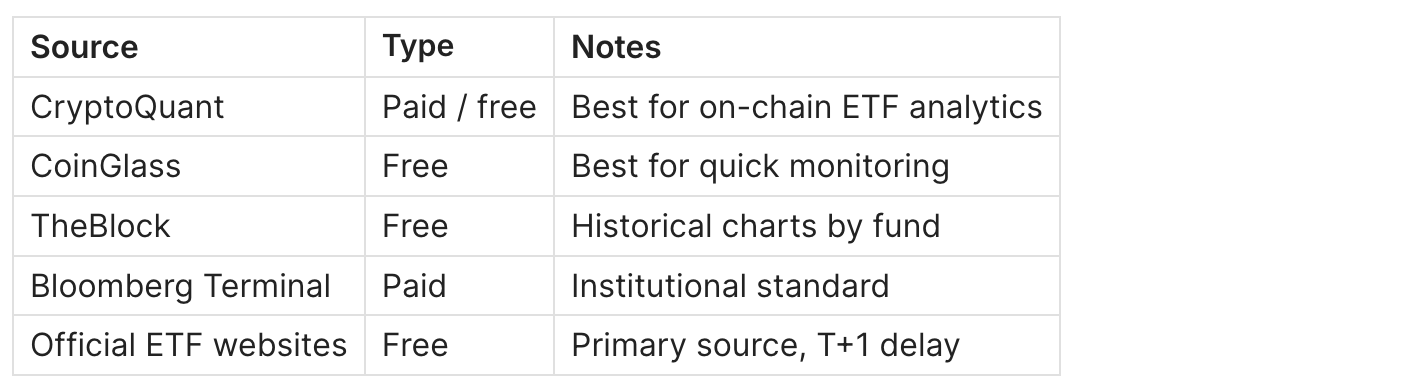
Data Sources
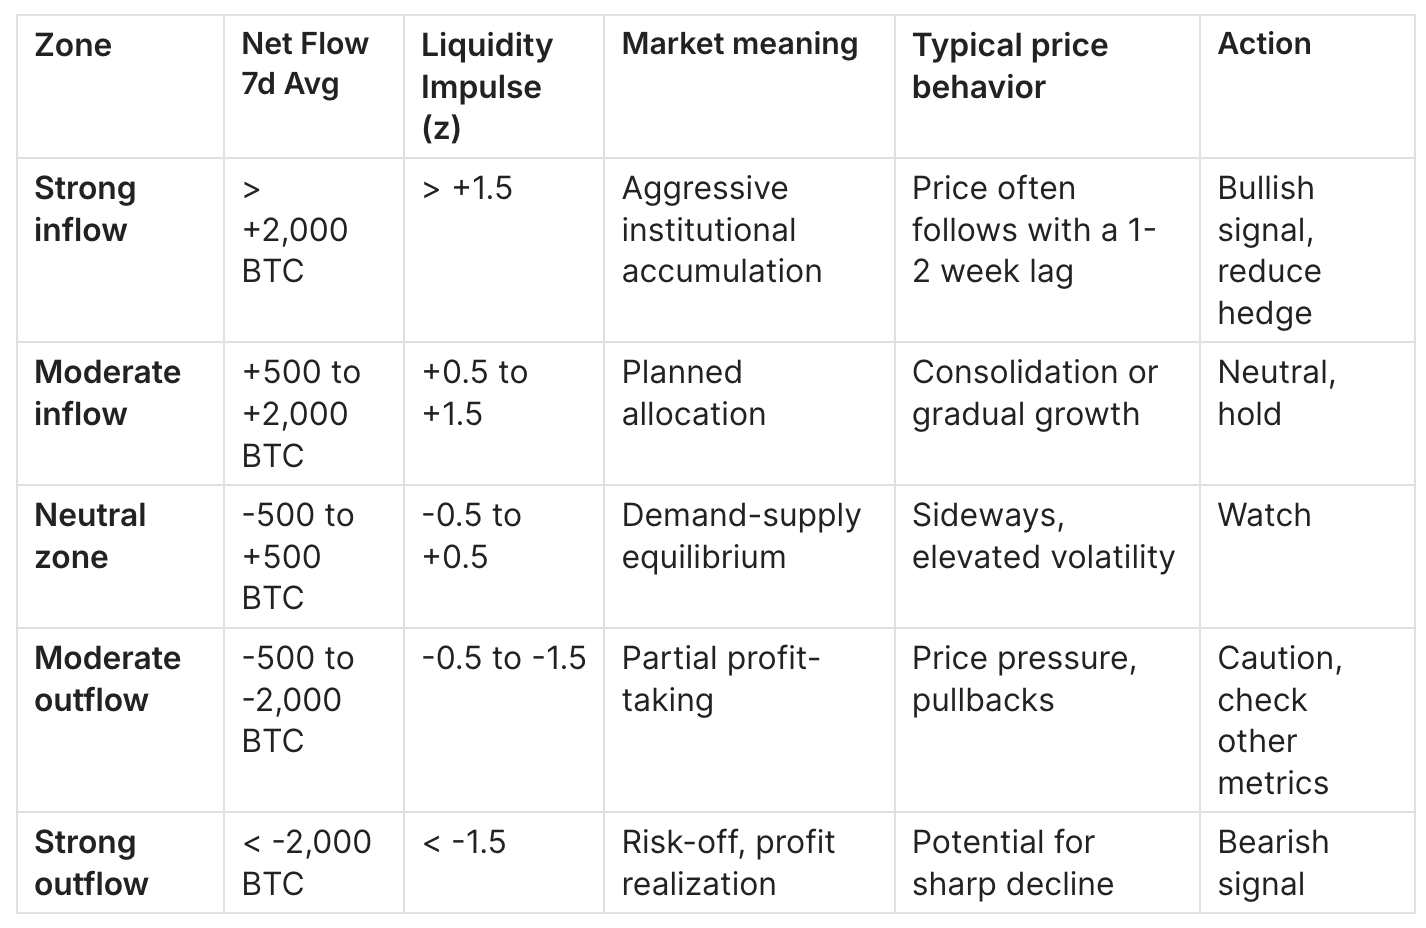
ETF Flow Interpretation Zones
Detailed Interpretation
ETF Net Flow 7d Avg > +2,000 BTC (Liquidity Impulse > +1.5)
An abnormally high inflow means large regulated capital is actively opening positions. Historically, such periods have preceded price acceleration on a 2-4 week horizon. However, in a distribution phase (price near historical highs), high inflows can be neutralized by long-term holder selling - it is important to also look at SOPR and Exchange Netflow simultaneously.
ETF Net Flow 7d Avg < -2,000 BTC (Liquidity Impulse < -1.5)
Sustained outflow for 5 or more consecutive days is a significant bearish signal. A single day of outflow after a streak of inflows is noise, not a reversal. The classic mistake: treating a one-day outflow as a trend change. The real signal is not one day, but a pattern.
Liquidity Impulse = 0 (equilibrium)
A neutral state. Price is determined by other forces - derivatives, on-chain sentiment, macro factors. The amplified role of ETF flow begins when the z-Score moves beyond +-0.5.
Historical Examples
Example 1: ETF Launch (January 2024)
- Situation: SEC approval on January 10, 2024; within the first few days total holdings exceeded 629K BTC
- Indicator behavior: Net Flow 7d Avg reached record peaks, Liquidity Impulse moved above +3.0
- Price behavior: BTC rose from ~$40K to ~$72K in 2 months
- Conclusion: initial demand was inelastic - market supply could not keep up with institutional appetite
Example 2: May 2024 Correction
- Situation: Grayscale (GBTC) selling pressured the market
- Indicator behavior: Net Flow 7d Avg turned negative (down to -3,000+ BTC), Liquidity Impulse below -1.5
- Price behavior: correction from ~$72K to ~$57K
- Conclusion: outflows from one large fund (GBTC) could outweigh inflows from the rest - it is important to look at the flow structure by fund
Example 3: October 2025 Peak
- Situation: ETF holdings reached a historical maximum of ~1.37 million BTC
- Indicator behavior: Liquidity Impulse signaled saturation - flows stabilized
- Price behavior: Bitcoin traded near $124K, then declined
- Conclusion: slowing inflows at peak historical holdings - an early overheating signal
Example 4: March 2026 (current period)
- Situation: ETF holdings ~1.28 million BTC; Net Flow 7d Avg around -215 BTC/day; Liquidity Impulse around -0.01
- Indicator behavior: practically neutral zone - neither strong inflow nor strong outflow
- Price behavior: consolidation in the $66K-$72K range
- Conclusion: the ETF market is in wait-and-see mode; the next impulse will determine direction
2. Coinbase Premium Index
What Is the Coinbase Premium Index?
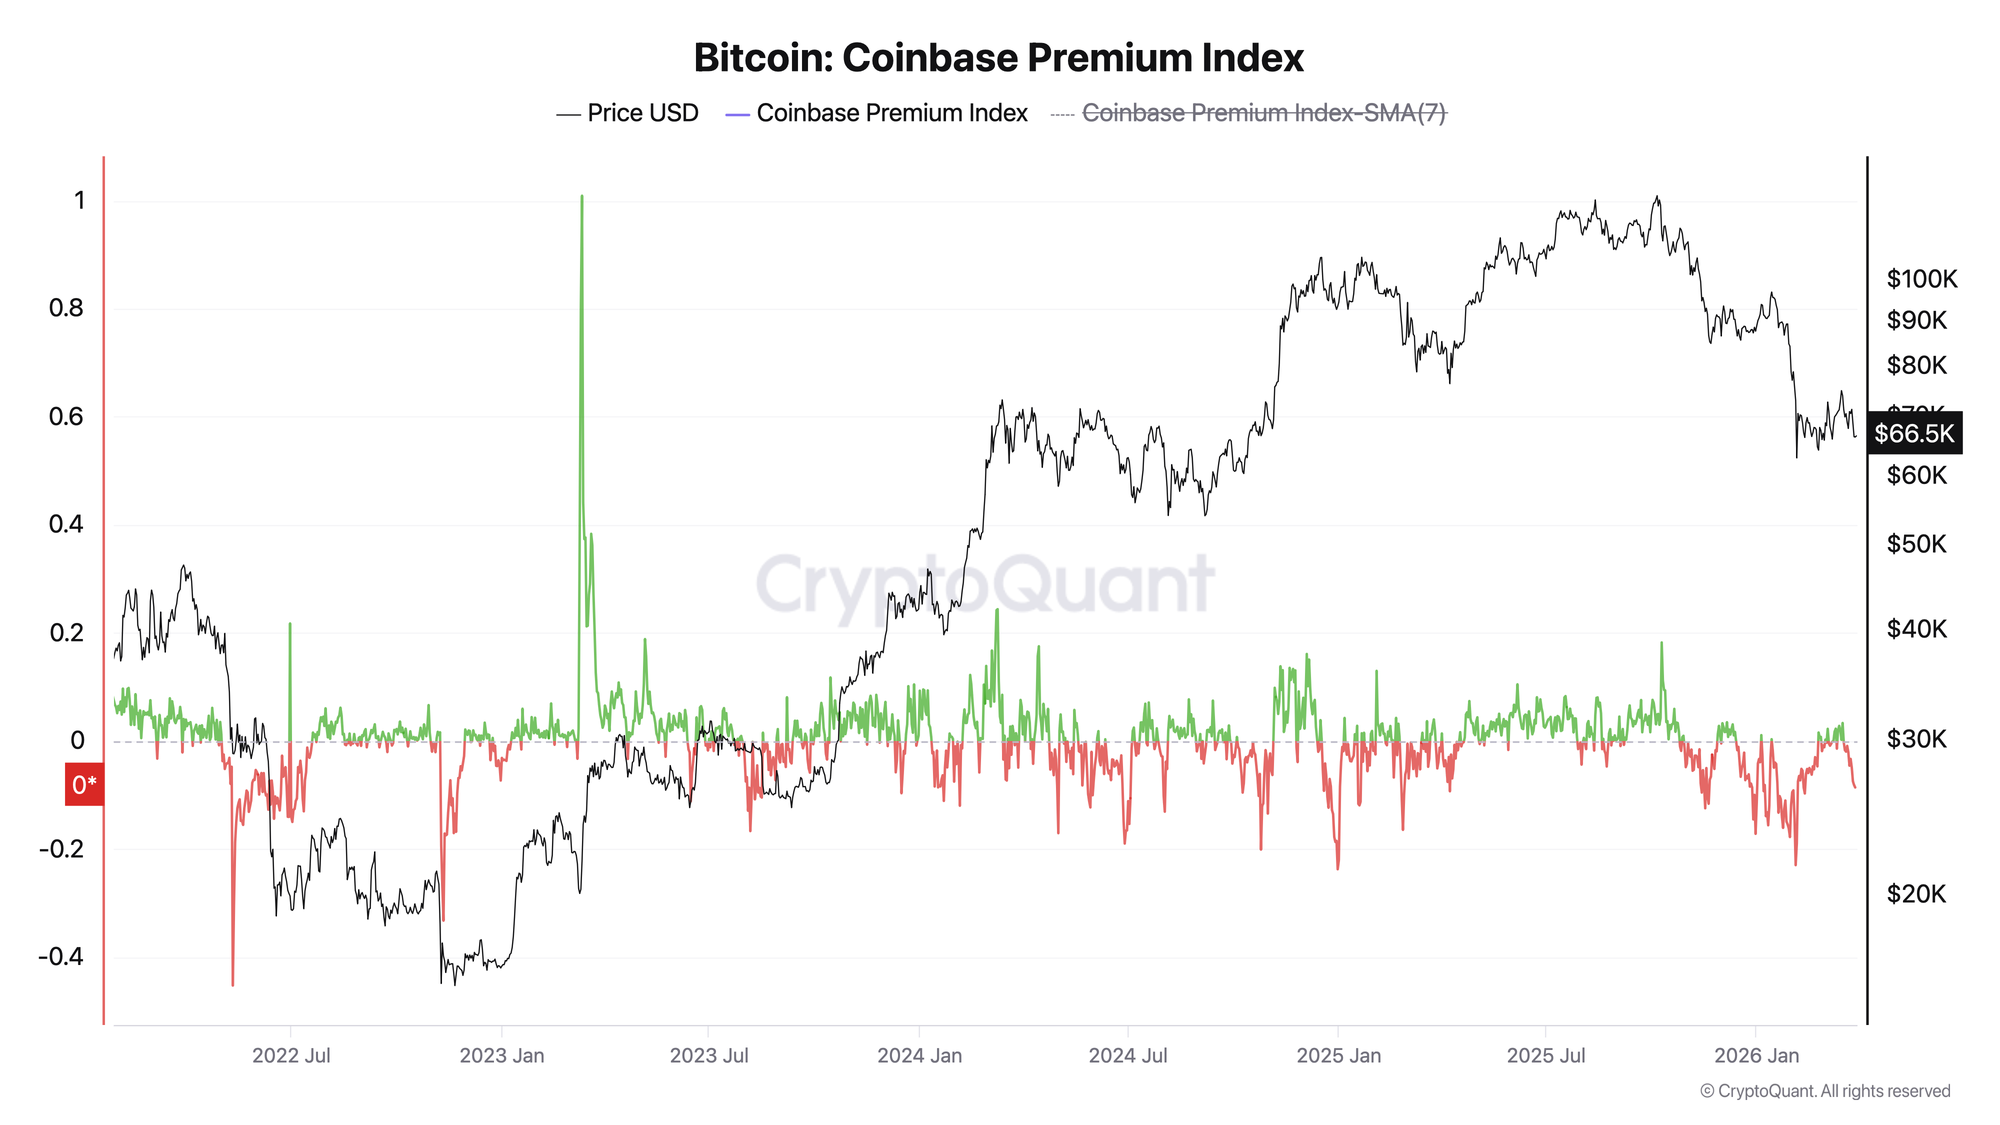
The Coinbase Premium Index is the percentage difference between the price of Bitcoin on Coinbase Pro (BTC/USD) and the price on Binance (BTC/USDT). Coinbase is the primary entry gateway for US institutional investors: ETF custodian, venue for hedge funds, corporate treasuries, and large funds.
When US institutions buy aggressively, demand on Coinbase temporarily exceeds supply - the price there becomes higher than on the global Binance market. This divergence is what the indicator captures.
Formula
Coinbase Premium Index = (BTC price on Coinbase Pro) / (BTC price on Binance) - 1

or as a percentage:
CPI (%) = ((P_Coinbase - P_Binance) / P_Binance) x 100

Where:
  P_Coinbase = BTC/USD spot price on Coinbase Pro
  P_Binance  = BTC/USDT spot price on Binance (as a USD proxy)
A 7-day moving average (SMA-7) is often used to smooth out arbitrage noise.
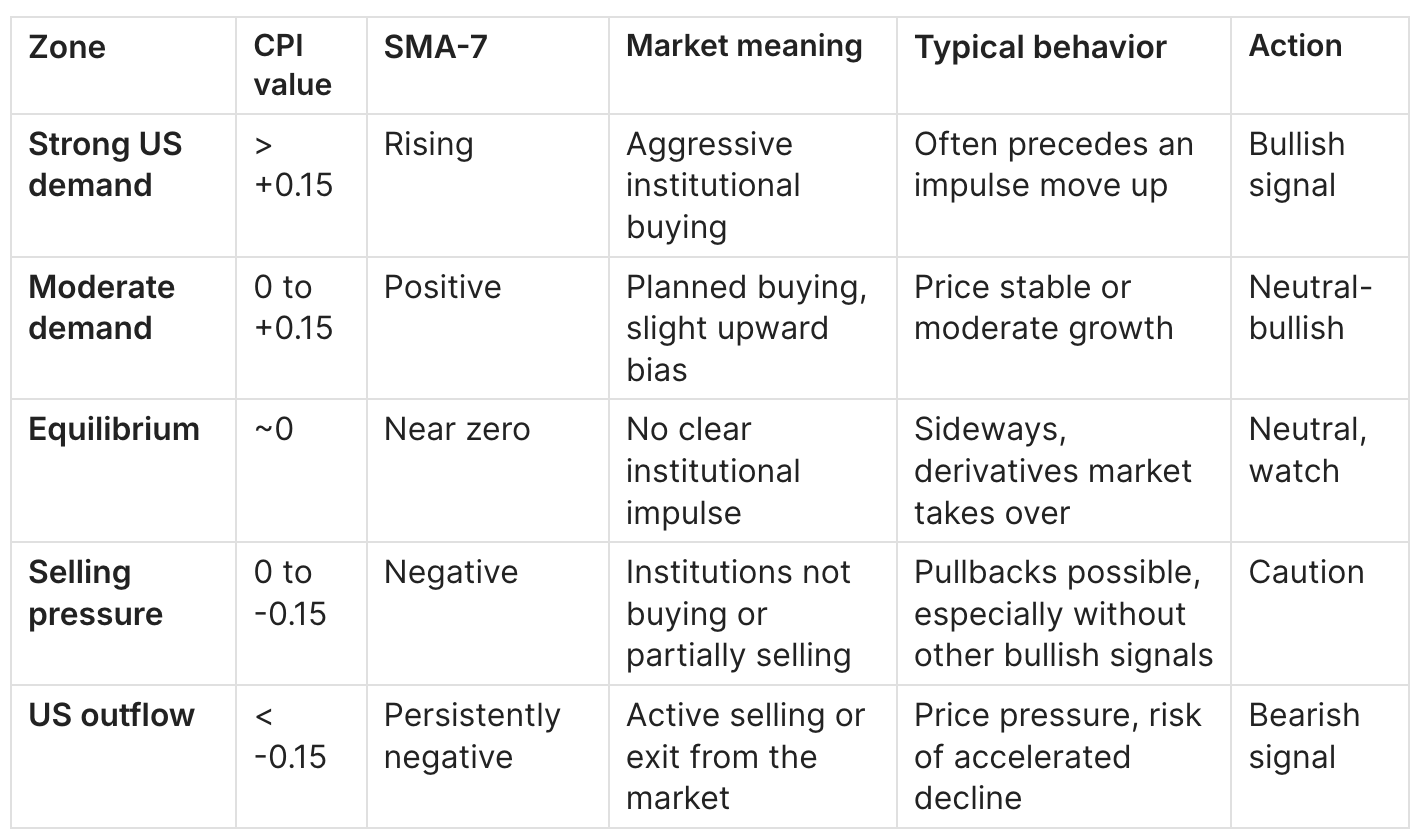
Coinbase Premium Interpretation Zones
Key Levels
CPI = 0 (neutral): the equilibrium point. A cross from below zero upward is a potential early buy signal. A cross from above zero downward is a caution signal.
CPI > +0.3: extreme demand, often accompanies panic FOMO buying by institutions. Sustained levels above this do not last long.
CPI < -0.3: extreme selling. Historically coincided with crisis periods (LUNA/Terra, FTX, USDC panic 2023).
Historical Examples
Example 1: USDC Panic, March 2023
- Situation: temporary USDC depeg, risk of a run on Coinbase
- Indicator behavior: CPI reached a record value of +1.009 - the historical maximum over the entire observation period
- Price behavior: rapid BTC growth amid a flight to "digital gold"
- Conclusion: an extreme CPI peak = an extreme situation, not a typical entry point
Example 2: Bear Market, May 2022 (LUNA)
- Situation: Terra/LUNA collapse, mass institutional selling
- Indicator behavior: CPI fell to -0.452 - the historical minimum
- Price behavior: BTC crashed from ~$39K to ~$29K in a matter of days
- Conclusion: extremely negative CPI = US institutions panic-selling their positions
Example 3: Rally After ETF Approval (January-February 2024)
- Situation: spot ETF approval
- Indicator behavior: CPI persistently positive, SMA-7 held above zero for several weeks
- Price behavior: growth from ~$40K to ~$55K
- Conclusion: sustained positive CPI + ETF inflows = confirmed institutional bullish trend
Example 4: March 2026 (current period)
- Situation: market consolidation around $66K-$72K
- Indicator behavior: CPI around -0.086 - slightly negative; SMA-7 below zero
- Price behavior: sideways with local dips
- Conclusion: US institutions in passive mode; no signs of aggressive demand
3. Miner OTC Balance
What Is OTC Balance (OTC From Miner)?
OTC desks (Over-The-Counter desks) are intermediaries that allow large buyers to acquire Bitcoin without entering the exchange order book. Miners traditionally use OTC to sell mined coins, as it allows them to avoid market impact. Institutional buyers (hedge funds, corporations, sovereign funds) use them for discreet accumulation.
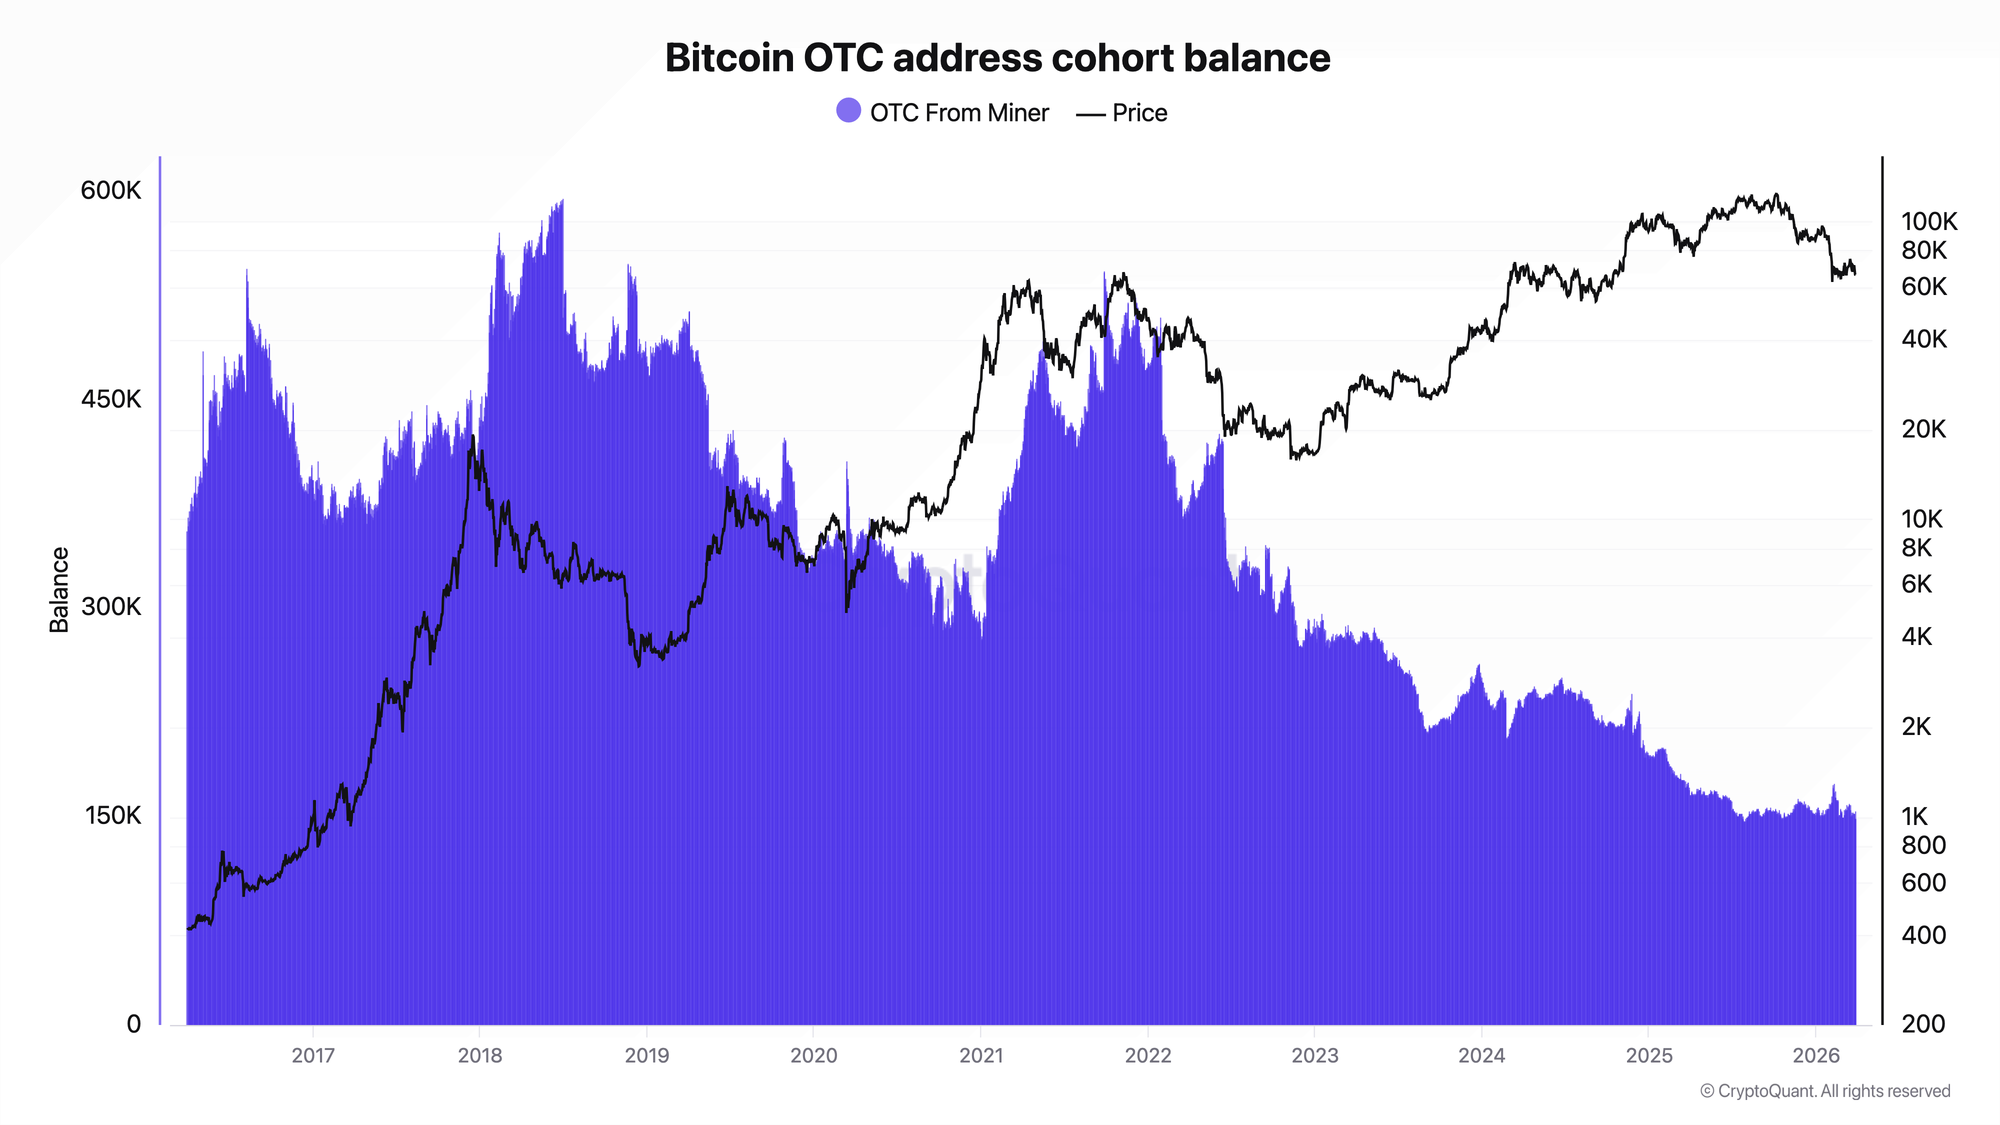
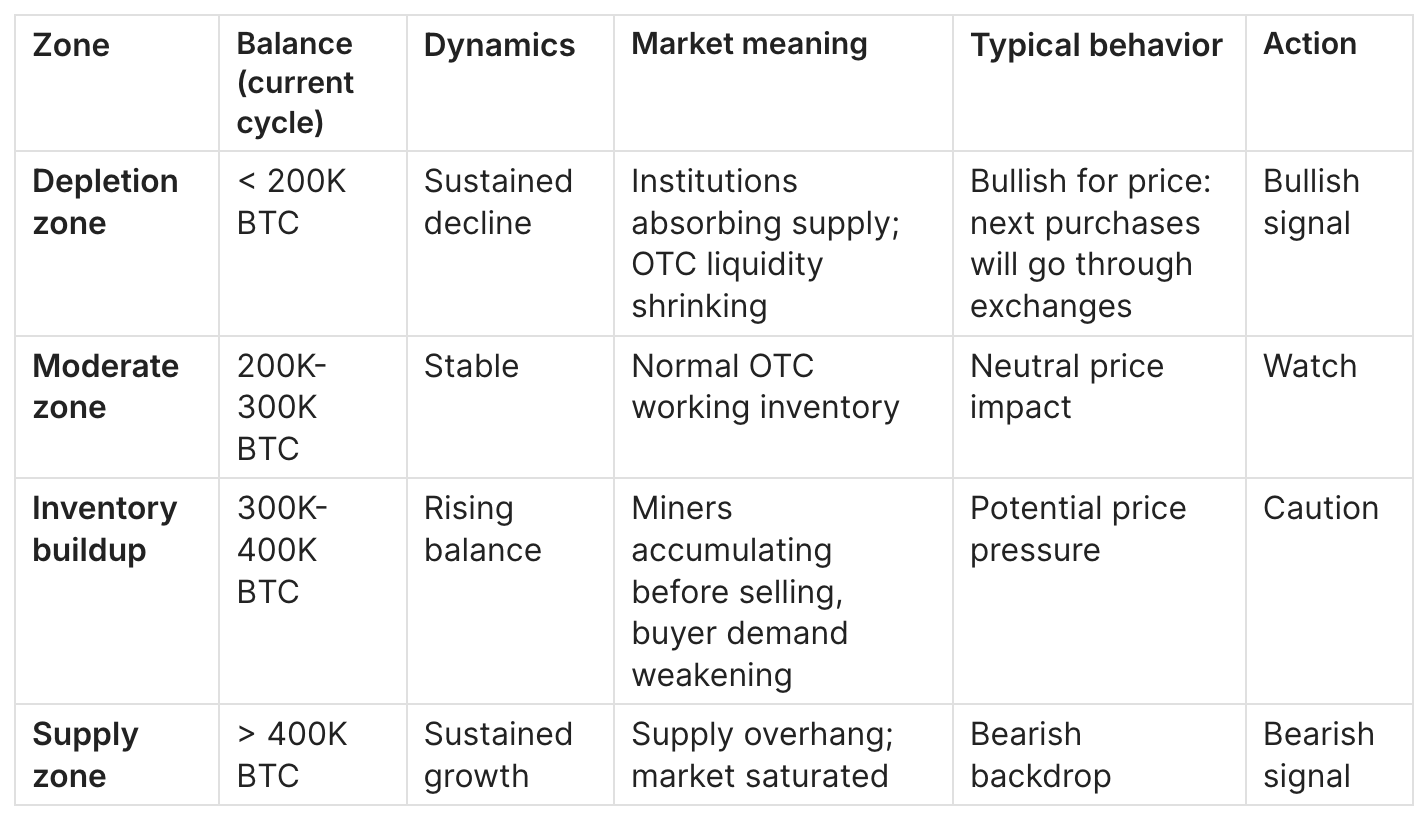
The OTC From Miner metric tracks the Bitcoin balance in wallets identified as miner OTC addresses. A declining balance = coins are moving to buyers (accumulation). A rising balance = miners are accumulating before selling, or the market is experiencing a shortage of buyers.
Calculation
OTC Miner Balance = Sum of BTC on identified miner OTC addresses

Balance change = OTC Miner Balance (N) - OTC Miner Balance (N-1)
  < 0 -> coin outflow from OTC (absorbed by buyers)
  > 0 -> coin inflow to OTC (miners preparing to sell)
Important: not all OTC addresses are identified. The metric is a directional indicator, not an absolute measure.
Historical Context
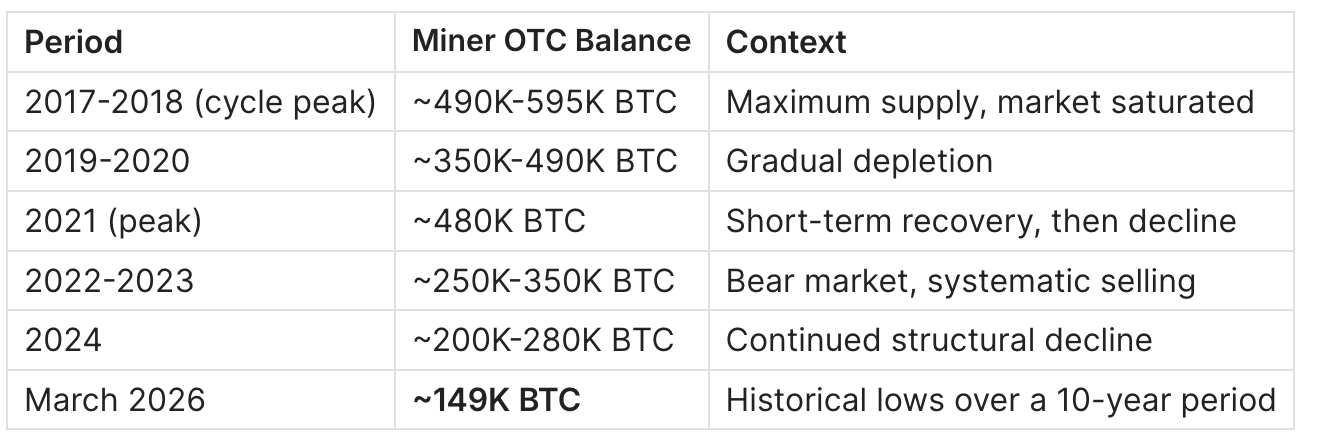
Decline from peak ~595K BTC to ~149K BTC - a 75% drop over ~8 years.
OTC Balance Interpretation Zones
Why Is a Declining OTC Balance Structurally Important?
When OTC inventory runs out, large buyers have only one option left: buy through the exchange order book. This means:
- Large orders become visible to the market -> increased transparency of institutional demand
- Pressure on exchange supply increases -> potential shortage
- Slippage increases -> institutions pay more for each BTC
This is why a declining OTC balance is a long-term structural bullish signal, even though it is not a short-term trigger.
Historical Examples
Example 1: 2018-2019 - Supply Formation
- Situation: bear market, price fell from $20K to $3.2K
- Indicator behavior: OTC balance rose to ~590K BTC - a historical maximum
- Price behavior: sustained pressure while miners and early investors sold through OTC
- Conclusion: high OTC balance = high supply -> bearish backdrop
Example 2: 2020-2021 - OTC Supply Absorption
- Situation: MicroStrategy, Tesla, and other corporations bought through OTC
- Indicator behavior: balance declined from ~480K to ~350K BTC in one year
- Price behavior: growth from $10K to $65K
- Conclusion: corporate accumulation through OTC = hidden bullish demand
Example 3: 2022-2023 - Absence of Absorption
- Situation: Terra/LUNA collapse, FTX; institutions left the market
- Indicator behavior: balance declined slowly - no new large buyers
- Price behavior: BTC traded in the $16K-$30K range
- Conclusion: declining balance without accompanying ETF inflows and positive CPI - a weak signal
Example 4: 2024-2026 - Structural Depletion
- Situation: ETF demand + corporate purchases (Strategy, Japanese companies) + sovereign reserves
- Indicator behavior: balance declined from ~250K (early 2024) to ~149K BTC (March 2026)
- Price behavior: BTC traded in the $60K-$124K range
- Conclusion: the fastest period of OTC supply absorption in history; even during a correction (-44% from ATH) the balance continues to decline - a sign of structural, not speculative, accumulation
4. The Three-Indicator System
The true analytical value emerges only when all three metrics are viewed together. Each describes a different aspect of institutional flow:
+------------------------------------------------------------------+
|              INSTITUTIONAL BITCOIN FLOW                          |
+-----------------+------------------+----------------------------+
|  ETF FLOW       |  COINBASE        |  MINER OTC BALANCE         |
|                 |  PREMIUM         |                            |
+-----------------+------------------+----------------------------+
| Speed of        | Intent to buy    | Structural supply          |
| capital inflow  | NOW              | inventory                  |
|                 | (high-frequency) | (long-term)                |
+-----------------+------------------+----------------------------+
| Delay: T+1      | Delay: real-time | Delay: several             |
|                 |                  | hours / days               |
+------------------+-----------------+----------------------------+
Signal Matrix (Combined Analysis)
5. Practical Application: Playbook
Conditions for Accumulation / Risk Reduction on Exit
Accumulation signal:
- Net Flow 7d Avg > +1,000 BTC (Liquidity Impulse > +0.5) for 5+ consecutive trading days
- Coinbase Premium Index > 0, SMA-7 crosses zero from below
- OTC balance continues to decline (moves below the previous local minimum)
Confirmations: SOPR < 1.0 (STH at a loss = weak hands capitulating), Exchange Netflow negative (coins leaving exchanges), MVRV < 1.5
Traps: do not confuse the start of a new accumulation phase with a "dead cat bounce" - look at the duration of the signal, not a one-off spike
Risk-off / caution signal:
- Net Flow 7d Avg < -1,000 BTC for 5+ consecutive days
- Coinbase Premium persistently negative (SMA-7 < -0.05)
- OTC balance has stabilized or started rising (reduced buyer pressure)
Confirmations: SOPR > 1.3 (profit realization accelerating), Exchange Netflow positive (coins moving to exchanges), MVRV > 3.5
Traps: moderate ETF outflow after a long streak of inflows = a normal correction, not a trend reversal
Neutral mode / wait:
- Net Flow 7d Avg between -500 and +500 BTC
- Coinbase Premium near zero (between -0.05 and +0.05)
- OTC balance with no clear trend
Action: wait for a breakout from the range; increase monitoring of derivatives data (OI, Funding Rate) for short-term trading
6. Comparison with Other Metrics
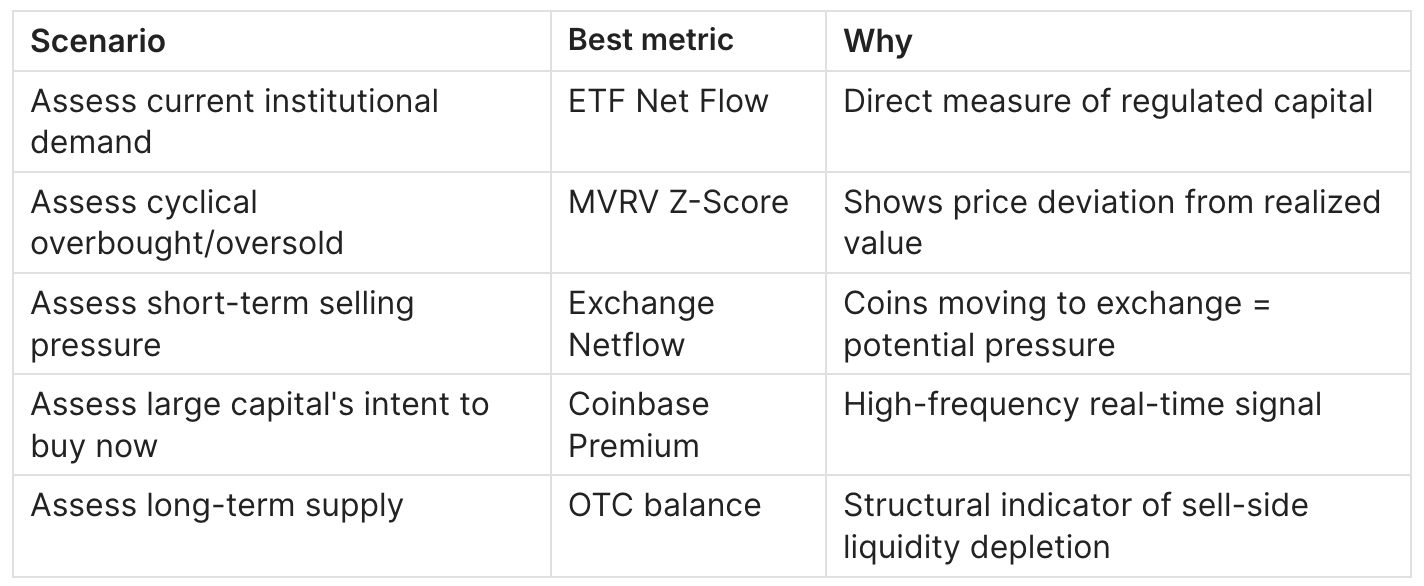
ETF Flow vs MVRV vs Exchange Netflow
Mathematical Relationships
Structural price pressure =
  f(ETF Net Flow, OTC Outflows, Exchange Netflow)

where all three are components of aggregate demand on supply
that is historically capped at ~21 million BTC.

Coinbase Premium ~ leading indicator for ETF Net Flow (leads by 1-3 days),
since ETF data is published with a T+1 delay, while CPI is available in real time.
7. Limitations
Limitation 1: ETF data with T+1 delay
Problem: you are always looking at yesterday's institutional behavior, not today's. Solution: use Coinbase Premium as a leading indicator - it is available in real time and leads ETF data publication by 1-3 days.
Limitation 2: Incomplete OTC data
Problem: not all OTC addresses are identified. The real balance is higher than observed. Solution: use as a directional metric (trend), not an absolute indicator. Cross-reference with Glassnode data for verification.
Limitation 3: Arbitrage noise in Coinbase Premium
Problem: short-term CPI spikes may be caused by arbitrage bots, not real institutional demand. Solution: use SMA-7 instead of the daily value. The signal is meaningful if SMA-7 stays persistently above/below zero for three or more consecutive days.
Limitation 4: ETF flow does not directly cause price movement
Problem: high ETF inflows do not guarantee price growth - sellers in the market can neutralize demand (classic distribution by LTH during the euphoria phase). Solution: always accompany ETF flow analysis with supply data (SOPR, LTH-NUPL, Exchange Reserve).
Limitation 5: New metric (ETF)
Problem: spot ETF history only goes back to January 2024. There is minimal historical pattern data for a full backtest. Solution: rely on Bitcoin Trust (GBTC) data as a proxy for earlier periods.
FAQ
What are Bitcoin ETF flows?
ETF flows are the net change in total Bitcoin holdings under management by all US spot ETFs for a given trading day. A positive flow means funds bought more BTC than they sold; a negative flow means the opposite. Data is published with a T+1 delay on each ETF's official website and aggregated by providers such as CryptoQuant and CoinGlass.
Where can I find Bitcoin ETF flow data?
The main sources are CoinGlass (free, updated daily), CryptoQuant (detailed analytics, partially free), TheBlock (historical charts by fund), and the official websites of BlackRock (IBIT), Fidelity (FBTC), and Grayscale (GBTC).
What is the Coinbase Premium Index?
The Coinbase Premium Index is the percentage difference between the BTC price on Coinbase Pro (US) and Binance (global market). A positive value means US institutions are buying more aggressively than the global market. A negative value means the opposite. It is used as a real-time leading indicator of institutional demand before ETF flow data is published.
Why is the miner OTC balance declining?
Three reasons: (1) institutional buyers - ETF custodians and corporate treasuries - are absorbing supply faster than it is replenished; (2) miners after the halving are producing half as many coins; (3) some miners have shifted from OTC to direct exchange sales. The balance has declined from a peak of ~595K BTC (2018) to ~149K BTC as of March 2026 - a 75% structural drop.
Which of the three indicators is most reliable?
Each is reliable in its own context. Coinbase Premium is the most timely - it updates in real time. ETF Net Flow is the most transparent - it is based on public fund disclosures. Miner OTC balance is the most structural - it reflects long-term supply depletion. Combining all three significantly increases signal reliability.
Can these metrics produce false signals?
Yes. One-off anomalies - such as a single-day CPI spike during the March 2023 USDC panic or a one-day large ETF outflow - are not trading signals. Reliable signals require sustained trends lasting 3-5 or more consecutive days. Always cross-check against other on-chain metrics such as SOPR, MVRV, and Exchange Netflow.
What will happen when the OTC balance reaches zero?
Institutional purchases will move entirely onto the exchange order book. This will increase the market impact of large trades, raise volatility, and make institutional demand more visible in real time. Analysts view depleted OTC inventory as a potential catalyst for the next structural price rise, since large buyers will have no way to accumulate discreetly.
Does this framework apply to other crypto assets?
Partially. Coinbase Premium is similarly calculated for ETH. ETF flow data is available for Ethereum ETFs launched in 2024. Miner OTC balance in this specific format is only available for Bitcoin through CryptoQuant.
How often should I monitor these metrics?
ETF flows: daily after US market close (T+1 publication). Coinbase Premium: in real time for short-term trading; checking the SMA-7 once per day is sufficient for strategic analysis. Miner OTC balance: weekly monitoring is enough to understand the structural picture.
Conclusion
Institutional Bitcoin flows are not a single indicator, but a system. ETF flow measures the speed and scale of regulated capital. Coinbase Premium reflects the intent of US institutions in real time. Miner OTC balance describes the long-term depletion of selling liquidity.
Key takeaways:
- As of March 2026, ETF holdings exceed 1.28 million BTC - a new structural demand class that did not exist in previous cycles
- Miner OTC balance has declined by 75% from its historical peak, signaling long-term supply absorption
- Coinbase Premium in a slightly negative zone (-0.086) with neutral ETF flows - the market is waiting for the next catalyst
- Triple confirmation (strong ETF inflow + positive CPI + declining OTC) is the most reliable bullish signal available
- None of the metrics works in isolation; combine with SOPR, Exchange Netflow, and MVRV for a complete picture
Related Guides
Essential Reading
- Bitcoin Exchange Netflow: What It Is and How to Use It - mirror of OTC absorption; confirms the ETF signal
- Bitcoin Exchange Reserve: Definition, Formula & Cycle Signals - total sell-side liquidity inventory on exchanges
- Bitcoin STH SOPR: What It Is and How to Use It - weak-hands filter; confirmation of the ETF accumulation signal
- Bitcoin MVRV Ratio: Definition, Formula & Cycle Signals - cycle assessment: context for interpreting inflows
- Bitcoin NUPL: What It Is and How to Use It - aggregate market profit/loss against the backdrop of institutional behavior
Further Analysis
- Bitcoin Puell Multiple: Definition, Formula & Miner Signals - miner selling pressure; precedes changes in OTC balance
- Bitcoin Miner Reserve & Outflow: Tracking Selling Pressure - direct precursor to OTC From Miner dynamics
- Bitcoin Hash Ribbons: Capitulation Signals & Buy Triggers - miner capitulation as a trigger for changes in OTC flows
- Bitcoin Stablecoin Supply Ratio (SSR) - stablecoin liquidity purchasing power relative to BTC
- Spot ETFs and Global M2: Thresholds for Overriding the Bitcoin Halving Cycle - when macro liquidity amplifies or neutralizes the ETF signal
- Bitcoin LTH vs STH: Supply Dynamics, Cost Basis & Market Structure - who is selling to institutions against the backdrop of ETF inflows
This material is intended for educational purposes only and does not constitute investment advice. Bitcoin and crypto assets are high-risk instruments; always conduct your own analysis before making investment decisions.