


Bitcoin Exchange Reserve measures how much BTC is currently held on tracked exchange addresses. It is one of the cleanest supply-side indicators in on-chain analysis because it helps estimate how much Bitcoin is sitting inside venues where coins can be sold, reallocated, or used as liquid collateral.
For market participants, this metric solves a simple but important problem: price can move fast, but reserve helps reveal whether exchange-side supply is expanding or shrinking underneath the move. That makes it useful as a structural filter for trend strength, distribution risk, and scarcity regimes.
Last updated: June 15, 2026
Current Bitcoin Exchange Reserve
| Exchange Reserve | 2.710M BTC |
| 7-Day Change | -0.3% (from 2.717M BTC) |
| 30-Day Average | 2.706M BTC |
| Signal | ⚖️ Neutral range — reserve declining = exchange supply tightening |
Updated June 15, 2026 · Want daily on-chain signals? Join Adler AM
TL;DR
- What it measures: the total amount of BTC held on tracked exchange wallets
- Core idea: rising reserve usually means more coins are available for sale, falling reserve usually means supply is leaving exchanges
- Best use case: identify whether market structure is moving toward distribution or scarcity
- Main limitation: reserve is only as good as the exchange address labeling behind it
- Best combined with: Exchange Netflow, SOPR, MVRV, and Stablecoin Exchange Inflow
Table of Contents
- What Is Bitcoin Exchange Reserve?
- Formula
- Data Sources
- How Bitcoin Exchange Reserve Is Calculated
- How to Interpret Bitcoin Exchange Reserve Values
- Historical Cycle Examples
- Practical Application
- Bitcoin Exchange Reserve vs Netflow vs Proof of Reserves
- How Exchange Reserve Relates to Other Indicators
- Bitcoin Exchange Reserve Limitations
- FAQ
- Conclusion
What Is Bitcoin Exchange Reserve?
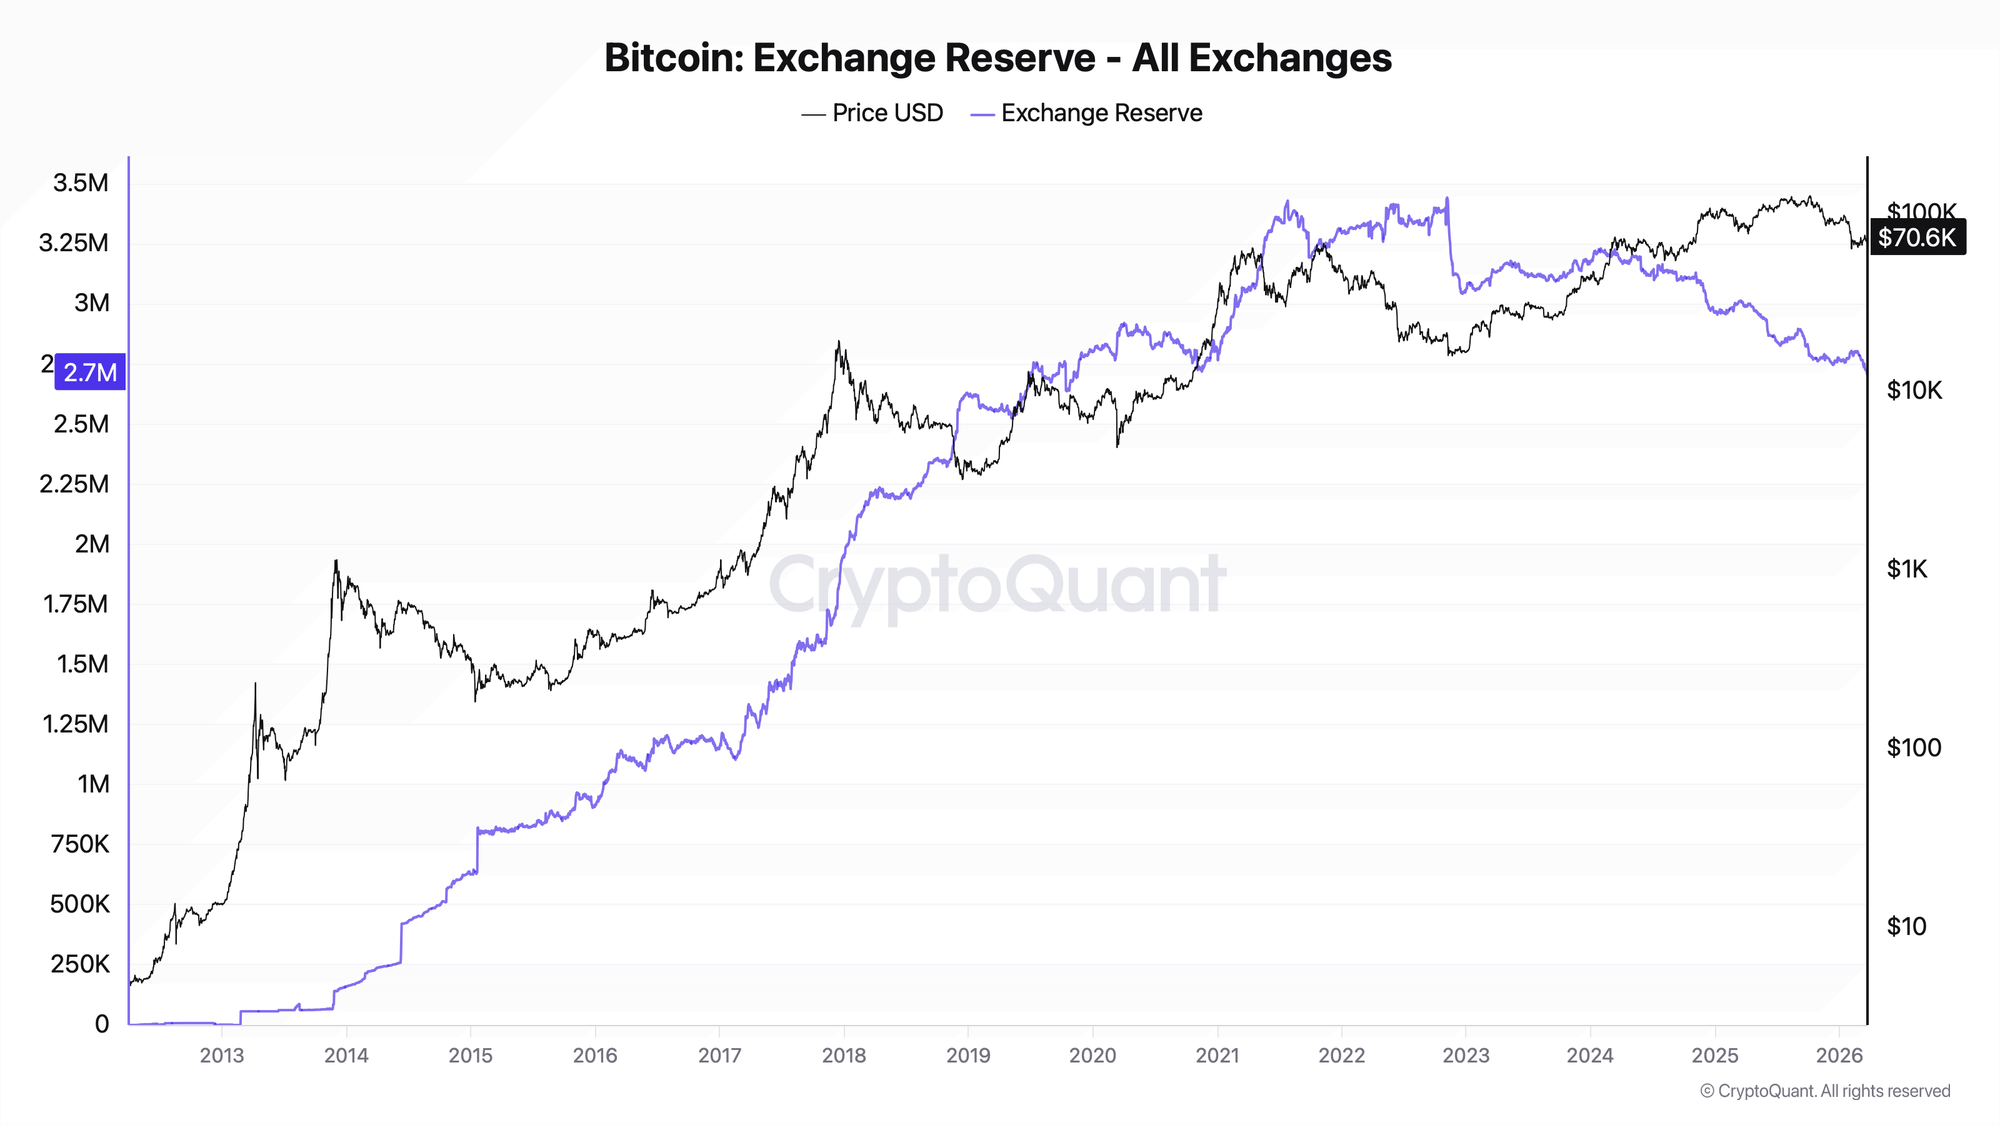
Bitcoin Exchange Reserve is the total amount of BTC held on addresses identified as belonging to centralized exchanges.
In plain English, it tracks how much Bitcoin is sitting inside the market’s most liquid trading venues. That matters because exchanges are where coins are easiest to sell, rotate, hedge, or post as collateral.
A rising reserve usually means more BTC is moving onto exchanges or staying there longer. A falling reserve usually means BTC is being withdrawn from exchange custody, reducing immediately available liquid supply.
In one line: Bitcoin Exchange Reserve is a supply-side metric that tracks how much BTC is currently available inside exchange-controlled wallets.
Formula
Bitcoin Exchange Reserve(t) = Σ BTC balance of all tracked exchange addresses at time t
Where:
- t = the observation date or timestamp
- tracked exchange addresses = wallets labeled as belonging to exchanges
- BTC balance = the on-chain balance held on each of those addresses
A useful derivative:
Change in Reserve = Exchange Reserve(t) - Exchange Reserve(t-1)
And for relative analysis:
Reserve Change % = [Exchange Reserve(t) / Exchange Reserve(t-n) - 1] × 100
Data Sources
- CryptoQuant - best for charting and exchange flow context. CryptoQuant defines Exchange Reserve as the total amount of coins held in exchange addresses and interprets rising reserves as higher selling pressure, while falling reserves point to lower selling pressure. (CryptoQuant User Guide)
- Glassnode - best for methodology awareness. Glassnode’s documentation is especially useful for understanding how exchange balances depend on address identification and why these metrics can behave like lower-bound estimates. (docs.glassnode.com)
How Bitcoin Exchange Reserve Is Calculated
Step 1: Identify exchange-controlled addresses
The provider first labels wallets that belong to centralized exchanges. This is the hardest part of the process, because the metric depends on high-quality address tagging and clustering. Glassnode notes that exchange data quality depends on verified addresses, external tags, and clustering algorithms, and that the reported balances can be closer to lower bounds than exact totals.
Step 2: Sum all BTC balances across those addresses
Once the exchange wallet cluster is defined, the BTC balances of all tracked exchange addresses are aggregated for a given day or timestamp.
Step 3: Build a time series
The total is repeated every day to create a historical chart. The series can then be analyzed in levels, trends, percent changes, or compared to price.
Mini example
Suppose the tracked exchange balances are:
- Exchange A: 820,000 BTC
- Exchange B: 640,000 BTC
- Exchange C: 510,000 BTC
- Exchange D: 235,000 BTC
Then:
Exchange Reserve = 820,000 + 640,000 + 510,000 + 235,000
Exchange Reserve = 2,205,000 BTC
If next week the same aggregate falls to 2,150,000 BTC, then:
Reserve Change = 2,150,000 - 2,205,000 = -55,000 BTC
That would indicate net withdrawal of liquid exchange-side supply.
Process visualization
Blockchain balances
      ↓
Exchange address labeling
      ↓
Aggregate all tracked exchange wallets
      ↓
Daily reserve series
      ↓
Trend analysis:
rising reserve = more liquid supply
falling reserve = tighter liquid supply
How to Interpret Bitcoin Exchange Reserve Values
Absolute values matter, but trend matters more.
A high reserve level means there is a large stock of BTC on exchanges. A falling reserve trend means that stock is shrinking. In practice, trend change is often more informative than the raw number because exchange behavior, custody structure, and market microstructure evolve over time.
Current dataset snapshot
Using the uploaded daily CSV for 2012-04-02 to 2026-03-23:
- Latest value: 2.705M BTC
- 30-day change: -98.2K BTC
- 1-year change: -302.1K BTC
- Cycle peak in this dataset: 3.443M BTC on 2022-11-06
- Current level vs that peak: -21.4%
These figures are calculated from your uploaded dataset.
Zone table
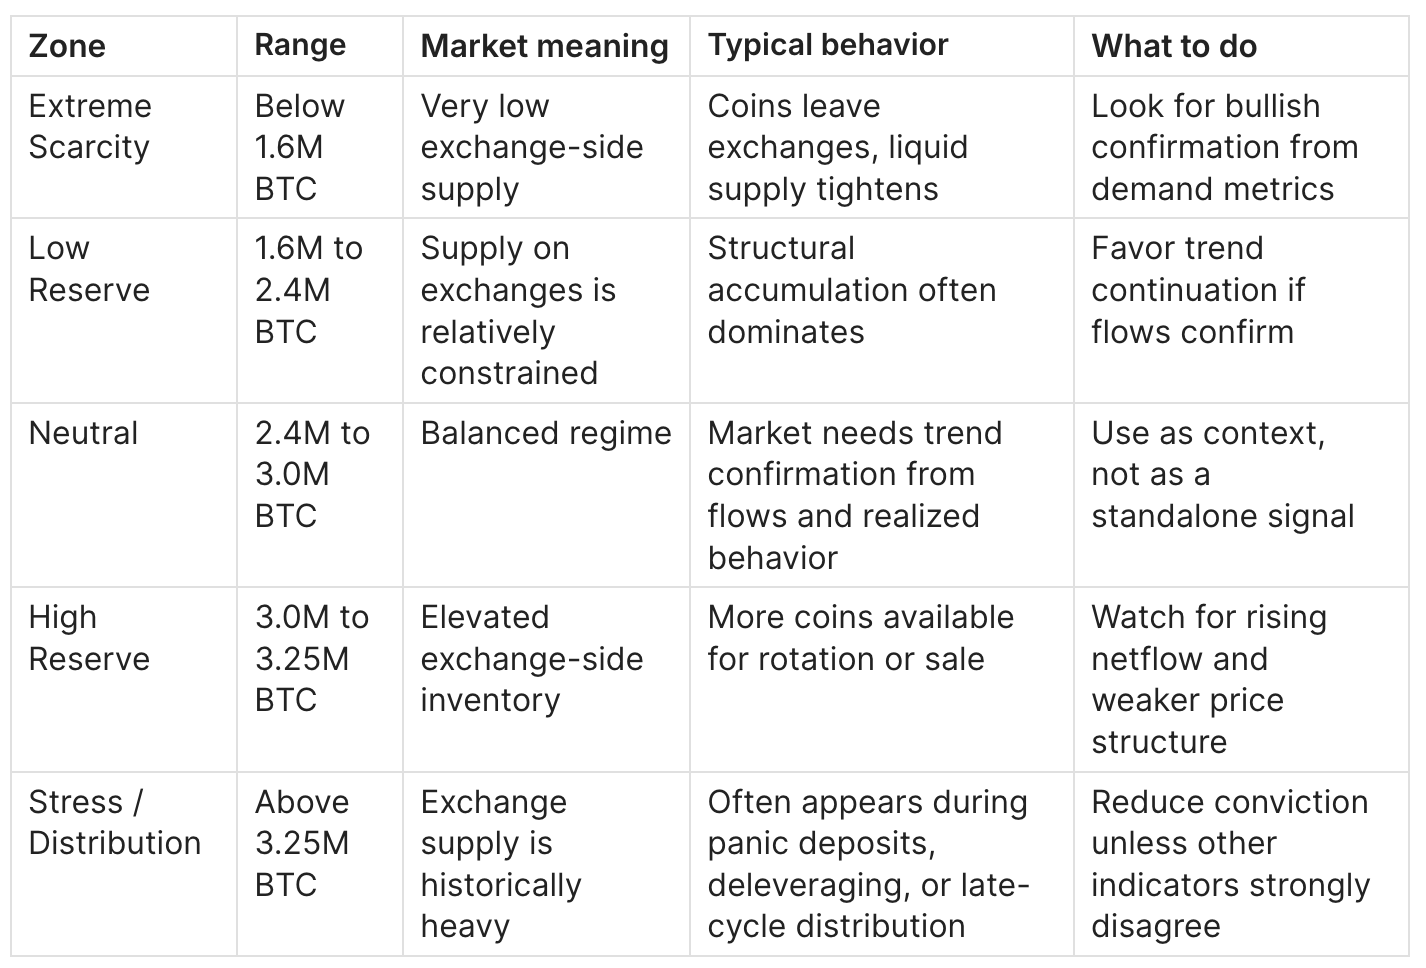
Bitcoin Exchange Reserve > 3.25M BTC
When reserve moves into the upper historical band, the market is carrying unusually large BTC inventory on exchanges.
What it often means:
- more liquid supply is available for sale
- traders or institutions may be rotating coins onto exchanges
- market structure is more vulnerable to distribution events
What you usually see:
- weaker scarcity narrative
- rallies that need stronger demand to keep pushing higher
- higher sensitivity to negative macro or flow shocks
Typical mistakes:
- treating high reserve as an immediate short signal
- ignoring whether netflows are still rising or already reversing
- ignoring ETF, stablecoin, and derivatives context
Bitcoin Exchange Reserve < 1.6M BTC
This is a scarcity-heavy regime.
What it often means:
- a relatively small amount of BTC remains on exchanges
- coins are being moved to cold storage, custodians, or long-term holding setups
- the market may become more responsive to fresh demand shocks
What you usually see:
- stronger reflexive rallies when new demand enters
- lower immediately available spot supply
- bullish narratives built around supply squeeze
Typical mistakes:
- assuming low reserve alone means price must rise immediately
- forgetting that weak demand can still overpower scarce supply in the short run
- ignoring whether the drop is broad-based or concentrated in a few venues
Key level: trend inflection
For Exchange Reserve, the real equilibrium is not a single number like 1.0 in SOPR.
The key level is the trend inflection:
- a persistent rising trend suggests liquid supply is rebuilding
- a persistent falling trend suggests liquid supply is tightening
That is why reserve works best as a regime filter, not a precise timing trigger.
Historical Cycle Examples
Example 1: 2017 bull market expansion
Situation: Bitcoin moved into a speculative blow-off phase.
Metric behavior: Exchange Reserve rose materially through the cycle and reached roughly 1.84M BTC around the December 2017 top in this dataset.
Price behavior: Price accelerated vertically into the final stage of the bull market.
Conclusion:
- rising reserve did not stop price from going higher
- but it showed that exchange-side inventory was building into a late-cycle environment
Example 2: 2018 bear market reset
Situation: After the 2017 peak, the market entered a broad bear cycle.
Metric behavior: Reserve continued to rebuild and was around 2.61M BTC by December 2018 in this dataset.
Price behavior: Price collapsed, then began a bottoming and reset process.
Conclusion:
- high reserve can persist during weak markets
- reserve is not a bottom signal by itself
Example 3: 2020-2021 bull phase
Situation: Bitcoin entered a major institutional and macro-driven bull market.
Metric behavior: Reserve remained elevated in absolute terms, reaching roughly 3.09M BTC in April 2021 and 3.25M BTC around the November 2021 peak.
Price behavior: Price made new all-time highs in two major legs.
Conclusion:
- price can rise even with high reserve when demand is strong enough
- reserve must be interpreted with demand-side indicators, not in isolation
Example 4: 2022 exchange stress to 2026 scarcity drift
Situation: Exchange system stress and post-crisis repricing changed custody behavior.
Metric behavior: Reserve reached the dataset high of 3.443M BTC on 2022-11-06, then declined to 2.705M BTC by 2026-03-23.
Price behavior: The market moved from crisis conditions into a later phase of tightening exchange supply.
Conclusion:
- extreme spikes in reserve can reflect panic deposits and trust shocks
- the long decline after the 2022 peak supports a scarcity-oriented structural backdrop
Practical Application
Buy / Accumulation conditions
- Signal: Exchange Reserve is falling on a sustained basis
- Confirmations: negative or declining Exchange Netflow, SOPR recovering above 1.0, stablecoin liquidity improving
- Invalidations / traps: price falling while reserve falls because demand is absent, or reserve decline driven by exchange-specific custody reshuffles
- Action guidance: treat it as a supportive backdrop for longs, not as a direct entry trigger
Risk-off / Distribution conditions
- Signal: Exchange Reserve is rising persistently, especially from already-high levels
- Confirmations: positive Netflow, weak SOPR, falling MVRV momentum, deteriorating ETF or stablecoin demand
- Invalidations / traps: one-off reserve spikes caused by internal reshuffling or panic events that reverse quickly
- Action guidance: use it as a warning that liquid supply is rebuilding and trend quality may worsen
Neutral / Wait conditions
- Signal: Reserve is range-bound and trendless
- Confirmations: mixed flows, mixed realized behavior, no clean demand impulse
- Invalidations / traps: overtrading a metric with no trend
- Action guidance: wait for confirmation from price, netflow, and demand-side indicators
Bitcoin Exchange Reserve vs Netflow vs Proof of Reserves
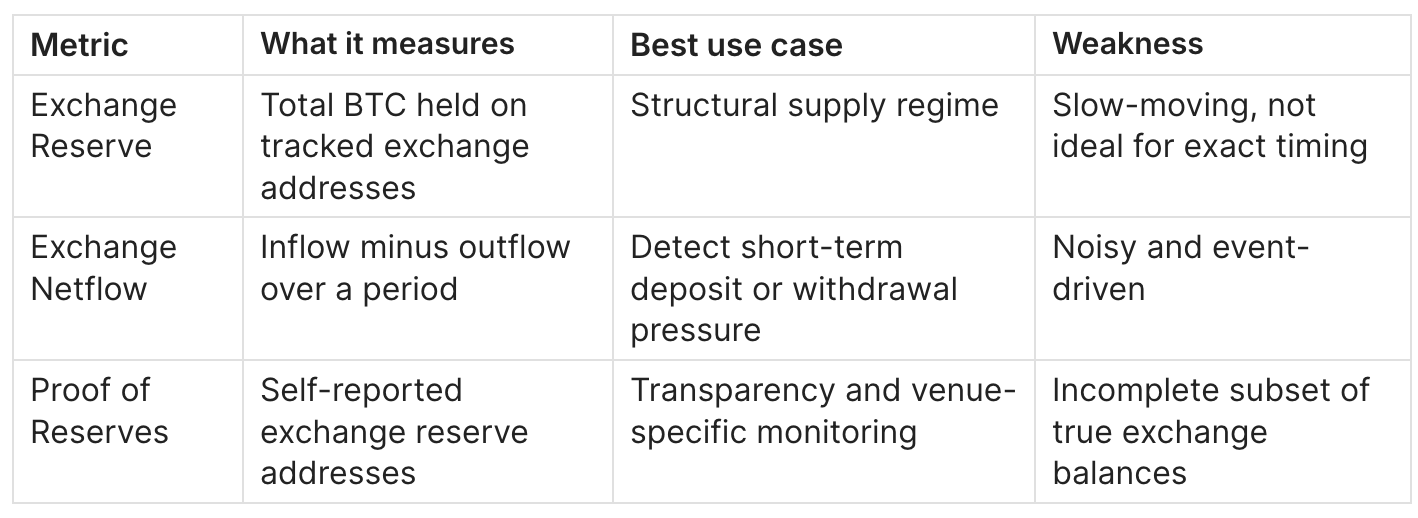
CryptoQuant explicitly frames Exchange Reserve as the aggregate stock of coins on exchanges, while Netflow is the flow process that changes that stock over time.
When to use which
- Use Exchange Reserve for structural supply context
- Use Netflow for short-term pressure detection
- Use Proof of Reserves when assessing transparency of specific exchanges, not broad market regime
Combined analysis recipes
Recipe 1 - Bullish scarcity setup
- Reserve falling
- Netflow negative
- SOPR above 1.0
- Stablecoin inflow improving
Recipe 2 - Distribution warning
- Reserve rising
- Netflow positive
- MVRV rich or rolling over
- Funding overheated
How Exchange Reserve Relates to Other Indicators
- Exchange Reserve + Netflow
Netflow is the first derivative. Reserve is the accumulated stock effect. - Exchange Reserve + SOPR
Reserve says whether liquid supply is building. SOPR says whether that supply is being sold at profit or loss. - Exchange Reserve + MVRV
Reserve helps track available supply. MVRV helps track valuation pressure. - Exchange Reserve + Stablecoin Exchange Inflow
Reserve captures potential sell-side inventory. Stablecoin inflow captures potential buy-side ammunition. - Exchange Reserve + ETF flows
Falling reserve with strong ETF demand can intensify scarcity conditions.
Related guides to link internally:
- Bitcoin Exchange Netflow
- Bitcoin SOPR
- Bitcoin MVRV
- Stablecoin Exchange Inflow
- Bitcoin On-Chain Indicators Hub
Bitcoin Exchange Reserve Limitations
1) When it fails
It fails when exchange address identification is incomplete, when exchanges reshuffle wallets internally, or when market structure changes faster than the reserve series can reflect.
2) Why
Exchange metrics depend on entity labeling. Glassnode states clearly that exchange balance data relies on identifying and monitoring exchange-linked wallets, that exact completeness is hard to achieve, and that reported balances can often be treated as lower bounds.
3) Solution / mitigation
- combine reserve with netflow and price
- confirm with venue-specific behavior where possible
- use trend persistence, not one-day spikes
- avoid reading exchange reserve as a standalone trading signal
FAQ
What is Bitcoin Exchange Reserve?
It is the total amount of BTC held on tracked exchange wallets.
Where can I find Bitcoin Exchange Reserve data?
You can find it on CryptoQuant, Glassnode-related exchange balance tools, exchange analytics dashboards, or in exported custom datasets. CryptoQuant maintains a dedicated Exchange Reserve guide and chart page.
How reliable is Bitcoin Exchange Reserve?
Useful, but not perfect. Its reliability depends on exchange address labeling and clustering quality. That is why it should be treated as a strong structural metric, not an exact accounting identity.
Is rising Exchange Reserve bearish?
Not automatically. It usually means more liquid supply is available on exchanges, which raises distribution risk, but price can still rise if demand is strong enough.
Is falling Exchange Reserve bullish?
Usually it is supportive because fewer coins remain on exchanges, but it still needs demand confirmation.
What is the difference between Exchange Reserve and Netflow?
Netflow measures movement over a period. Exchange Reserve measures the total stock left on exchanges after those flows accumulate.
Can Exchange Reserve be used for altcoins?
Yes, but reliability varies by asset, venue coverage, and address labeling quality.
What is the best time frame to use?
Daily is best for structural analysis. Intraday can get noisy unless you are studying event-driven flows.
What indicators work best with Exchange Reserve?
Exchange Netflow, SOPR, MVRV, funding, ETF flows, and stablecoin inflows.
Why can price rise even when reserve is high?
Because reserve measures available supply, not actual executed selling. Strong demand can absorb or overpower that supply.
Does low reserve guarantee a bull market?
No. It improves the scarcity backdrop, but demand still has to show up.
Is the absolute level or the trend more important?
The trend is usually more important.
Conclusion
- Bitcoin Exchange Reserve tracks the stock of BTC sitting on exchange wallets
- It is best understood as a structural supply indicator
- Rising reserve usually means liquid supply is rebuilding
- Falling reserve usually means liquid supply is tightening
- It works best when paired with Netflow, SOPR, MVRV, and demand-side indicators
Explore Next
To read Bitcoin Exchange Reserve correctly, it helps to pair it with valuation, realized behavior, exchange flows, and liquidity indicators. These guides expand the framework from different angles:
- Bitcoin Exchange Netflow: What It Is and How to Use It
The closest companion to Exchange Reserve. If Reserve shows the stock of BTC sitting on exchanges, Netflow shows the day-to-day flow that changes that stock. - Bitcoin STH SOPR: What It Is and How to Use It
Helps answer whether short-term holders are selling at profit or loss. Useful for separating healthy reserve growth from panic-driven deposits. - Bitcoin MVRV Ratio: Definition, Formula & Cycle Signals
Adds valuation context. Exchange Reserve tells you how much BTC is available on exchanges, while MVRV helps judge whether that supply is sitting in an overheated or reset market. - Stablecoins Exchange Inflow: Definition, Formula & Signals
Tracks potential buy-side ammunition entering exchanges. Reserve reflects possible sell-side supply, while stablecoin inflow reflects incoming demand capacity.
Related Core Guides
- Bitcoin Realized Price Bands Explained: Cycle Analysis, Signals, and Historical Examples
- Bitcoin NUPL (Net Unrealized Profit/Loss): What It Is and How to Use It
- Bitcoin LTH vs STH: Supply Dynamics, Cost Basis & Market Structure
- Bitcoin Puell Multiple: Definition, Formula & Miner Signals
- Bitcoin Open Interest & Leverage Ratio
- Coin Days Destroyed (CDD) & Liveliness: Definition, Formula & Cycle Signals
- Bitcoin Funding Rates: Definition, Formula & Cycle Signals
- The 4-Year Bitcoin Cycle: Definition, Mechanics & Historical Evidence
- Bitcoin STH Realized Price Definition, Formula & Cost Basis Framework
- Bitcoin Stablecoin Supply Ratio (SSR): Definition, Formula & Cycle Signals