


Every ~1,460 days, Bitcoin's block reward is cut in half. What follows has repeated - with diminishing but unmistakable force - across four complete cycles: a supply shock, a bull market, an ATH, and a -76% to -93% drawdown. Understanding this rhythm doesn't guarantee profits, but misunderstanding it has cost investors billions.
This guide breaks down the mechanics, data, and practical implications of Bitcoin's 4-year cycle with quantitative precision - not narrative hype.
TL;DR
- What it is: A recurring ~4-year price cycle driven by Bitcoin's programmatic halving of block rewards (every 210,000 blocks)
- Key pattern: Each halving reduces new supply issuance by 50%, historically triggering a 12–18 month bull market followed by a -76% to -93% bear market
- Critical limitation: Returns are diminishing sharply - Cycle 1 delivered 90x ROI from halving, Cycle 4 peaked at under 1x
- Best use case: Macro positioning framework, not a timing tool. Useful for identifying cycle phase, not predicting exact tops/bottoms
- Combine with: MVRV Z-Score (valuation), STH Spent Output Profit Ratio (sentiment), Realized Cap (capital flows)
Table of Contents
- What Is the 4-Year Bitcoin Cycle?
- How the Cycle Is Calculated
- Cycle Phases: How to Interpret Where We Are
- Historical Cycle Evidence
- Practical Application
- 4-Year Cycle vs. Other Frameworks
- How It Relates to Other Indicators
- Limitations
- FAQ
- Conclusion
What Is the 4-Year Bitcoin Cycle?
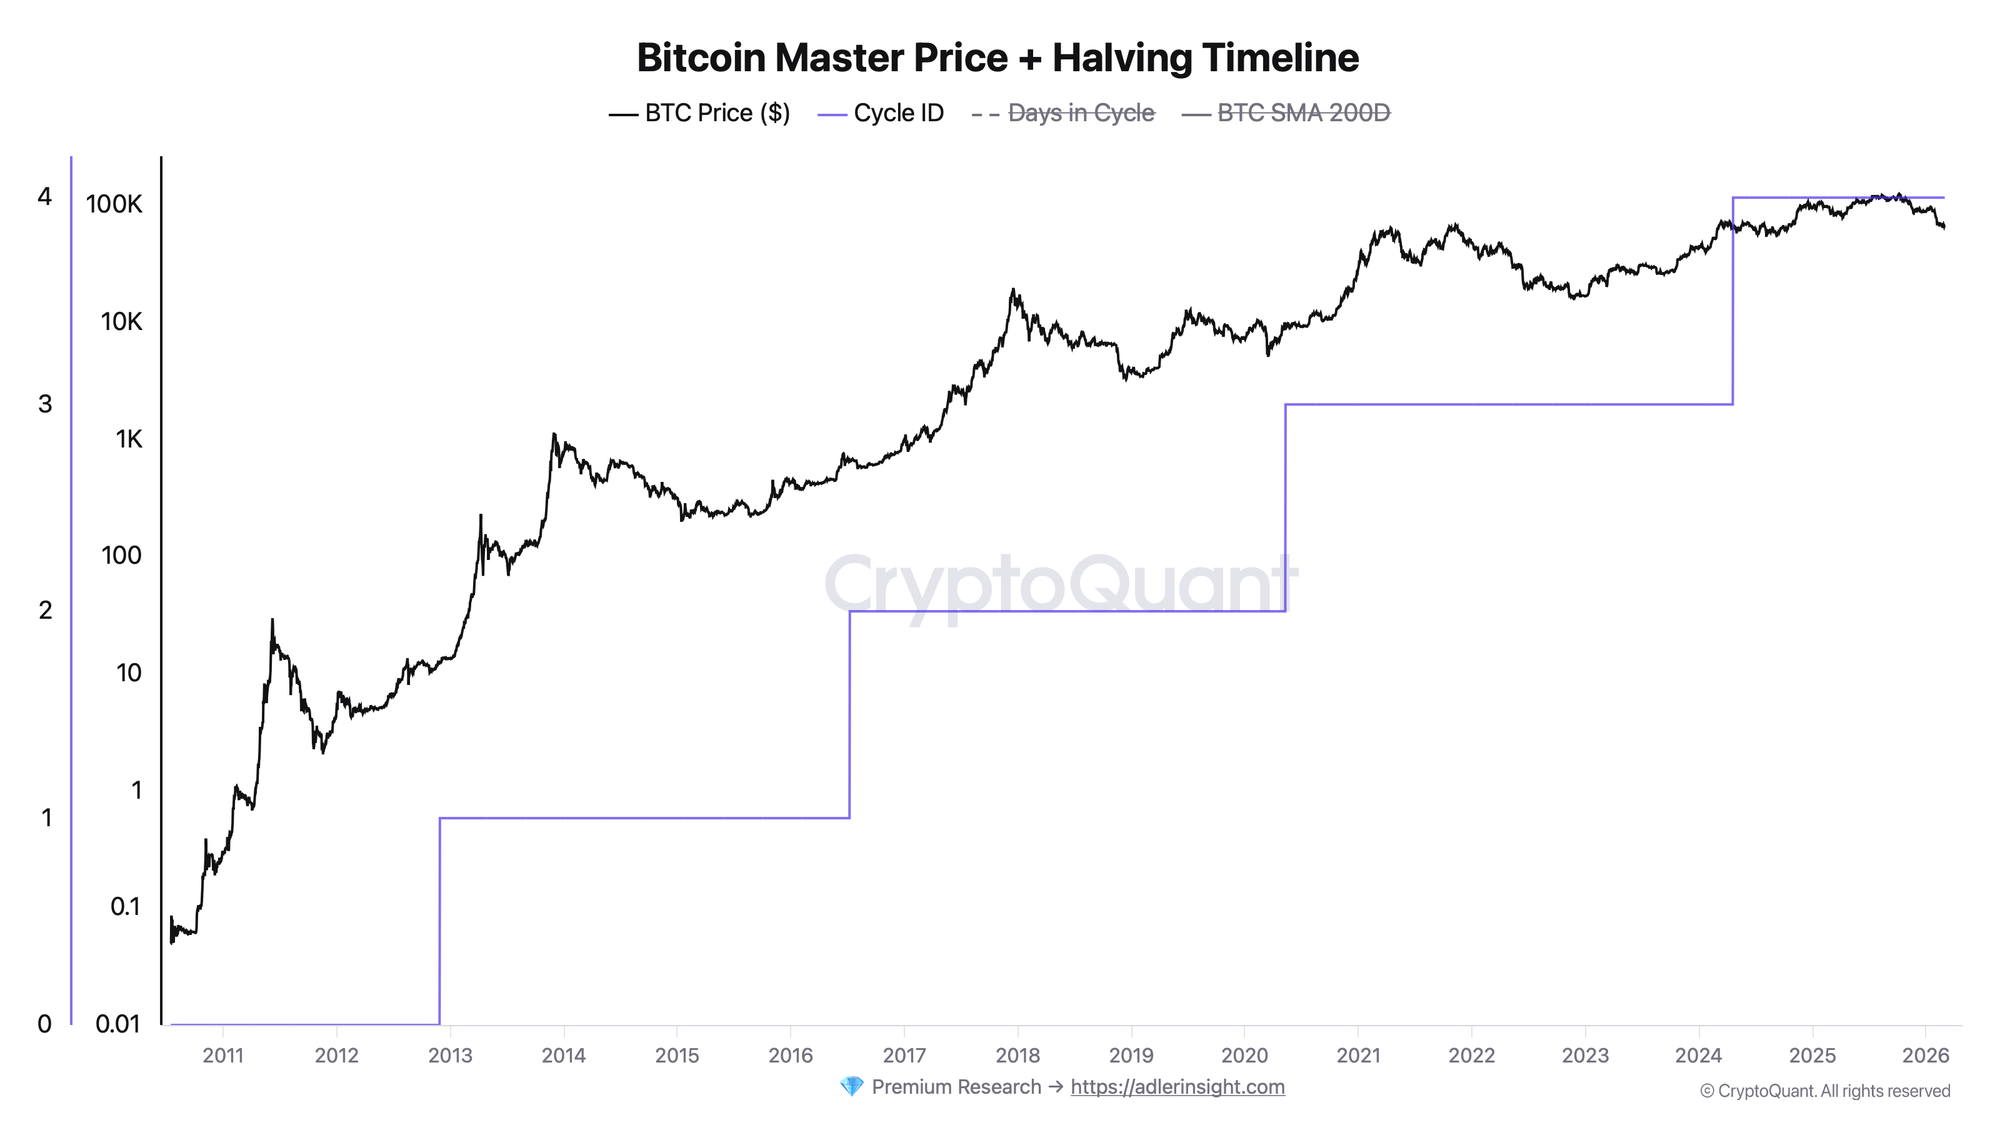
In one line: The 4-year Bitcoin cycle is a recurring macro price pattern anchored to Bitcoin's programmatic halving events, which reduce miner block rewards by 50% every 210,000 blocks (~4 years).
The cycle exists because Bitcoin's supply schedule is deterministic and public. Unlike gold or fiat currencies, every market participant can calculate exactly when new supply issuance will be cut in half. This creates anticipatory behavior: miners, institutions, and long-term holders position ahead of the event; retail follows the subsequent price action.
The mechanics are straightforward. Miners receive BTC as compensation for validating transactions. Post-halving, they receive half as many coins per block but face the same operational costs. To remain solvent at current prices, they must either sell less (reducing sell pressure) or wait for price appreciation to restore profitability. Combined with increasing demand from new market entrants, this supply-demand imbalance has historically triggered significant price appreciation in the 12–24 months following each halving.
What makes this pattern analytically valuable - and also dangerous - is its tension between mechanical consistency and diminishing magnitude. The phase structure has repeated reliably, but the return multiples compress aggressively with each cycle.
Formula
Halving Block = 210,000 × n
Where n = halving number (1, 2, 3, 4...)

New Daily Issuance = Block Subsidy × 144 (blocks/day)
Halving Date (approximate) = Genesis Date + (210,000 × n × 10 minutes)
Block subsidy by cycle:
- Cycle 0 (pre-first halving): 50 BTC/block → 7,200 BTC/day
- Cycle 1 (2012–2016): 25 BTC/block → 3,600 BTC/day
- Cycle 2 (2016–2020): 12.5 BTC/block → 1,800 BTC/day
- Cycle 3 (2020–2024): 6.25 BTC/block → 900 BTC/day
- Cycle 4 (2024–2028): 3.125 BTC/block → 450 BTC/day
Data Sources
CryptoQuant
On-chain cycle metrics, miner data
Cost: Free tier + paid
Glassnode
MVRV, SOPR, realized cap overlays
Cost: Paid
CoinGecko API
Raw OHLCV price data
Cost: Free
Blockchain.com
Block subsidy, issuance schedule
Cost: Free
TradingView
Chart overlays with cycle annotations
Cost: Free / Pro
How the Cycle Is Calculated
Step 1: Identify Halving Blocks
Each halving occurs at block heights: 210,000 / 420,000 / 630,000 / 840,000. The corresponding calendar dates become the cycle anchors.
Step 2: Assign Cycle IDs and Count Days
From each halving date, count calendar days forward. This gives days_into_cycle - the primary x-axis for cycle comparison charts. The current cycle (Cycle 4) started April 20, 2024.
Step 3: Calculate ROI from Halving
ROI from Halving = (Current Price / Price on Halving Day) - 1
Step 4: Calculate Drawdown from ATH
Drawdown from ATH = (Current Price / Rolling Maximum Price) - 1
This metric identifies bear phase depth and recovery progress.
Concrete Example - Cycle 2:
- Halving date: July 9, 2016
- Price at halving: $652
- Cycle ATH: $19,496 (December 17, 2017 - day 526 of the cycle)
- ROI from halving to ATH: +28.9x
- Bear bottom: $3,229 (December 2018 - day 889)
- Maximum drawdown from ATH: -83.4%
Visual: Cycle Structure
Halving ──► Accumulation (0–180 days) ──► Bull Run (180–550 days) ──► ATH ──► Bear (-76% to -93%) ──► New Bottom ──► Next Halving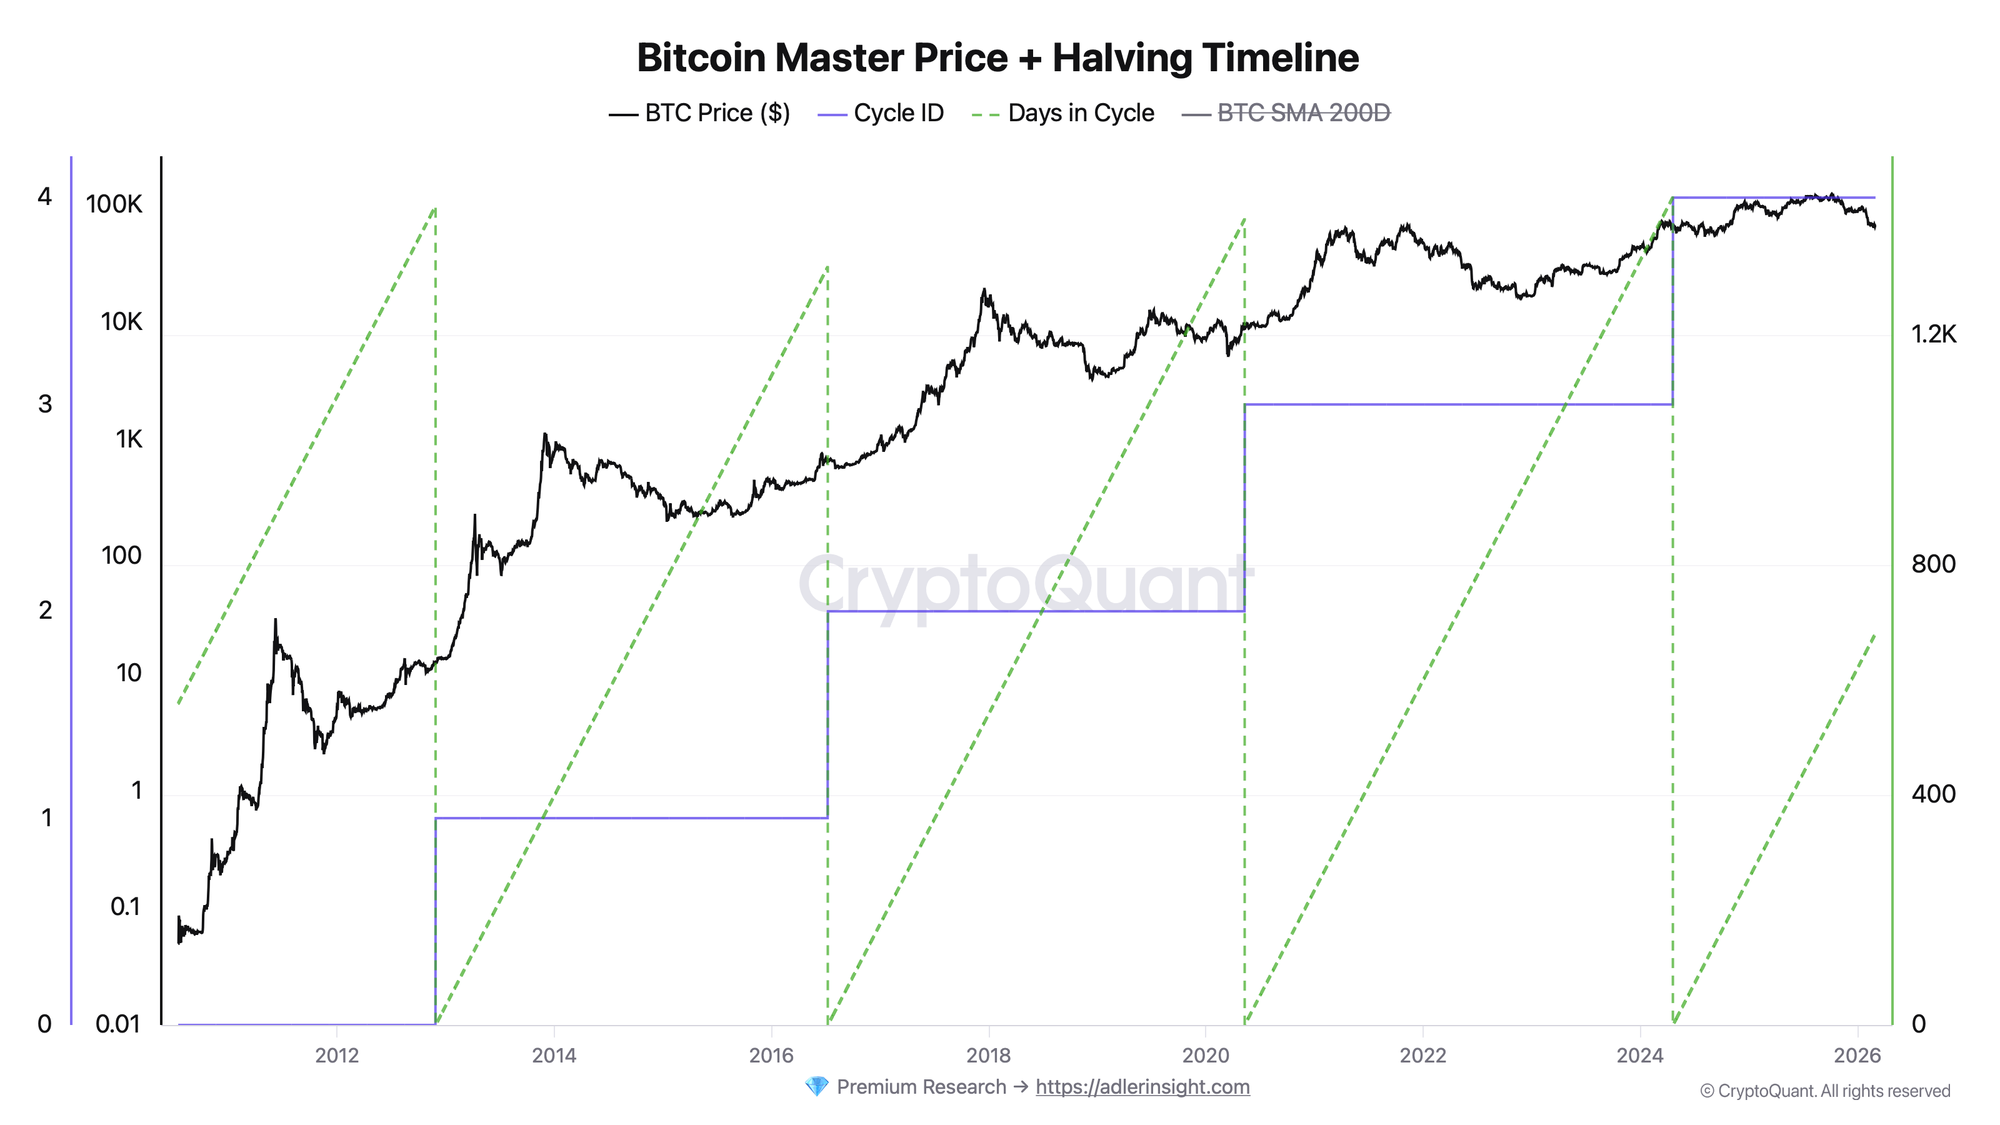
Log-scale BTC price with cycle IDs (blue step) and days-in-cycle counter (green dashes). Note consistent diagonal price trajectories from each halving base.
Cycle Phases: How to Interpret Where We Are
Zone Table
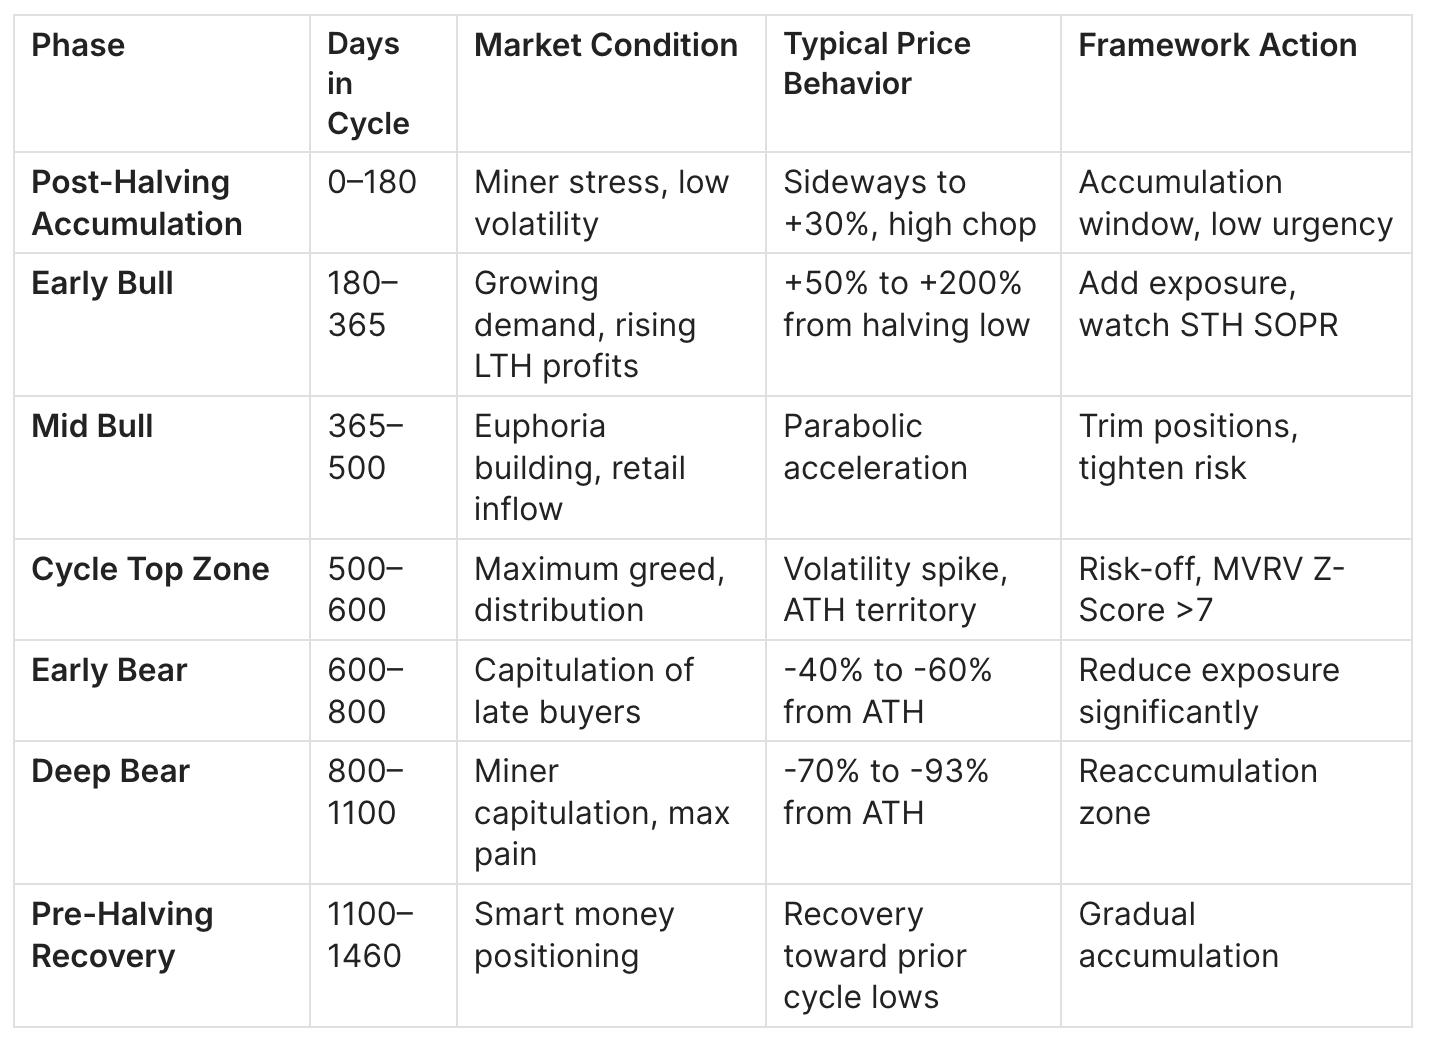
Phase: Post-Halving Accumulation (0–180 days)
The first ~6 months after a halving are historically the lowest-conviction period. Miners face margin compression; price often stagnates or chops. This phase regularly produces "halving was priced in" narratives. Data shows this is typically wrong in direction but correct in timing - the impact materializes later.
Typical mistake: Expecting immediate price surge on halving day itself. In Cycle 2, price was flat for 2 months post-halving. In Cycle 3, price briefly dipped below the halving-day price within 3 months.
Phase: Bull Run Peak Zone (500–600 days)
Across Cycles 1, 2, and 3, the cycle ATH occurred between day 367 and day 548. This is the highest-risk window for new entrants and the primary distribution zone for informed holders.
- Cycle 1 ATH: Day 367 ($1,135)
- Cycle 2 ATH: Day 526 ($19,496)
- Cycle 3 ATH: Day 548 ($67,599)
- Cycle 4 ATH: Day 534 ($124,450) - based on data through March 2026
Key observation: ATH timing is consistent. ROI multiples are not.
Phase: Bear Market Floor (800–1100 days)
Maximum drawdowns have occurred consistently in the 800–900 day range post-halving:
- Cycle 1 bear bottom: Day 777, -82.6%
- Cycle 2 bear bottom: Day 889, -83.4%
- Cycle 3 bear bottom (2022): approximately Day 730, -76.4% from the 2021 ATH
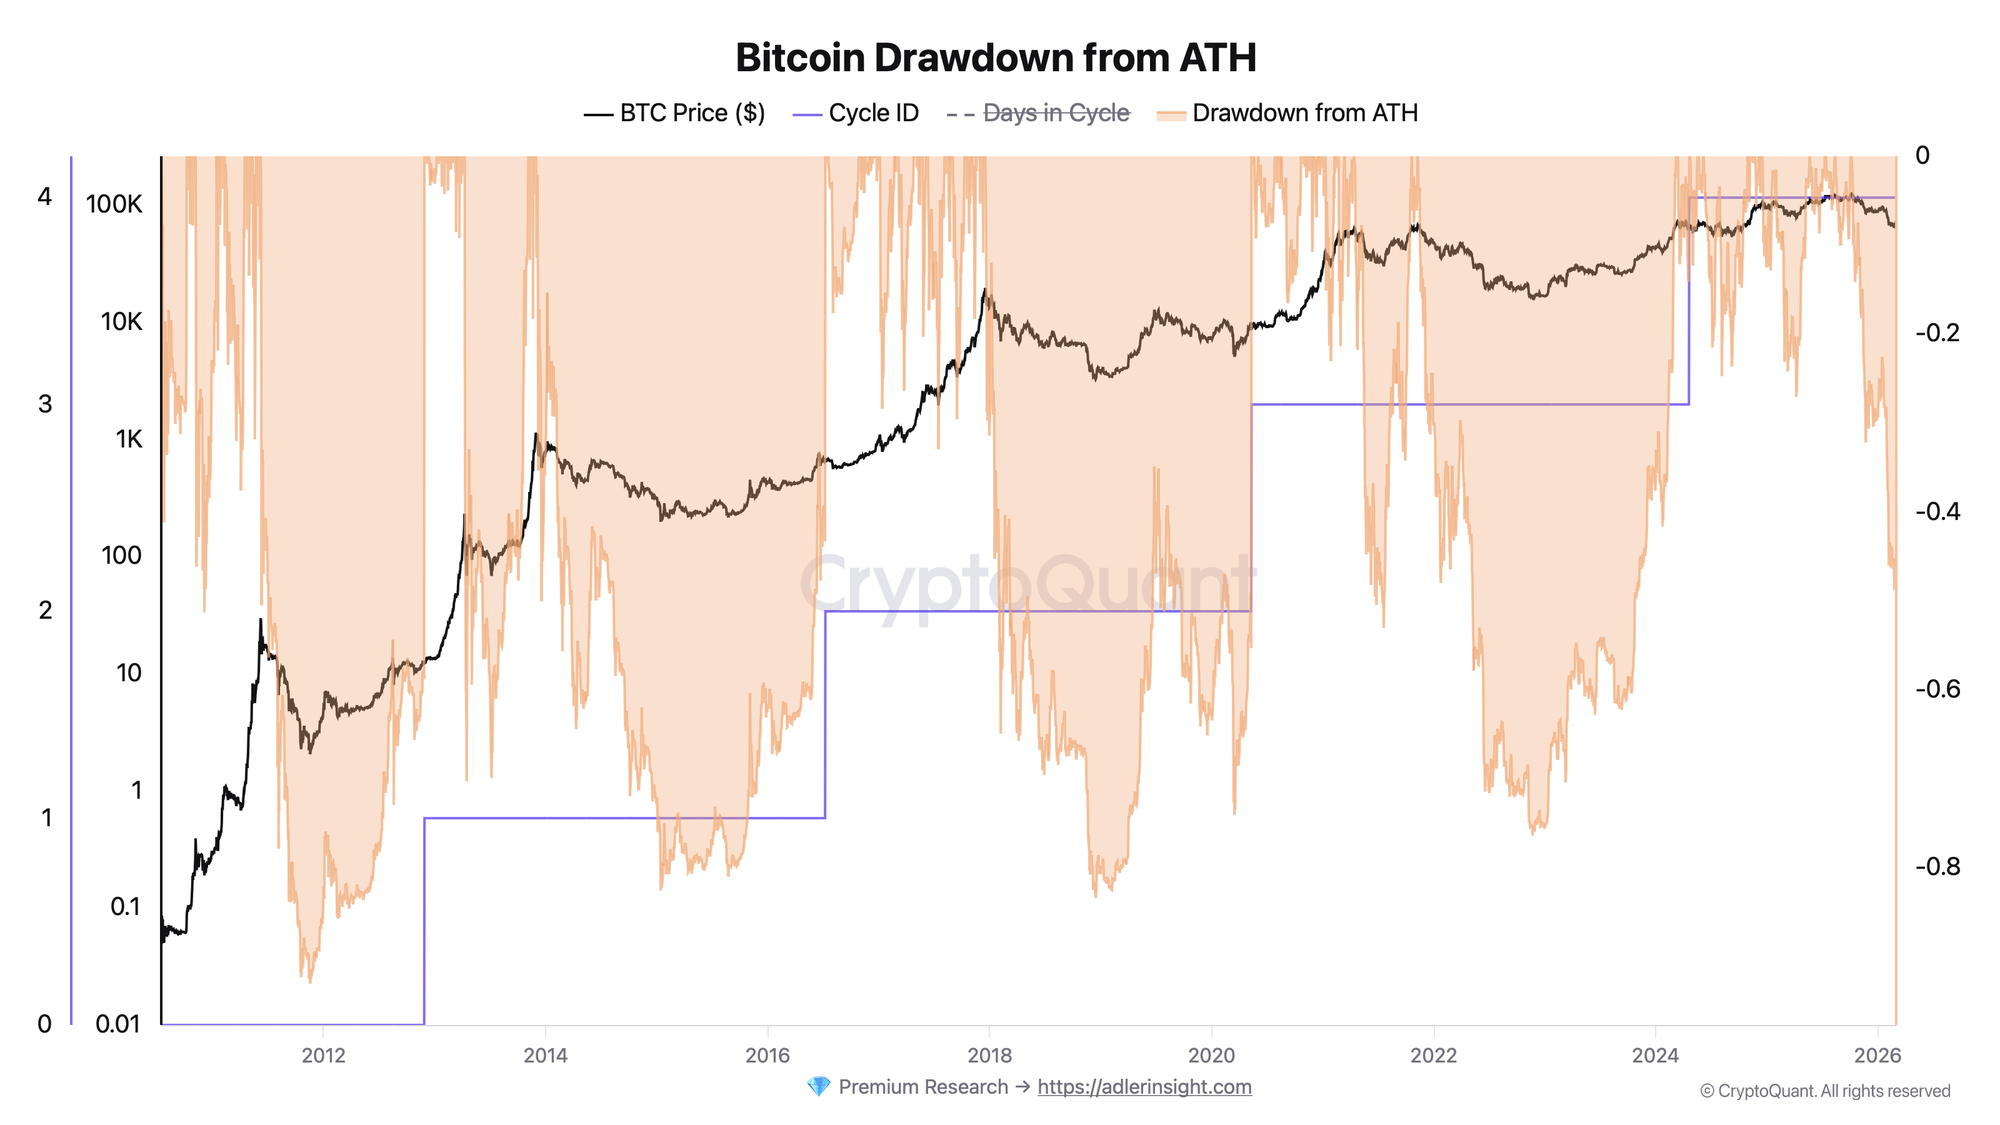
Orange shading shows drawdown depth per cycle. Note the compression: Cycles 1 and 2 saw -83%+ drawdowns; Cycle 3 bottomed at -76%; Cycle 4 has not exceeded -49% so far.
Historical Cycle Evidence
Cycle 1: 2012–2016 - The Proof of Concept
Situation: First programmed halving, Bitcoin had no institutional presence. Market cap was under $150M at halving.
Metric behavior: Block subsidy dropped from 50 to 25 BTC. Daily issuance halved from 7,200 to 3,600 BTC.
Price behavior: Halving price $12 → ATH $1,135 on day 367 (+90.9x ROI). Bear bottom $197 (-82.6% from ATH).
Conclusion:
- Supply shock on a thin, illiquid market produced an extreme price response
- Established the cycle archetype but at a scale impossible to repeat
Cycle 2: 2016–2020 - The First Institutional Attention
Situation: CME futures launched mid-cycle (December 2017), bringing the first wave of institutional short sellers precisely at the ATH.
Metric behavior: Block subsidy 12.5 BTC. Halving price $652.
Price behavior: ATH $19,496 on day 526 (+28.9x ROI). Bear bottom $3,229 (-83.4% from ATH) - a 3-year round trip for buyers who entered above $3,000.
Conclusion:
- Returns compressed 3x vs. Cycle 1 despite similar percentage drawdown
- CME futures introduced new dynamics: derivatives-driven volatility at cycle tops
Cycle 3: 2020–2024 - The Institutional Adoption Cycle
Situation: COVID monetary expansion, corporate treasury adoption (MicroStrategy, Tesla), and the first major macro tailwind for Bitcoin.
Metric behavior: Block subsidy 6.25 BTC. Halving price $8,721.
Price behavior: Two ATH peaks - $67,599 (Nov 2021, day 548) and $72,754 (Mar 2024, day 1,402 - pre-halving ATH). Bear bottom $15,959 in November 2022 (-76.4% from the 2021 ATH).
Conclusion:
- First cycle with a "double top" structure - new demand regime from ETF anticipation created a pre-halving ATH
- Bear drawdown compressed to -76% as institutional floors emerged
- ROI from halving compressed to 7.3x
Cycle 4: 2024–2028 - The ETF Cycle (In Progress)
Situation: Spot Bitcoin ETFs approved January 2024, opening institutional demand at scale. BlackRock, Fidelity, and others now collectively hold significant BTC.
Metric behavior: Block subsidy 3.125 BTC - lowest ever. Halving price $64,242.
Price behavior (through March 2026): ATH $124,450 reached on day 534 of cycle. Current price $66,354, down -46.7% from ATH. Max ROI from halving to date: 0.94x (not yet profitable vs. halving-day price for new buyers at current levels).
Conclusion:
- ETF structural demand appears to be compressing bear market drawdowns
- Diminishing returns thesis confirmed: peak ROI from halving now <1x at current prices
- Whether this is a mid-cycle correction or the cycle top remains unresolved
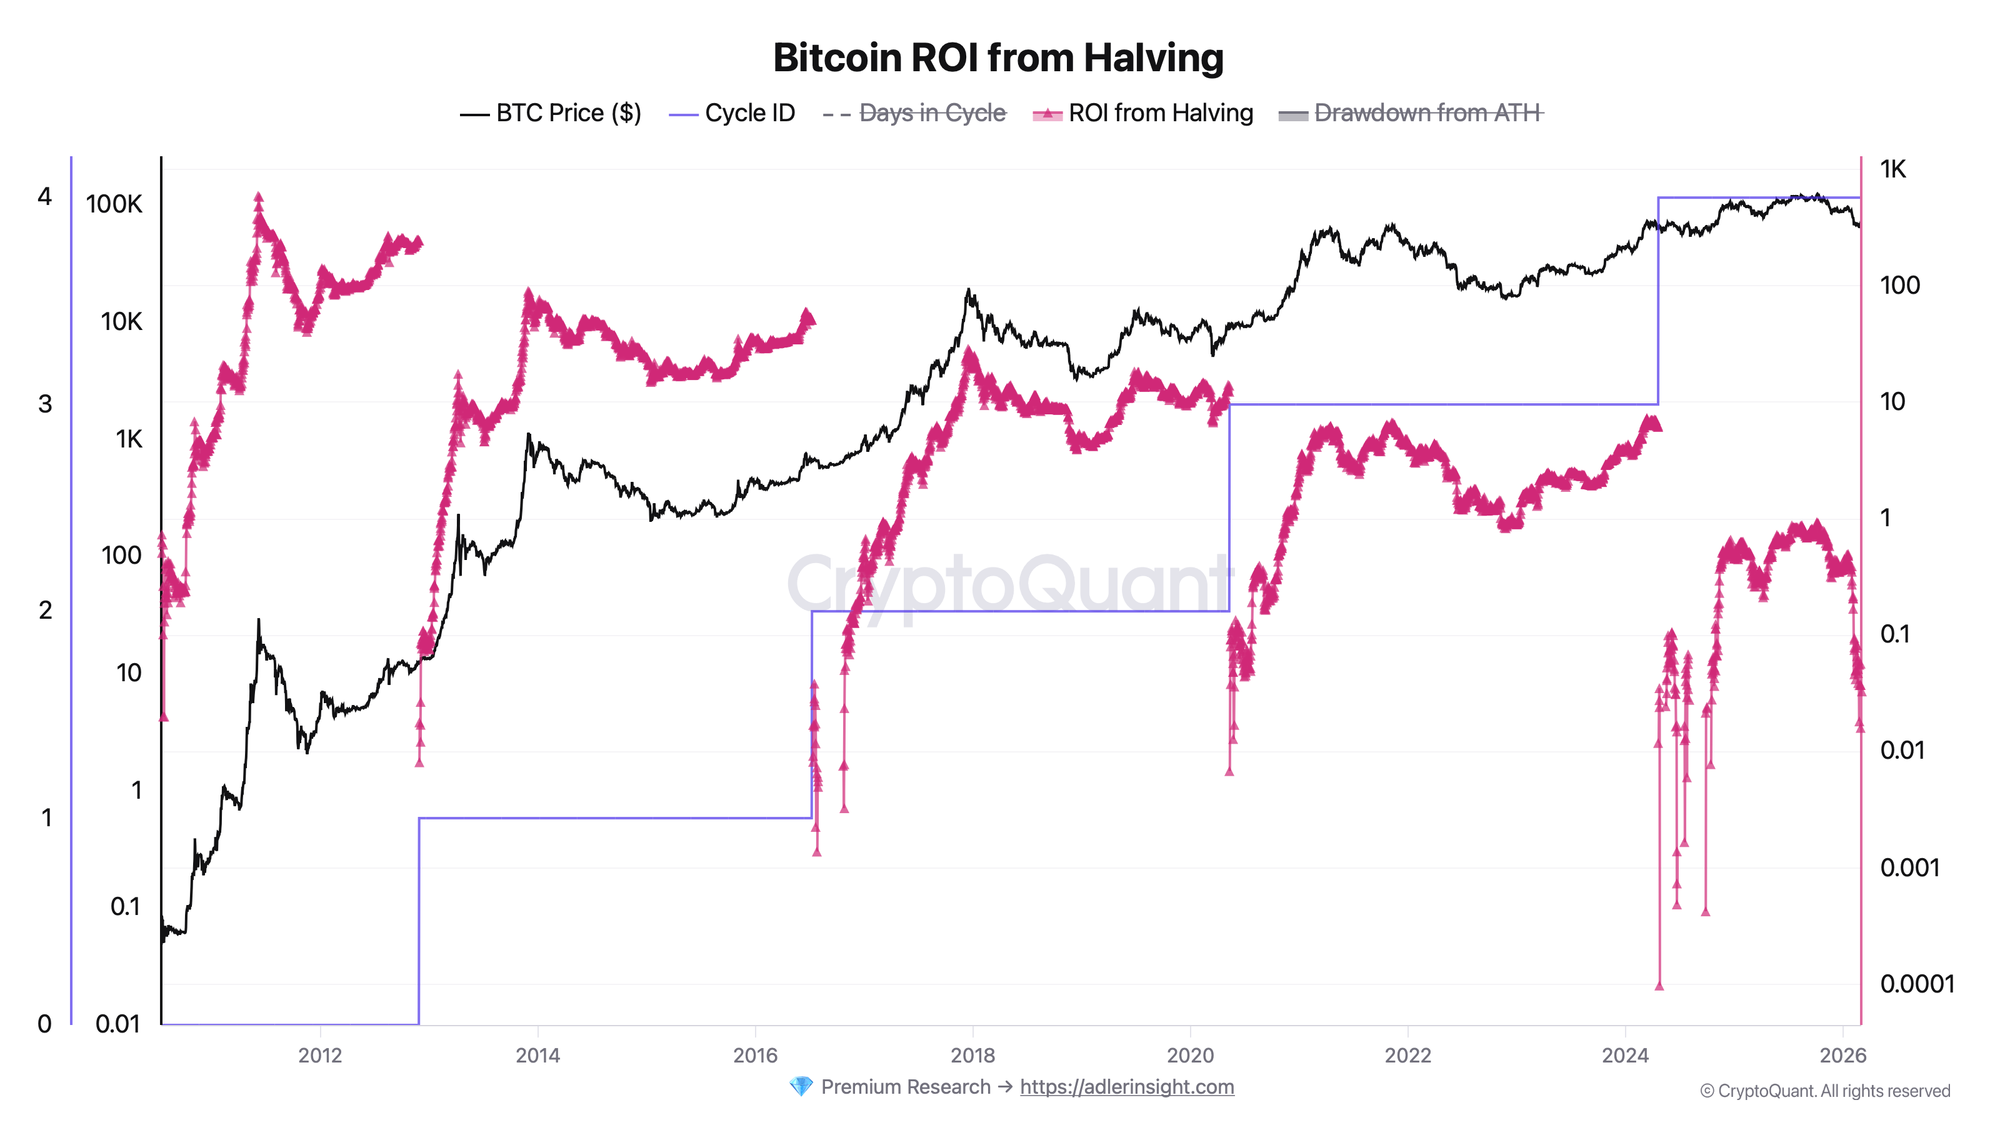
Pink line shows ROI multiple from halving day across all cycles. The compression from 90x → 28x → 7x → <1x is the most important trend in this chart.
Practical Application
Risk disclaimer: This is a framework for positioning and risk management - not financial advice. All signals require confirmation and invalidation rules.
Accumulation / Buy Framework
Signal condition (cycle-based):
- Days in cycle: 800–1,200 (deep bear / pre-halving zone)
- Drawdown from ATH: -65% or deeper
- ROI from previous halving: below 2x (historically near cycle floors)
Confirmation conditions:
- MVRV Z-Score below 1.0 (undervaluation)
- STH SOPR consistently below 1.0 (capitulation confirmed)
- Miner capitulation signal (hash rate decline >15% over 30 days)
Common traps:
- Averaging in during days 600–800 - price often has another -30% to go
- Using absolute price levels instead of cycle-relative drawdown metrics
Action guidance:
- Gradual accumulation (DCA) outperforms lump-sum in this phase historically
- Position sizing: 40–60% of target allocation in deep bear; complete on recovery confirmation
Risk-Off / Distribution Framework
Signal condition (cycle-based):
- Days in cycle: 480–620
- ROI from halving exceeds prior cycle's ROI at the same cycle day
- Drawdown from ATH near 0% (new ATH territory)
Confirmation conditions:
- MVRV Z-Score above 6.0–7.0 (historical distribution zone)
- LTH SOPR showing sustained profit-taking above 1.05
- Funding rates persistently positive with high OI
Common traps:
- Selling too early at day 400 because "it must be the top" - Cycles 2 and 3 ran well past day 500
- Holding through -50% drawdown believing "this cycle is different"
Action guidance:
- Begin trimming positions when MVRV >5.0 + days 480–550
- Full risk-off when MVRV >7.0 or if price drops >25% from recent ATH with high volume
Neutral / Wait Framework
Signal condition:
- Days in cycle: 0–180 (post-halving accumulation)
- No clear trend in MVRV, drawdown recovering from -30 to -50%
Action guidance:
- Maintain base position, reduce new capital deployment
- Monitor miner revenue trends as a leading indicator of near-term supply pressure
The 4-Year Cycle vs. Other Frameworks
Comparison Table
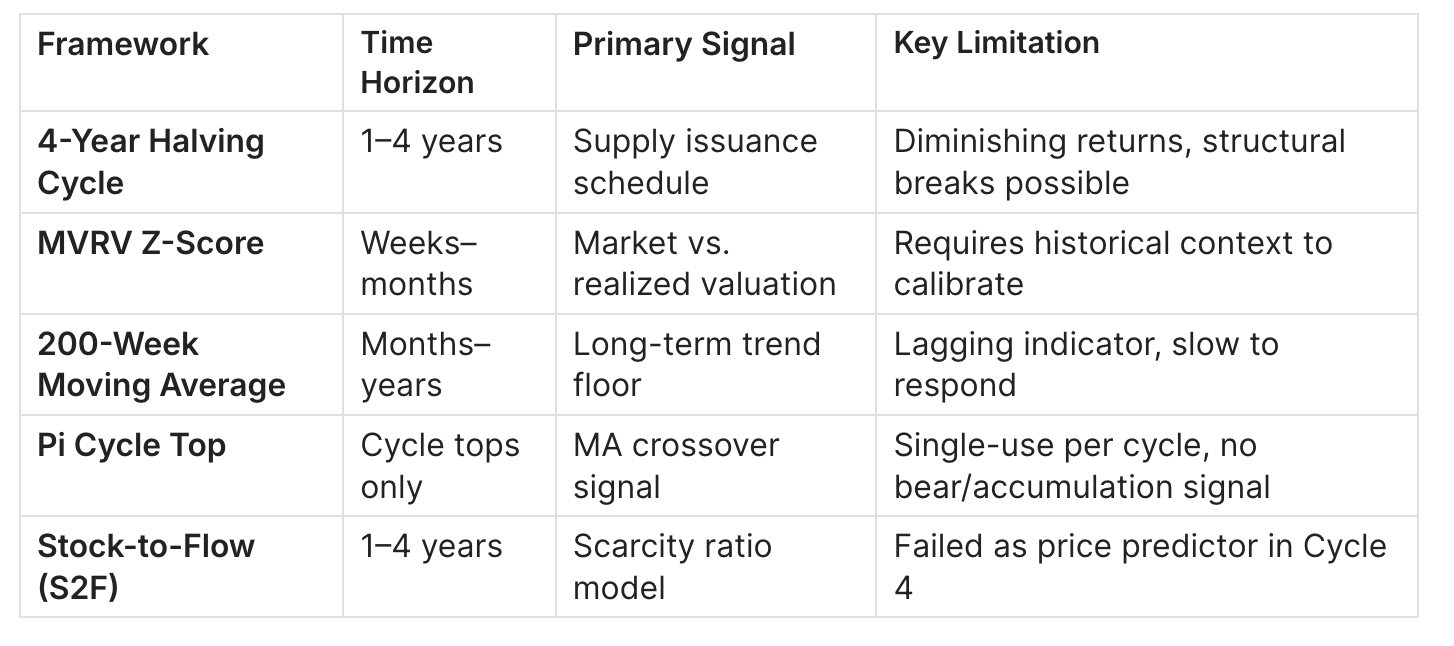
When to Use Which
Use the 4-year cycle framework when: You need macro phase context - are we in bull, bear, or accumulation? It gives direction, not precision.
Use MVRV Z-Score when: You need quantitative valuation thresholds with historical calibration for specific entry/exit levels.
Use 200W MA when: You want a simple floor indicator. The 200W MA has never been broken on a monthly close - it marks the "maximum fear" accumulation zone.
Combined analysis:
- Recipe 1 (cycle top identification): Days in cycle 480–600 + MVRV Z-Score >6 + Pi Cycle Top crossover = highest-confidence distribution signal
- Recipe 2 (bottom identification): Days in cycle 800–1100 + price near 200W MA + MVRV Z-Score <1.0 = highest-confidence accumulation signal
How the 4-Year Cycle Relates to Other Indicators
Mathematical relationships:
Miner Revenue = Block Subsidy × BTC Price × 144 blocks/day
Post-halving: Revenue is halved unless price at least doubles

Stock-to-Flow Ratio = Circulating Supply / Annual New Issuance
Each halving doubles S2F (e.g., Cycle 3 S2F ≈ 56, post-Cycle 4 S2F ≈ 112)

MVRV = Market Cap / Realized Cap
Cycle framework predicts MVRV peaks near ATH (historically MVRV 5–8 at tops)
and troughs at bear bottoms (MVRV 0.8–1.2)
Relationships to watch:
- Cycle Phase → MVRV Z-Score: MVRV Z-Score reliably peaks during the day 500–600 cycle window and bottoms near day 800–1000. Use cycle day as a prior for MVRV interpretation.
- Cycle Phase → Funding Rates: Funding rates spike most aggressively in the late-bull phase (days 450–580). Sustained positive funding in this window is a distribution signal, not a trend confirmation.
- Halving → Miner Hash Rate: Hash rate typically dips 5–15% in the 30–60 days after a halving as less efficient miners capitulate, then recovers as price rises. This hash rate recovery is a historically reliable early-bull confirmation.
- Cycle Top → Realized Cap Growth: Realized Cap grows fastest in the 6 months approaching cycle tops as new buyers pay higher prices. A deceleration in Realized Cap growth has historically marked distribution phases.
Limitations
1. Diminishing Returns Make Historical Comparisons Misleading
Problem: The framework is often presented with Cycle 1 (90x ROI) prominently featured. By Cycle 4, the same framework produced <1x ROI from the halving price at the same cycle day.
Why: Market cap scale. Going from $100M to $1B is structurally easier than $1T to $10T. The supply shock of 3,600 BTC/day → 1,800 BTC/day had enormous impact on a thin market. The same reduction from 900 → 450 BTC/day affects a market with ETF demand of 10,000+ BTC/day.
Mitigation: Always contextualize claims with specific cycle numbers. "The halving historically causes X" requires the caveat "in Cycles 1–2; the effect has compressed significantly in Cycles 3–4."
2. The Cycle Clock Doesn't Know About Macro
Problem: The 4-year cycle is an endogenous Bitcoin mechanism. It has no relationship to Federal Reserve policy, global liquidity cycles, or macro risk-off events. In 2022, Bitcoin entered its bear phase coinciding with the most aggressive Fed tightening cycle in 40 years - the two effects compounded.
Why it matters: Cycle positioning can be structurally correct but fail if macro timing is wrong. A position built on "day 900 historically is the accumulation zone" can still lose 30% more if global risk appetite collapses.
Mitigation: Layer macro regime indicators (Global M2, Fed balance sheet, DXY trend) on top of the cycle framework. Never use cycle day alone to size positions.
3. Structural Breaks Are Possible and Underpriceable
Problem: The cycle assumes Bitcoin's market structure remains primarily driven by supply issuance dynamics. Spot ETF approval in January 2024 added a structural demand source that doesn't reset every 4 years. Regulatory bans, protocol-level changes, or major security events could break the cycle entirely.
Why it matters: Four data points (halvings) is a statistically thin basis for a trading framework. The pattern has been consistent but confirmation bias likely amplifies its perceived reliability.
Mitigation: Use the cycle as a probabilistic prior, not a deterministic rule. Assign scenario weights: "if cycle pattern holds → X; if structural break → Y" rather than treating cycle timing as certainty.
FAQ
What is the 4-year Bitcoin cycle?
It's a recurring macro price pattern anchored to Bitcoin's programmed halvings - events that reduce the block reward by 50% every 210,000 blocks. The cycle encompasses a bull market (typically 12–18 months post-halving), an ATH, a bear market (-76% to -93% drawdown historically), and a recovery phase leading to the next halving.
When is the next Bitcoin halving?
The next halving (Cycle 5) is projected for approximately April 2028 at block height 1,050,000. The block subsidy will drop from 3.125 to 1.5625 BTC.
Where can I track days into the current cycle?
CryptoQuant, Glassnode, and Bitcoin Visuals all track days since halving in real time. The current cycle (Cycle 4) started April 20, 2024.
Is the 4-year cycle still valid in 2025/2026?
The phase structure remains present in the data - Cycle 4's ATH occurred at day 534, consistent with Cycles 2 and 3. However, ROI magnitude has compressed dramatically (from 90x in Cycle 1 to <1x in Cycle 4 at current prices), and ETF-driven structural demand is altering bear market depth. The cycle as a phase framework retains value; as a price target model, it has broken down.
Has Bitcoin ever broken the 4-year cycle?
No halving has yet failed to produce a subsequent ATH, though the lag and magnitude vary. The 2022 bear market was notably deeper and longer than many expected in Cycle 3, partly due to macro headwinds (Fed tightening) coinciding with the cycle's bear phase.
Can the 4-year cycle be used for altcoins?
Altcoins follow Bitcoin's cycle broadly but amplify it - they peak later (typically weeks to months after BTC's ATH) and fall harder. However, altcoins don't have their own halvings and are more sensitive to liquidity conditions and sector-specific narratives. The framework is weakest for altcoins.
What's the difference between "days in cycle" and "days since halving"?
They're equivalent. Both count calendar days from the most recent halving date. "Days in cycle" is the term used when you're analyzing cycle phase structure across multiple cycles.
How reliable is the cycle framework?
With only 4 complete cycles, any statistical confidence interval is wide. The phase structure (bull → top → bear → bottom) has been consistent, but specific day counts and drawdown percentages vary. Treat it as a macro GPS - useful for indicating general direction and approximate position, not turn-by-turn navigation.
What were the maximum drawdowns in each cycle?
- Cycle 1 (2013 ATH): -82.6% bear bottom
- Cycle 2 (2017 ATH): -83.4% bear bottom
- Cycle 3 (2021 ATH): -76.4% bear bottom
- Cycle 4 (2025 ATH): -48.8% maximum drawdown to date (cycle ongoing)
Where do I find the raw data to replicate these charts?
The charts in this guide use CryptoQuant data (block-level price, cycle ID, days in cycle, ROI from halving, drawdown from ATH). For free alternatives, combine CoinGecko OHLCV data with manually annotated halving dates.
Conclusion
The 4-year Bitcoin cycle is the most widely cited macro framework in cryptocurrency analysis - and one of the most frequently misapplied.
Five things the data actually shows:
- The phase structure is real and consistent. Cycle ATHs across Cycles 1–4 all occurred between day 367 and day 548. Bear bottoms have occurred between day 730 and day 900.
- Return magnitude is compressing at an accelerating rate. 90x → 28x → 7x → <1x. Anyone projecting Cycle 4 targets using Cycle 1 multiples is misrepresenting the data.
- Bear drawdowns are also compressing. -93% → -83% → -76% → -49% (so far). This is consistent with a maturing, more liquid market with structural institutional demand.
- Macro conditions override cycle timing. The 2022 bear (-76%) was amplified by Fed tightening; the 2024 recovery was accelerated by ETF inflows. The cycle is a prior, not a deterministic signal.
- Four data points is not a law. The pattern is suggestive, not predictive. The value is in framework thinking - understanding phase context - not in mechanical price targeting.
Combine With:
- 🔗 MVRV Z-Score - Quantitative valuation layer to identify cycle tops and bottoms with precision. → MVRV Z-Score: How to Identify Bitcoin Market Tops and Bottoms
- 🔗 STH SOPR - Short-term holder sentiment tracker most useful during the bull phase (days 180–550). → Bitcoin STH SOPR: What It Is and How to Use It
- 🔗 Puell Multiple - Miner revenue signal that confirms post-halving capitulation and cycle bottom zones. → Bitcoin Puell Multiple: Definition, Formula & Miner Signals
Want cycle analysis delivered before the market moves?
📩 Adler AM - Free daily Bitcoin morning brief. Cycle position, key levels, on-chain context. Every weekday.
💎 Adler Premium - Stop Guessing. Get The Plan. One action per week (BUY / HOLD / EXIT). Triggers that change it. Invalidation that protects you. 10 minutes/week. No noise. Just the plan. $30/month.