
Bitcoin lost about one-fifth of its value over the past 3 months and shows negative annual performance. Price structure relative to moving averages and monthly RSI help determine whether this remains a correction within the cycle or signals a deeper reversal.
TL;DR
This brief analyzes price dynamics over the past 3 months and year-over-year through the lens of monthly RSI. The logic: the magnitude of the drawdown itself does not define the regime - what matters is RSI's position relative to long-term averages, which historically separated corrections from bear markets.
Bitcoin Price Performance
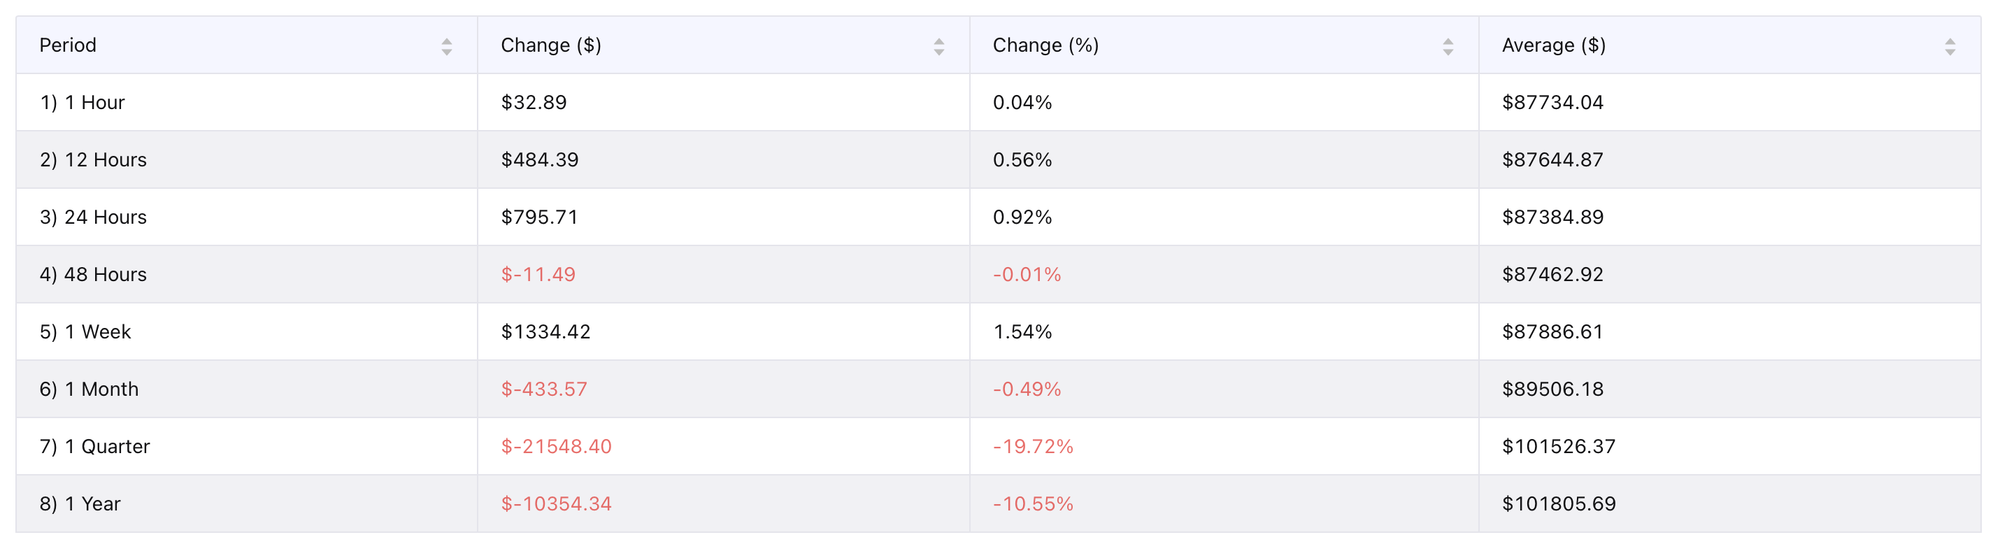
BTC drawdown over the past 3 months reached -19.7% (-$21.5K), with negative annual performance: -10.5% (-$10.4K). Meanwhile, the short-term picture has stabilized: week +1.5%, month roughly flat (-0.5%). Average price over the past 3 months ($101.5K) and year ($101.8K) nearly coincide. This underscores that for most of the period the market traded above current levels, with the main weakness concentrated in the recent decline. A double-digit 3-month drawdown is significant but not anomalous for Bitcoin. What matters more than the correction itself is its structure: stabilization at current levels after a sharp decline indicates a pause/consolidation and an attempt to form a local base. Confirmation of support will come from holding the range on subsequent tests. Check the Bitcoin MVRV Ratio to see valuation.
Bitcoin Monthly Price
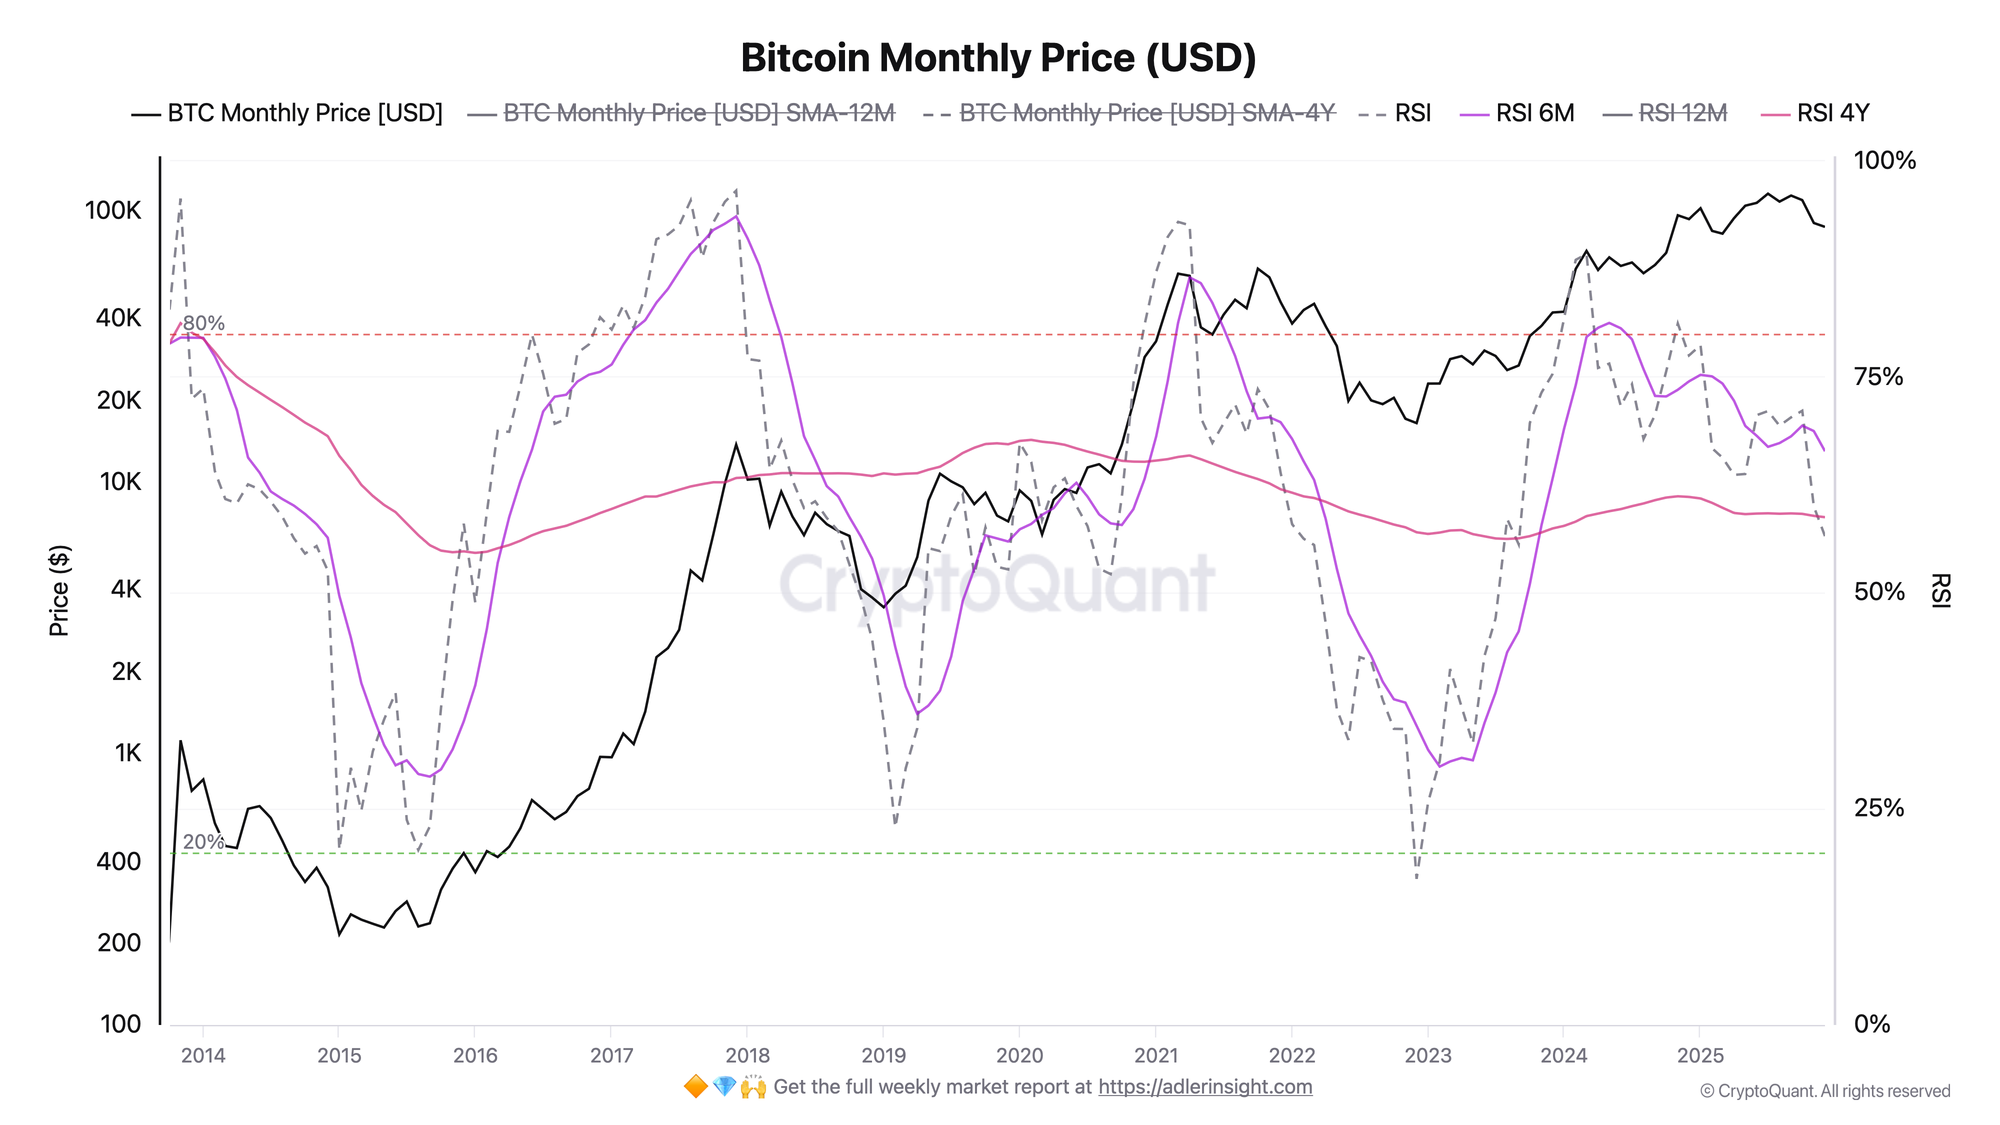
Monthly RSI stands at 56.5 and has dropped below the 12M SMA (67.3) - momentum is weaker than its average values for the first time since 2022. RSI is now approximately two points away from the 4-year SMA (58.7). In the 2018 and 2022 cycles, RSI breaking below this level often accompanied transitions into deeper bearish phases. RSI provides context for interpreting the drawdown: the combination of double-digit decline and RSI dropping below the 4Y SMA has historically increased the probability of transitioning into a deeper bearish phase.

FAQ
Why is RSI more important than price itself for determining regime?
Price shows "what happened," RSI shows "how this affects trend structure." The same -20% drawdown can be a healthy correction or the start of a deep bear market. Context determines interpretation.
What levels to watch in Q1 2026?
For RSI, holding above 55–58 preserves the chance for recovery, a sustained move below 55 increases the risk of a deeper downward phase.
CONCLUSIONS
A 20% drawdown over 3 months and negative annual performance paint a picture of significant correction. What becomes decisive is monthly RSI positioning: the current 56.5 reading sits 2 points from the 4-year average (58.7), which historically served as the regime boundary. The next 1–2 months (Q1 2026) will show whether RSI holds above the long-term 55–58 boundary or the market transitions into a deeper decline phase.