
Bitcoin Drops 10% Below STH Realized Price

Price lost a key cost-basis level for recent buyers as MVRV Z-Score kept falling.
TL;DR
Bitcoin fell below STH Realized Price during the week. MVRV Z-Score declined to 0.54. The price-to-cost ratio posted one of its sharpest monthly declines of the past year.
- $75,429
- STH Realized Price
- $68,000
- Overnight Bitcoin price level
- 0.54
- MVRV Z-Score
- 10%
- Short-term holder unrealized loss
Price Falls Below STH Realized Price
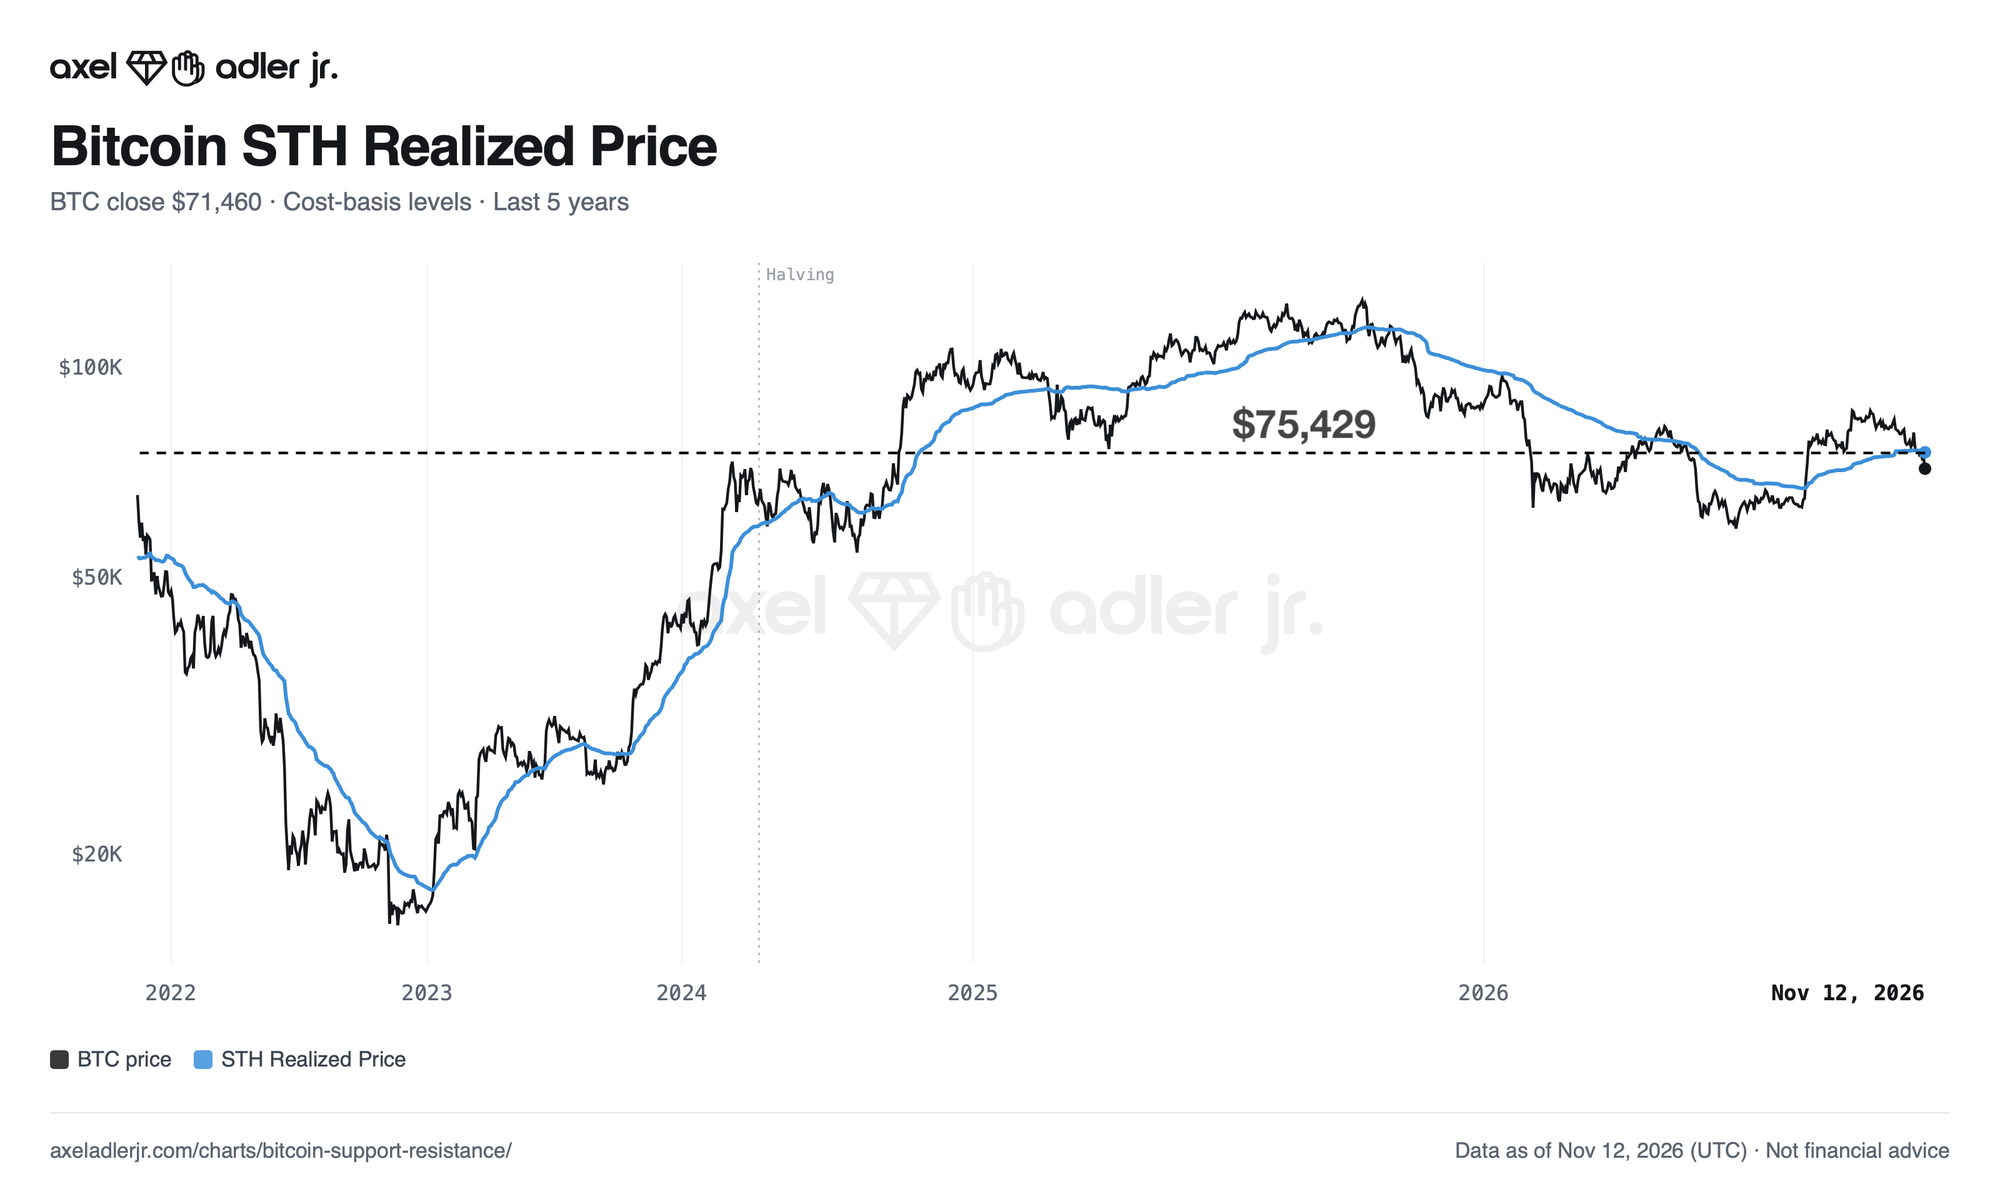
Overnight, Bitcoin fell toward $68,000. STH Realized Price stands at $75,429. Price has remained below that level for a fifth consecutive day.At the overnight level, the price-to-cost ratio is 0.90. That implies an unrealized loss of 10% for short-term holders.
The decline has widened the gap between the market price and the average acquisition price of recent buyers.
MVRV Z-Score Continues to Fall
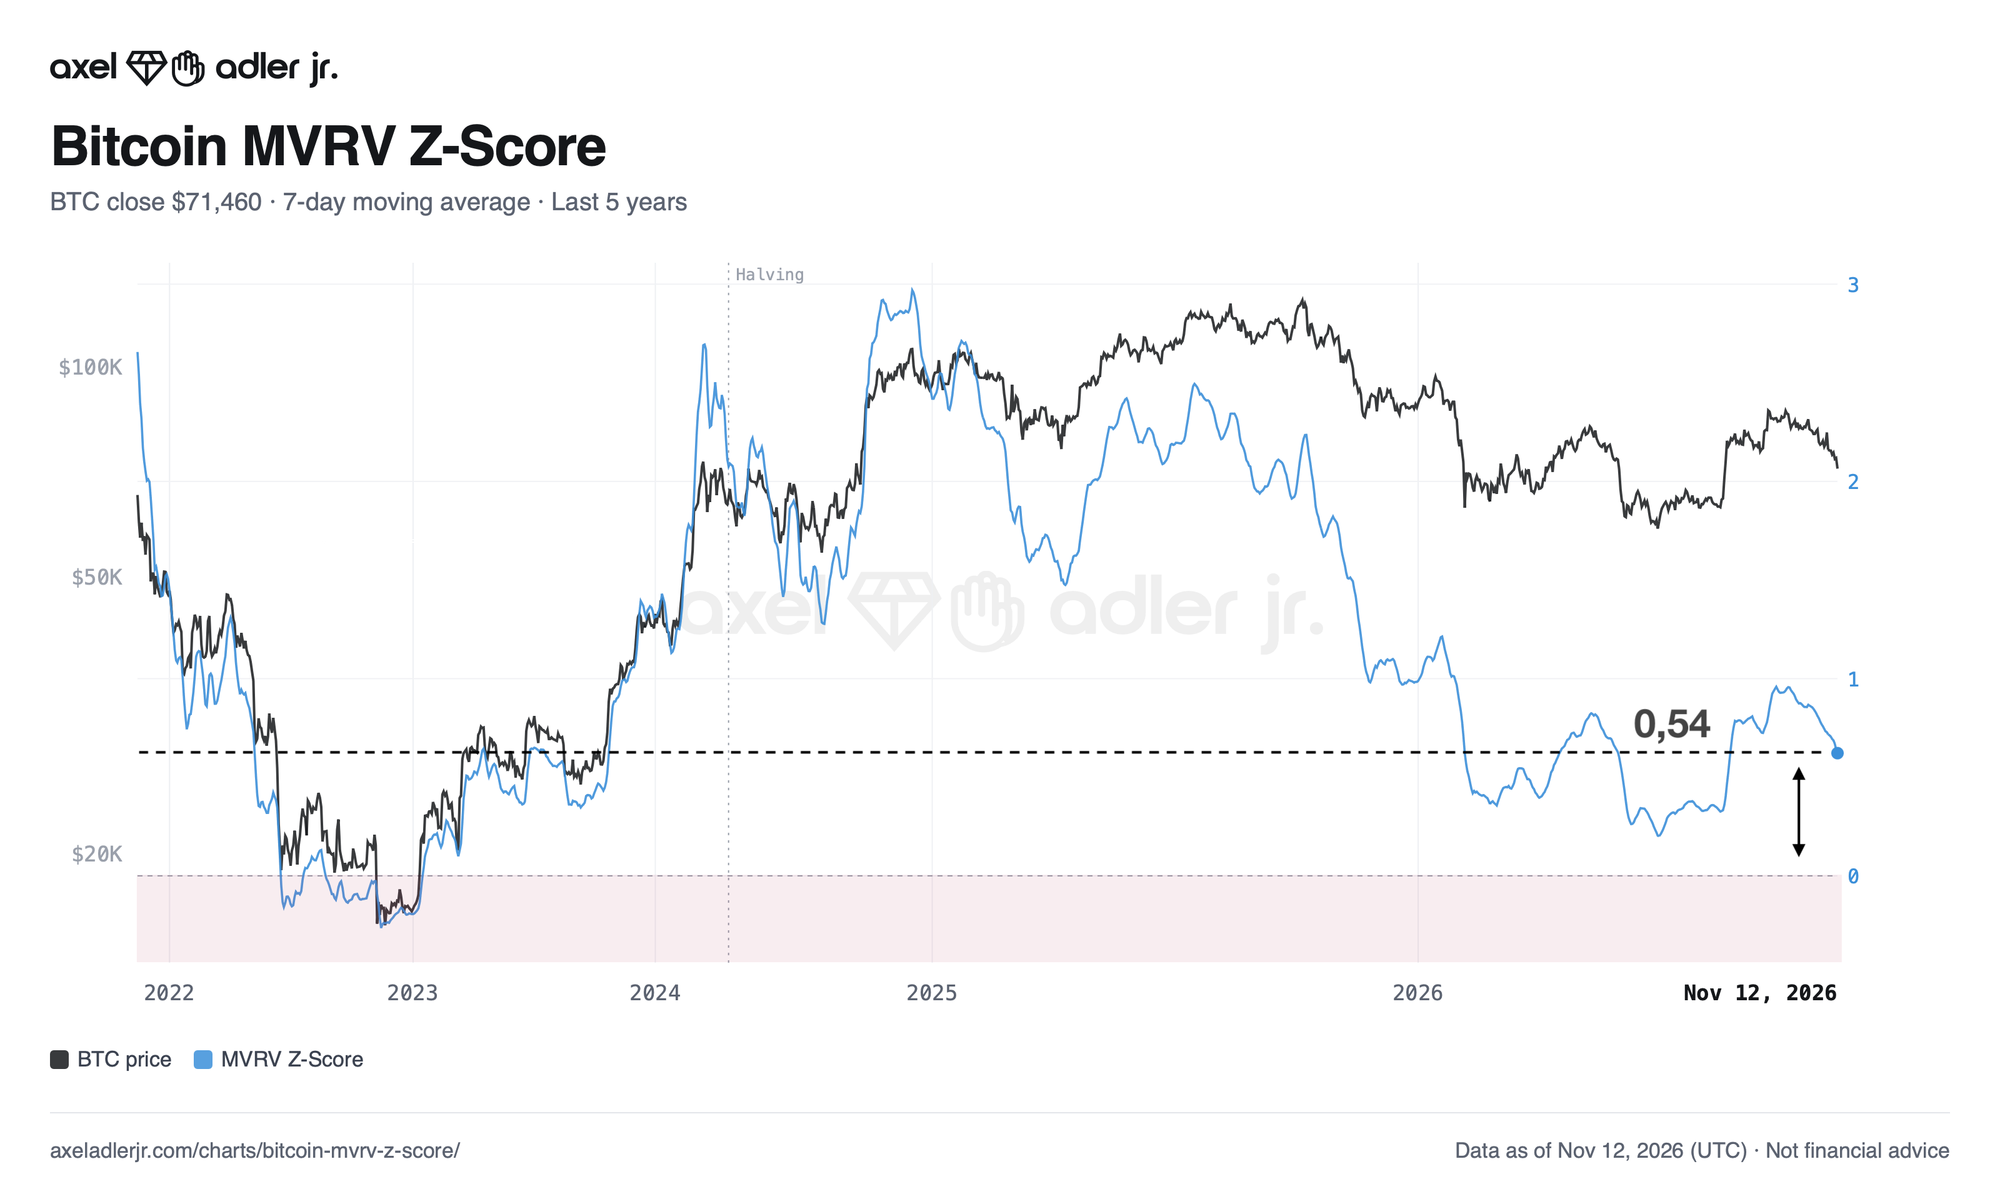
MVRV Z-Score fell by 0.13 points over the week. The gap between market capitalization and realized capitalization is narrowing. The metric remains positive, although the market's aggregate cushion of unrealized profit has shrunk. A move below zero would mean price has fallen under the average on-chain cost basis.
In late 2022, negative readings accompanied the final capitulation phase of the bear market.
FAQ
What Happened After the Last Similar MVRV Z-Score Reading?
The last similar reading came on August 19, 2026. Bitcoin traded at $69,335 at the time. The price was 14% higher a week later. This was a single historical episode, not a forecast.
How Often Has MVRV Z-Score Been This Low?
Over the past year, it was at this level or lower on 38% of days.
Conclusions
Bitcoin remains in an active correction. Price has fallen below STH Realized Price. MVRV Z-Score has declined to 0.54. The market still holds unrealized profit, but that cushion is shrinking.
A sustained move back above STH Realized Price would strengthen the case that the market is forming support. A drop below zero would point to deeper stress.
Live Charts
Explore the metrics behind this brief with live, auto-updating charts:
Valuation Models — All valuation and cost-basis model charts in one view.
MVRV Z-Score — Market value vs realized value in standard deviations across cycles.
MVRV Ratio — Market value vs realized value to identify valuation regimes and cycle risk.
NUPL — Net unrealized profit/loss across holders, mapped into cycle sentiment phases.
Your call is in. See how the on-chain data reads it every Monday →