
Bitcoin Falls Below Its One-Year Median

Bitcoin started the week at $74K, remaining below its one-year median.
TL;DR
Price and coin profitability have weakened relative to their one-year benchmarks. We look at what this says about the cycle and which levels the market needs to reclaim this week.
- $74K
- Bitcoin price at the start of the week
- $77K
- 365-day median price
- $67K
- 365-day 25th percentile
- 1.047
- Adjusted MVRV current level
Bitcoin 365D Rolling Price Quantile Bands
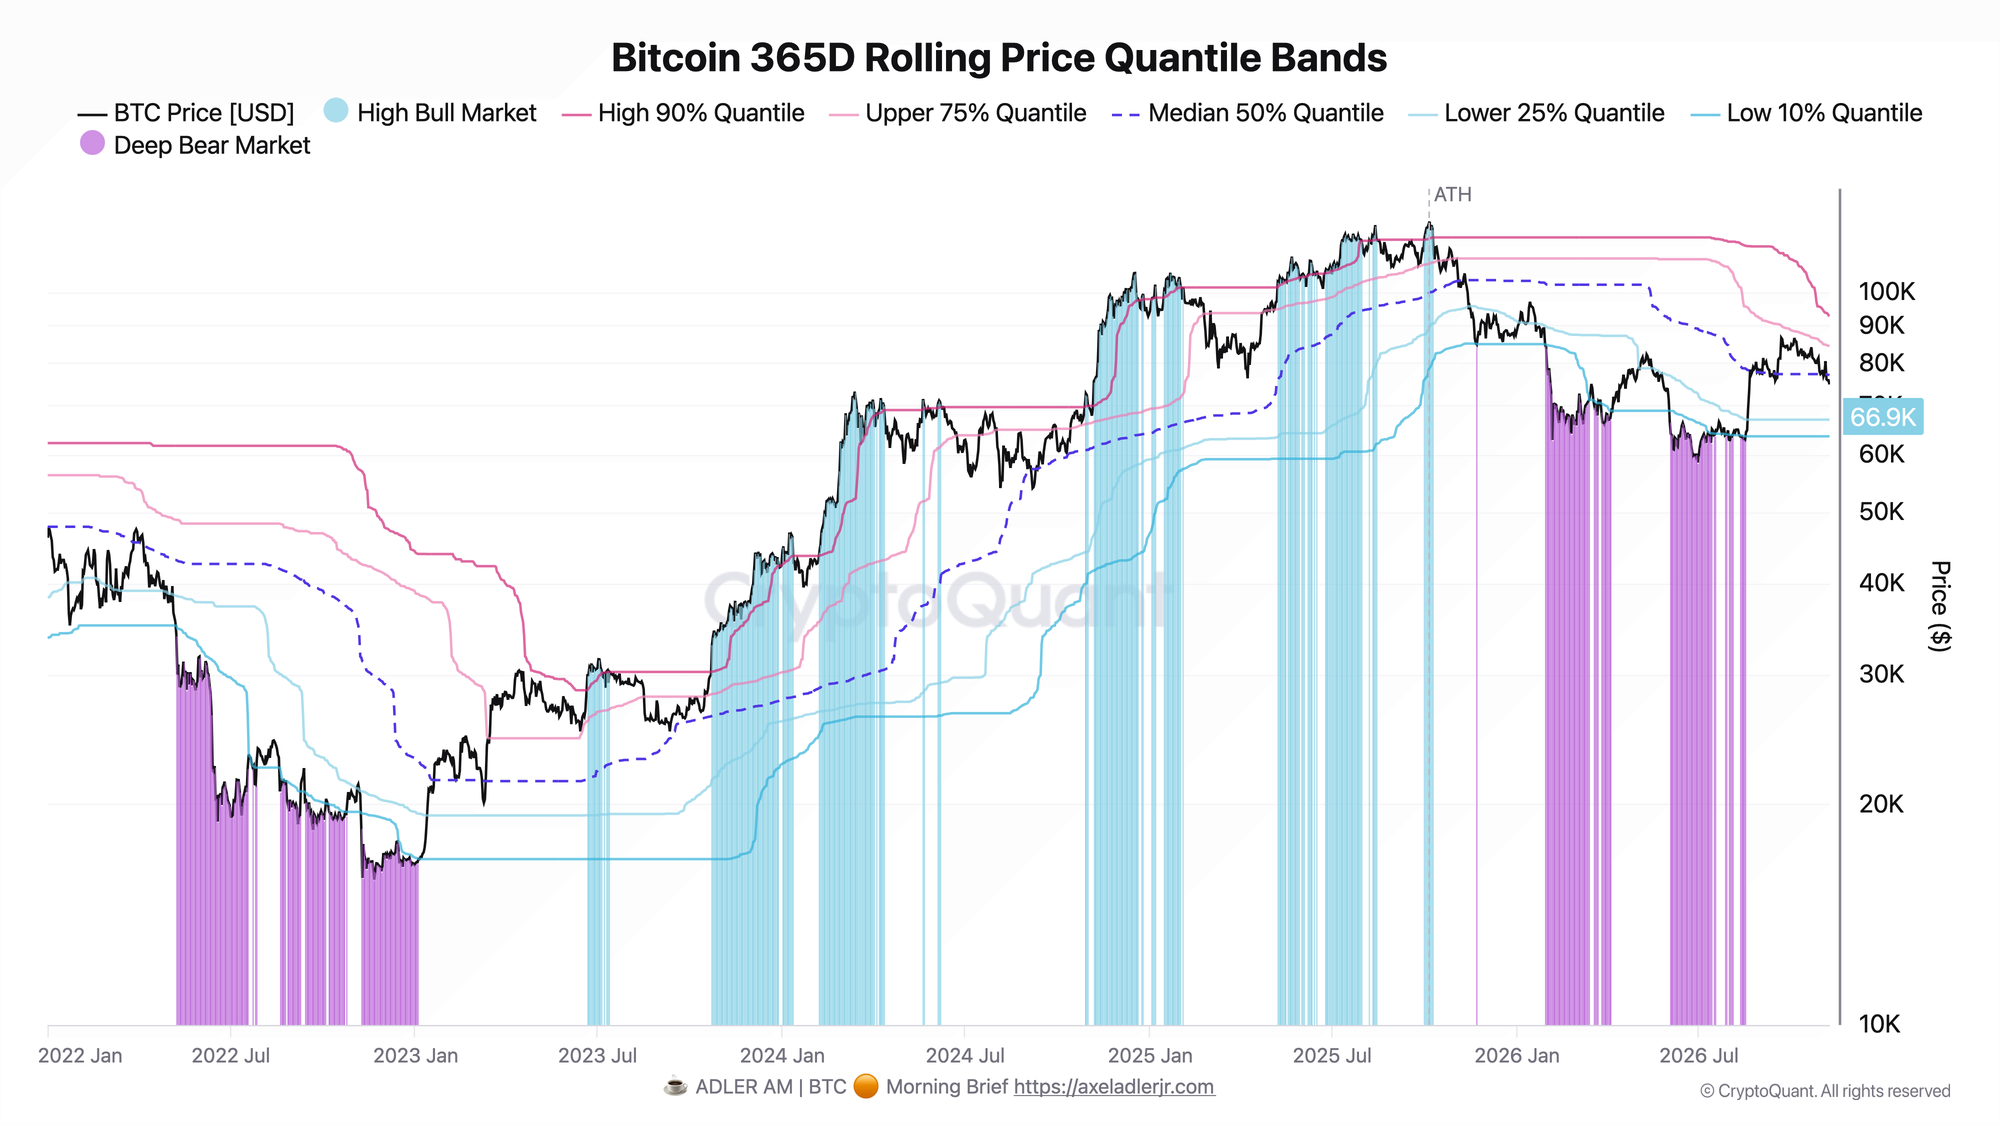
From November 1 to 8, price fell from $78K to $74K (-4.4%). Since November 5, it has remained below the median for the past 365 days, which stands at $77K.
Price is trapped between $77K and the 25th percentile at $67K. A move back above the median would be the first sign of improving market conditions.
Bitcoin Adjusted MVRV
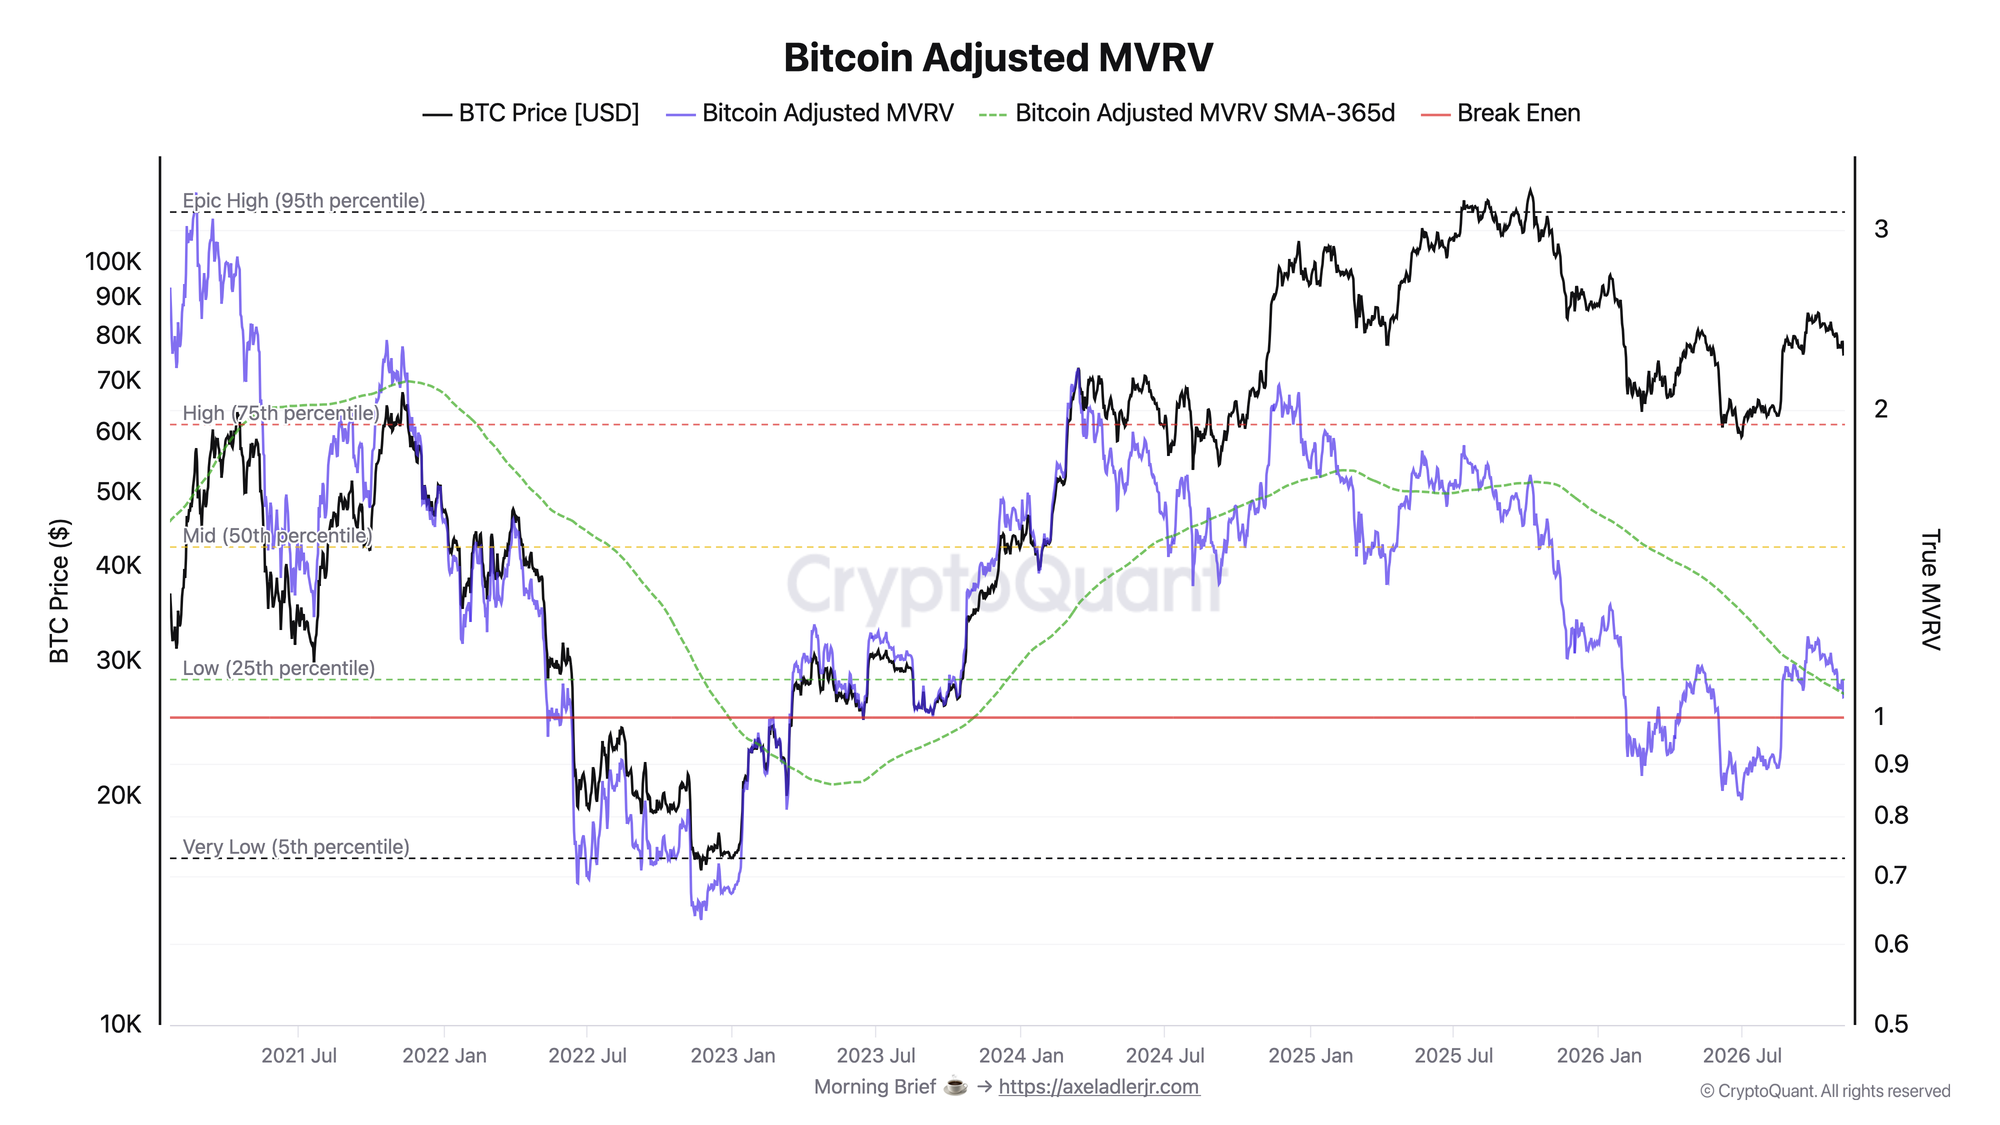
Over the same week, Adjusted MVRV fell from 1.075 to 1.047. For coins younger than seven years, this means the average premium over their on-chain cost basis narrowed from 7.5% to 4.7%.
Since November 6, the metric has been below its SMA-365, which stood at 1.054 on November 8. As long as MVRV remains above 1, this cohort retains an unrealized profit. A drop below 1 would mean an unrealized loss.
FAQ
Does this already mean the bull cycle is over?
Falling below the median and MVRV moving below its one-year average point to a weaker market, but do not confirm that the cycle is over.
Is the lower quartile at $67K now a downside target?
It is a boundary in the distribution of past prices and does not determine where price will go next.
Conclusions
Price remains below the $75.5K-$76K support range, so a short-term recovery has not materialized. The key question this week is whether Bitcoin can reclaim $77K and Adjusted MVRV can move back above its one-year average. Until that happens, the risk of further declines remains.
Live Charts
Explore the metrics behind this brief with live, auto-updating charts:
Valuation Models — All valuation and cost-basis model charts in one view.
MVRV Ratio — Market value vs realized value to identify valuation regimes and cycle risk.
NUPL — Net unrealized profit/loss across holders, mapped into cycle sentiment phases.
RHODL Ratio — Ratio of younger to older HODL bands to flag cycle tops and overheated demand.
Your call is in. See how the on-chain data reads it every Monday →