
Bitcoin derivatives now account for over 75% of total crypto trading volume. Understanding two core metrics - Open Interest (OI) and Estimated Leverage Ratio (ELR) - separates informed market participants from those trading blind. This guide covers how both metrics are calculated, what their values actually tell you, and how to use them together as a risk-management framework across Bitcoin market cycles.
Last updated: March 22, 2026
Current OI & Leverage Ratio
| Open Interest (All Exchanges) | $21.3B |
| 30-Day OI Change | -1.9% |
| Estimated Leverage Ratio | 0.223 |
| Risk Zone | 🟢 Low leverage (<0.35) — deleveraged market, low liquidation risk |
Updated March 22, 2026 · Want daily derivatives risk signals? Join Adler AM
TL;DR
- Open Interest measures the total USD value of all outstanding Bitcoin futures and perpetual contracts across exchanges.
- Estimated Leverage Ratio = Open Interest ÷ Exchange Reserve - it shows how much leverage traders use on average relative to the actual Bitcoin deposited on exchanges.
- High OI + High ELR = elevated liquidation risk. Small price moves can cascade into forced closures.
- Best use case: volatility forecasting and risk-regime detection, not directional prediction.
- Main limitation: OI is denominated in USD, so it inflates mechanically when BTC price rises. ELR depends on exchange reserve accuracy.
- Combine with: Funding Rate, Liquidations, Long/Short Ratio, and on-chain exchange flow data.
Table of Contents
- What Is Bitcoin Open Interest?
- What Is the Estimated Leverage Ratio?
- How Open Interest Is Calculated
- How the Estimated Leverage Ratio Is Calculated
- How to Interpret Open Interest Values
- How to Interpret Estimated Leverage Ratio Values
- OI × ELR: The Combined Derivatives Risk Framework
- Historical Cycle Examples
- Practical Application: Derivatives Risk Playbook
- Open Interest vs. Leverage Ratio vs. Funding Rate
- How These Metrics Relate to Other Indicators
- Limitations
- FAQ
- Conclusion
What Is Bitcoin Open Interest?
Open Interest (OI) is the total number of outstanding derivative contracts - futures and perpetual swaps - that have not been settled or closed. Every open position, whether long or short, adds to OI. When a new buyer and a new seller create a contract, OI increases by one unit. When an existing long closes against an existing short, OI decreases.
In one line: Open Interest measures the total amount of money committed to Bitcoin derivative positions at any given moment.
Unlike trading volume, which counts every transaction (including intraday round-trips), OI captures only positions that remain open. This makes it a better gauge of actual capital deployment and market conviction. A market with $20 billion in OI and $5 billion in daily volume behaves very differently from a market with $5 billion in OI and $20 billion in daily volume - the first has deep structural positioning, while the second has high turnover but little committed capital.
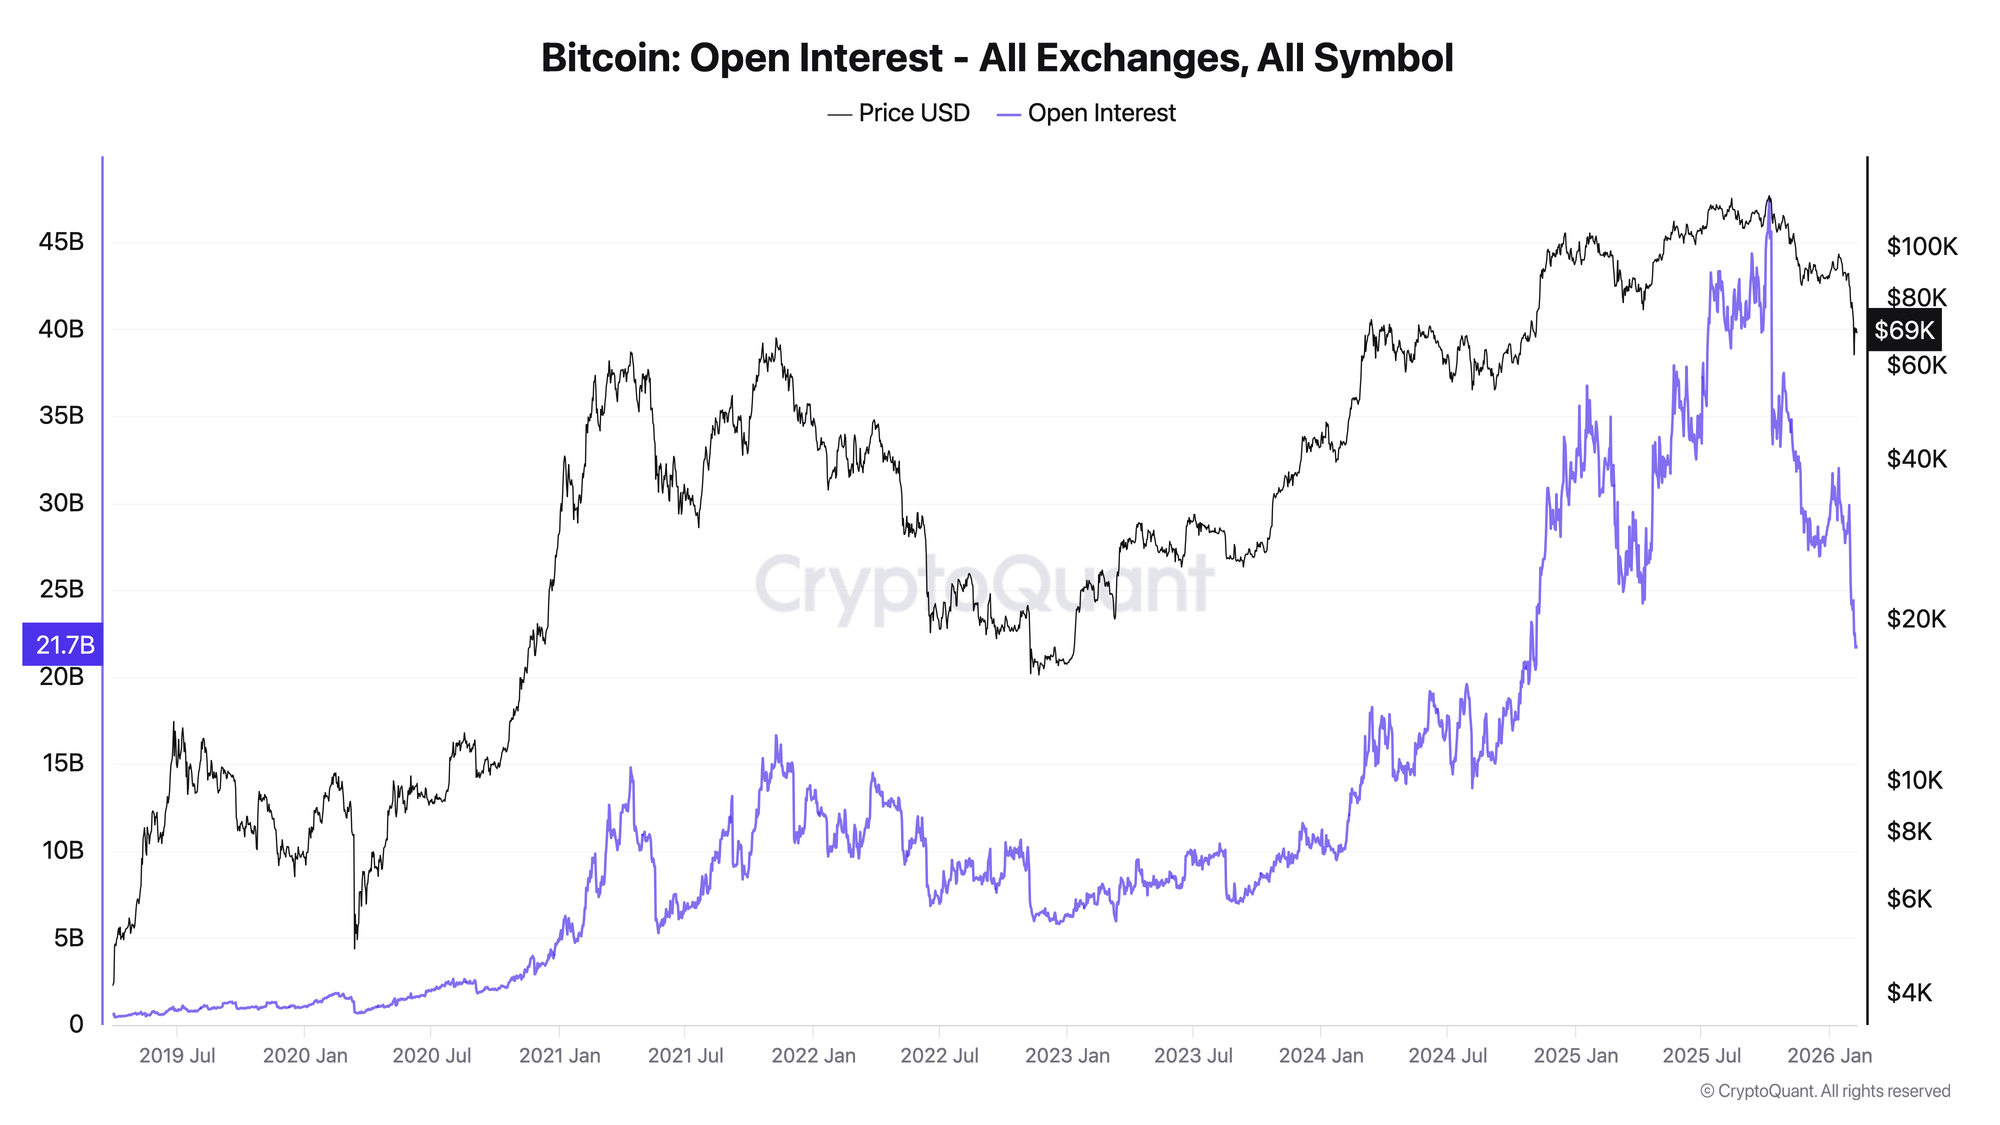
As of February 2026, Bitcoin aggregate OI across all exchanges stands at approximately $21.7 billion. The all-time high was reached on October 6, 2025, at $47.6 billion when BTC traded near $124,600.
Formula
Open Interest is typically reported in two ways:
Notional OI (USD):
OI (USD) = Σ (All Open Contracts × Contract Value in USD)
Coin-margined OI (BTC):
OI (BTC) = Σ (All Open Contracts × Contract Value in BTC)
Where:
- Open Contracts - every active long/short pair that has not been closed, liquidated, or expired.
- Contract Value - depends on the exchange; typically 1 USD per contract (inverse perpetuals) or a fraction of 1 BTC (linear perpetuals).
- Aggregated OI - combines coin-margined and stablecoin-margined contracts, converted to a single denomination (usually USD notional).
Important nuance: USD-denominated OI inflates mechanically when BTC price rises, even if no new positions are opened. A trader holding 1 BTC worth of contracts at $60,000 shows $60,000 in OI; the same position at $100,000 shows $100,000 - a 67% OI increase with zero change in positioning. Always cross-reference OI in BTC terms.
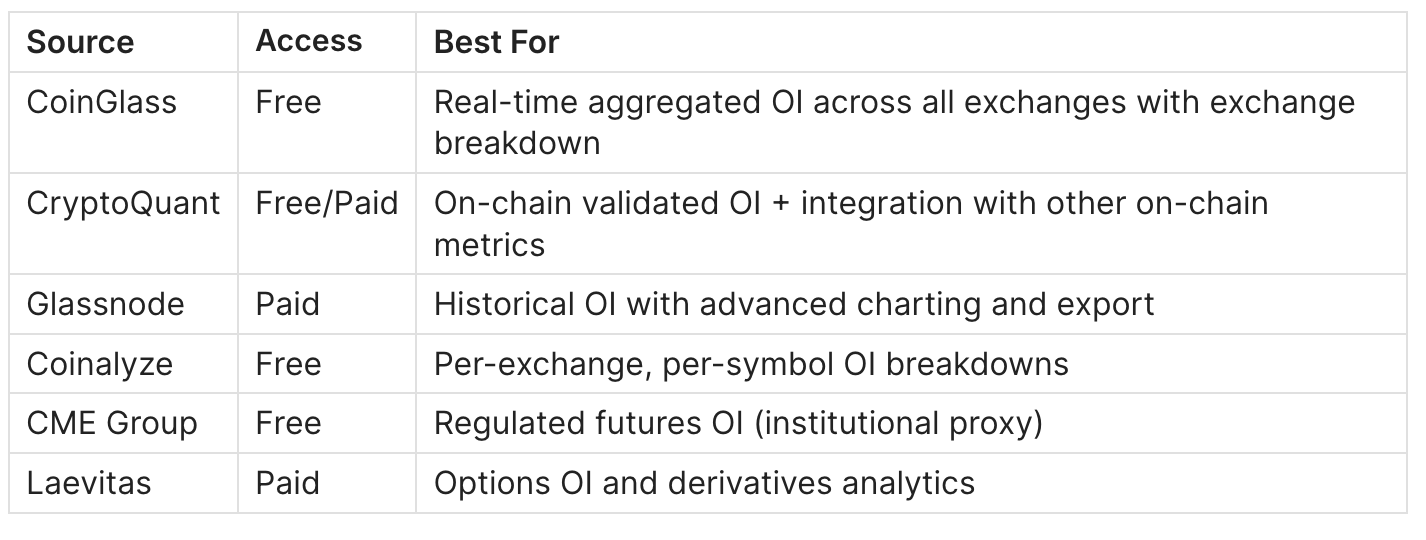
Data Sources
What Is the Estimated Leverage Ratio?
The Estimated Leverage Ratio (ELR) is an on-chain metric that measures the average amount of leverage being used across all derivative exchanges. It is calculated by dividing the total Open Interest by the total Bitcoin reserve held on those exchanges.
In one line: ELR tells you how many dollars of derivative exposure exist for every dollar of actual Bitcoin deposited as collateral.
This is the metric that separates "the market is active" (which OI alone tells you) from "the market is dangerously overleveraged" (which requires knowing how much actual collateral backs those positions).
An ELR of 0.40 means that for every 1 BTC deposited on derivative exchanges, there are 0.40 BTC worth of open contracts. An ELR of 0.70 means the ratio of exposure to collateral has nearly doubled - the same pool of collateral is supporting significantly more positions.
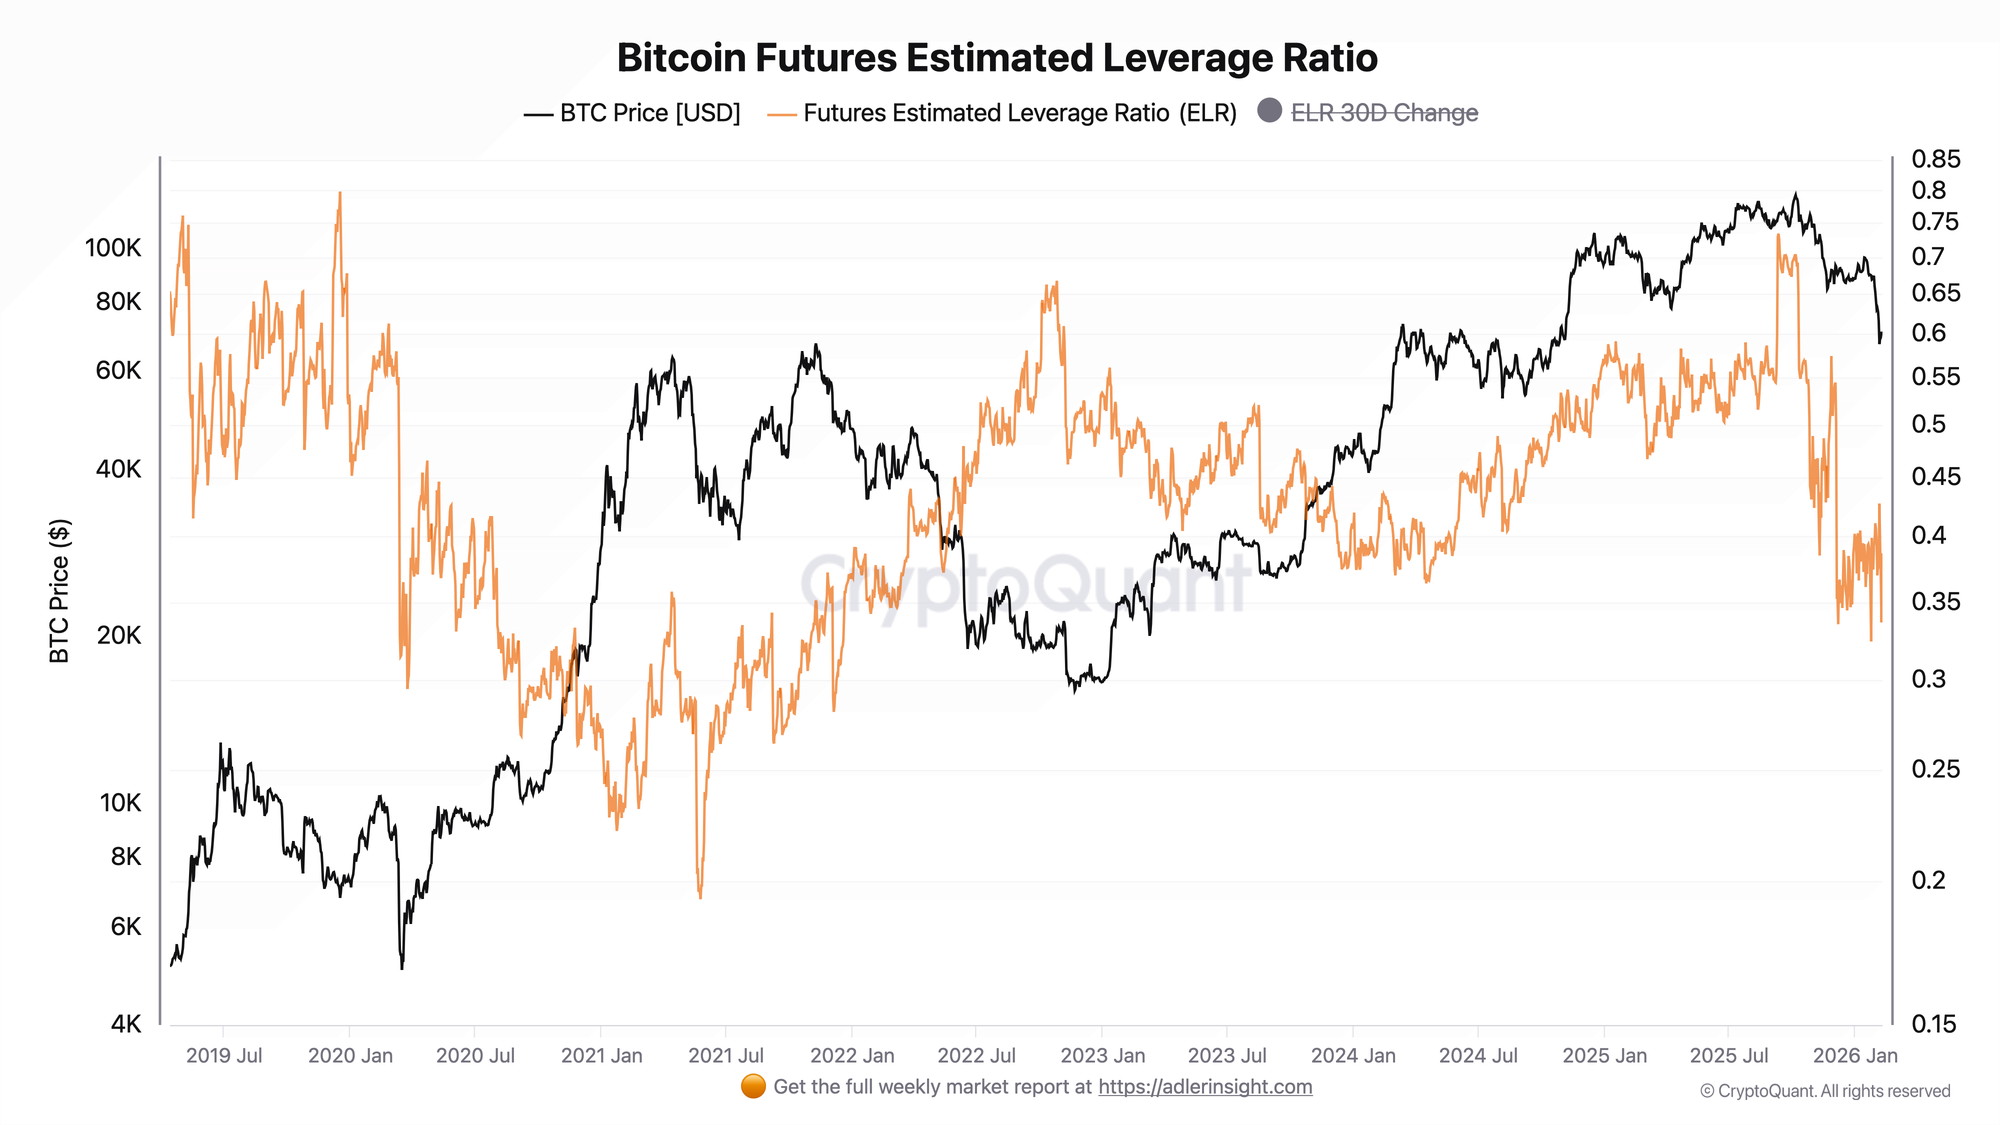
As of February 2026, the all-exchanges ELR stands at approximately 0.386. The historical median since 2019 is 0.44, and the metric has ranged from a low of 0.19 (May 2021, post-crash deleveraging) to above 0.90 (early 2019, nascent market with low reserves).
Formula
Estimated Leverage Ratio = Open Interest (USD) ÷ Exchange Reserve (USD)
Where:
- Open Interest (USD) - aggregate futures + perpetuals OI across all derivative exchanges.
- Exchange Reserve (USD) - total BTC held in wallets associated with derivative exchanges, converted to USD at current spot price.
Both numerator and denominator are denominated in USD, so BTC price movements affect both proportionally - making ELR relatively price-neutral compared to raw OI.
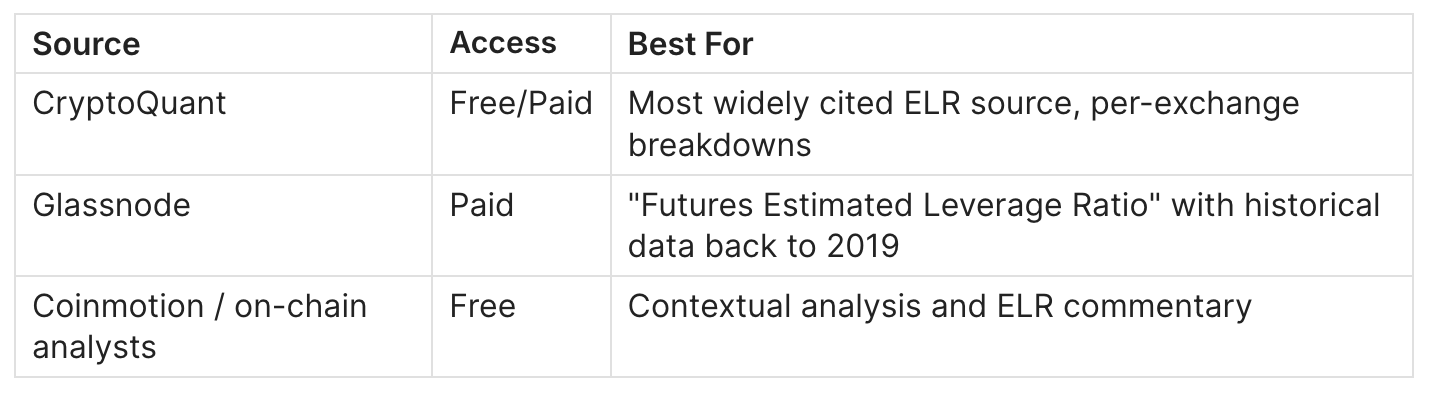
Data Sources
How Open Interest Is Calculated
Step 1: Collect Contract Data from Each Exchange
Every derivative exchange (Binance, Bybit, OKX, CME, Deribit, etc.) reports the number of open contracts for each trading pair. Contracts are denominated either in USD (linear/USDT-margined) or BTC (inverse/coin-margined).
Step 2: Convert to a Common Denomination
Coin-margined OI must be converted to USD using the current spot or mark price:
OI_exchange (USD) = OI_linear (USD) + OI_inverse (BTC) × BTC Price
Step 3: Aggregate Across All Exchanges
OI_total = Σ OI_exchange (USD) for all exchanges
Example with numbers:
Suppose the market has three exchanges:
- Binance: 120,000 BTC in linear perpetuals × $70,000 = $8.4B
- Bybit: 50,000 BTC in inverse perpetuals × $70,000 = $3.5B
- CME: $2.0B in regulated futures
Total OI = $8.4B + $3.5B + $2.0B = $13.9B
If BTC rises to $80,000 with no position changes:
- Binance: 120,000 BTC × $80,000 = $9.6B (+$1.2B)
- Bybit: 50,000 BTC × $80,000 = $4.0B (+$0.5B)
- CME: $2.0B (unchanged - dollar-denominated)
New Total OI = $15.6B - a 12% increase from price alone.
Process Flow
Exchange A ─── OI (linear, USD) ───────────────────┐
Exchange B ─── OI (inverse, BTC) × Price ──────────┤
Exchange C ─── OI (linear, USD) ───────────────────┤
Exchange D ─── OI (inverse, BTC) × Price ──────────┤──► Σ = Aggregate OI (USD)
Exchange E ─── OI (futures, USD) ──────────────────┘

Data providers (CoinGlass, CryptoQuant, Glassnode) run this pipeline
every 1-60 minutes depending on subscription tier.
How the Estimated Leverage Ratio Is Calculated
Step 1: Obtain Aggregate Open Interest
Use the total OI figure from the calculation above.
Step 2: Calculate Derivative Exchange Reserve
Sum all BTC held in known wallets of derivative exchanges. This is determined through on-chain analysis - data providers like CryptoQuant and Glassnode maintain labeled address databases.
Exchange Reserve (USD) = Σ BTC_balance_per_exchange × BTC Price
Step 3: Divide
ELR = OI (USD) ÷ Exchange Reserve (USD)
Example with numbers:
- Aggregate OI: $21.7B
- Total BTC on derivative exchanges: 800,000 BTC
- BTC Price: $70,000
- Exchange Reserve: 800,000 × $70,000 = $56.0B
ELR = $21.7B ÷ $56.0B = 0.387
This means there are roughly $0.39 in open derivative contracts for every $1 of BTC collateral on exchanges.
What changes the ELR:
How to Interpret Open Interest Values
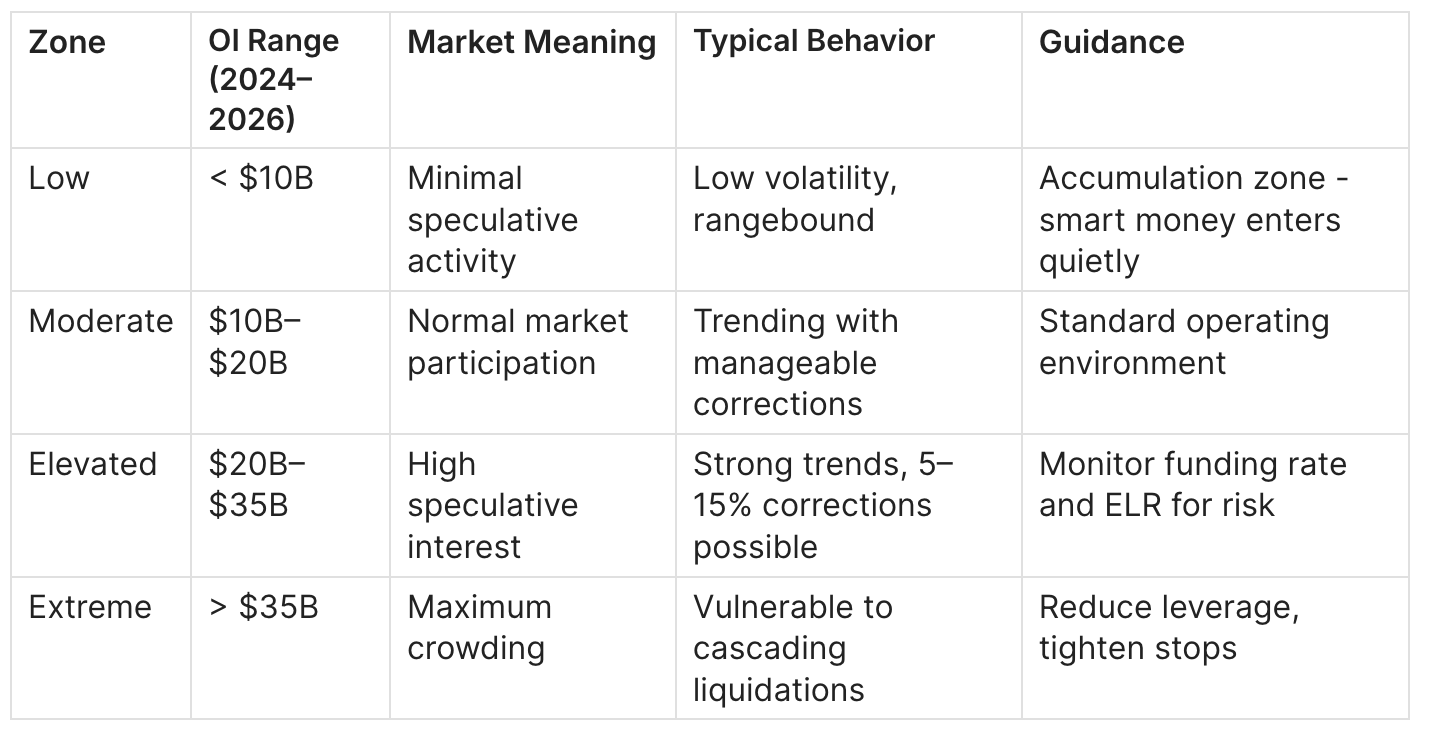
Zone Table
OI Rising With Price (Bullish Confirmation)
When OI increases alongside rising BTC price, it signals new capital entering long positions. This is the classic "healthy uptrend" pattern - fresh money is backing the move, not just recycled positions. The April 2021 rally from $30K to $64K saw OI climb from $6B to $14.4B, confirming genuine buying pressure.
However, this can overshoot. When OI climbs too fast relative to price, the market becomes a tinderbox. Any reversal forces over-leveraged longs to close, creating a cascade.
Typical mistake: Assuming rising OI always means "bullish." Rising OI during a downtrend means new shorts are piling in - equally dangerous in the other direction.
OI Rising While Price Drops (Short Buildup)
This divergence signals aggressive short positioning. Traders are opening new bearish bets as price falls. While it can indicate further downside, extreme short OI buildup also sets up short squeezes. The May 2021 crash and subsequent July recovery demonstrated this: OI fell sharply in the crash (from $14.4B to $5.6B), then rebuilt during consolidation, eventually fueling the next leg up.
OI Dropping Sharply (Deleveraging Event)
A sudden OI decline of 20%+ within 24–48 hours is a deleveraging event - either a long squeeze (price drops, longs liquidated) or a short squeeze (price rises, shorts liquidated). These events often mark local extremes. The March 2020 COVID crash saw OI drop from $4.1B to under $700M in days as the entire derivatives market was wiped clean.
Key Level: CME OI
CME open interest serves as an institutional participation proxy. Rising CME OI while offshore exchange OI is flat or declining suggests institutional accumulation that may not be reflected in retail-dominated metrics.
How to Interpret Estimated Leverage Ratio Values
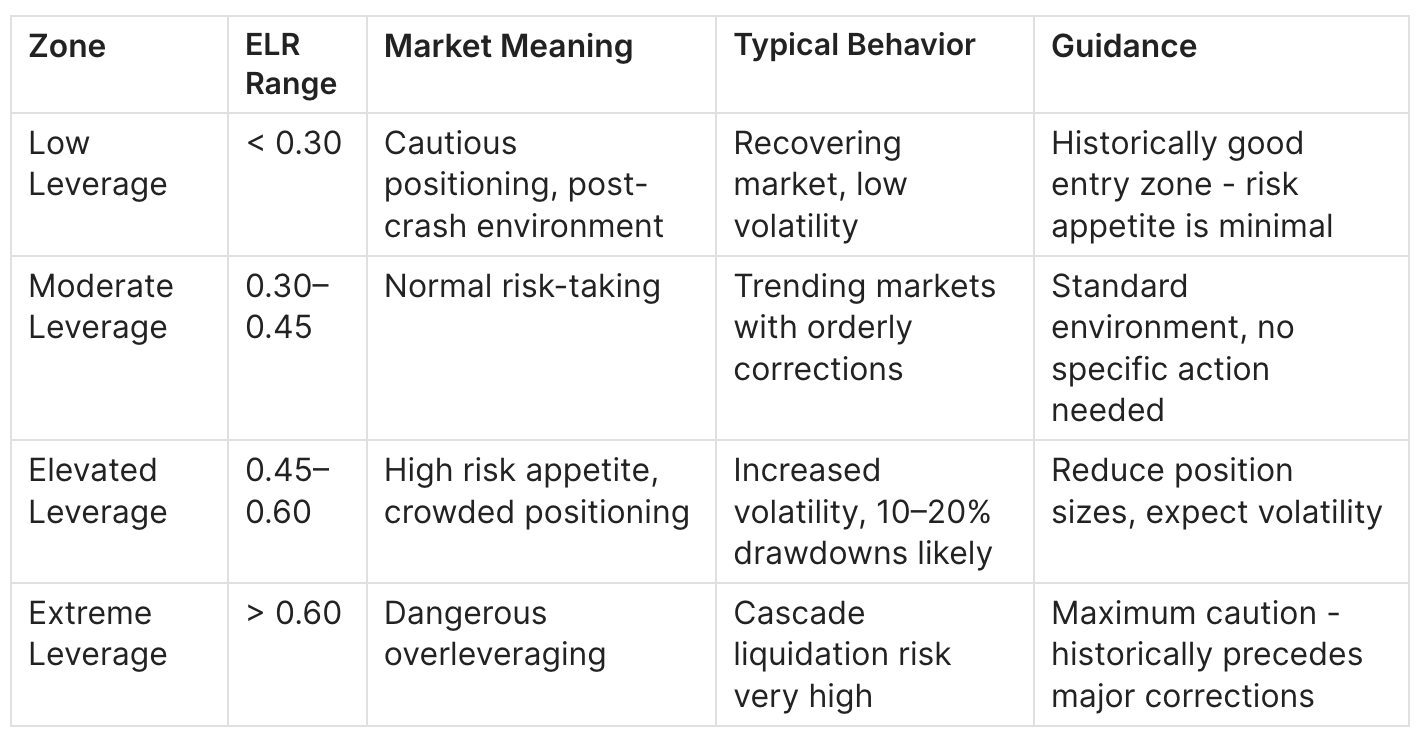
Zone Table
ELR > 0.50 (High-Risk Zone)
When ELR exceeds 0.50, the market is in a structurally fragile state. The amount of derivative exposure relative to actual collateral means that even moderate price swings (5–8%) can trigger a cascade of liquidations.
Data evidence: In November 2024, as BTC surged post-Trump election, ELR hit 0.53. By December 2024 at the cycle ATH near $106,000, ELR reached 0.54. By January 2025 it climbed to 0.57 - and the subsequent correction from $105K to the $70K range played out over the following months as leveraged positions were unwound.
The October 2025 max-OI event ($47.6B, BTC at $124,600) coincided with ELR of 0.70 - the highest post-2019 reading - and preceded a correction to the $70K zone.
Typical mistake: Assuming high ELR means "imminent crash." ELR can remain elevated for weeks during sustained bull trends. It's a risk indicator, not a timing tool.
ELR < 0.30 (Low-Risk Zone)
Low ELR readings indicate traders have pulled back leverage significantly, usually after a major liquidation event. This environment tends to be low-volatility and often marks accumulation phases.
Data evidence: After the May 2021 crash, ELR hit its all-time low of 0.193 on May 25, 2021, with BTC at $38,164. This extreme deleveraging event cleared the market of weak hands and set the stage for the rally to the November 2021 ATH at $66,413.
ELR Trending Up While Price Trends Down (Bearish Divergence)
This is one of the most dangerous patterns in derivatives analysis. Rising leverage during a price decline means traders are aggressively "buying the dip" with borrowed money. If the decline continues, these leveraged longs get liquidated, accelerating the downtrend.
The Luna/FTX period (mid-2022) showed ELR rising from 0.35 to 0.50 even as BTC fell from $30K to $17K - leveraged traders kept doubling down all the way to the bottom.
30-Day ELR Change (Momentum Signal)
The ELR 30-day change provides a velocity reading:
- Positive 30d change > +15%: Rapid leverage buildup - yellow flag for corrections.
- Negative 30d change < -10%: Active deleveraging - risk is being removed from the system.
- Near zero: Stable leverage environment - trend continuation more likely.
OI × ELR: The Combined Derivatives Risk Framework
Neither OI nor ELR alone tells the full story. Their combination creates a four-quadrant risk matrix:
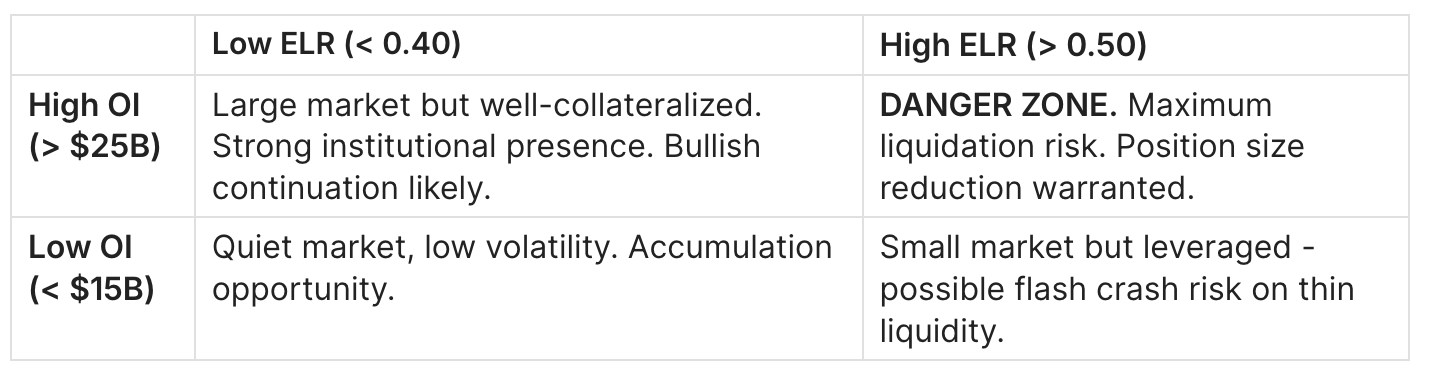
The most dangerous quadrant is High OI + High ELR. This is when the maximum amount of capital ($25B+) is backed by the minimum amount of collateral (ELR > 0.50). The October 2025 peak ($47.6B OI, 0.70 ELR) exemplified this - the subsequent unwind took OI back to $22B within months.
The best entry signal historically comes from Low OI + Low ELR: the market has been cleaned of excess leverage, weak hands have exited, and fresh capital has room to enter. May 2021 (ELR 0.19, OI $5.6B) and post-FTX December 2022 (ELR 0.53, OI $6.4B) both preceded multi-month rallies - though the FTX case shows ELR was still elevated even at that low point due to depleted exchange reserves.
Historical Cycle Examples
Example 1: April 2021 Peak - Leverage Overshoot
Situation: BTC rallied from $10K in October 2020 to a new ATH of $64K in April 2021, fueled by institutional adoption (MicroStrategy, Tesla, Coinbase IPO).
OI behavior: Climbed steadily from $4B (Oct 2020) to $14.4B (Apr 14, 2021) - a 260% increase.
ELR behavior: Rose from 0.24 (Jan 2021) to 0.35 (Apr 2021), indicating leverage was increasing but not yet extreme by historical standards.
Price behavior: After the April 14 ATH at $63,566, BTC crashed 53% to $29K by July 2021.
Conclusion: OI at $14.4B was an all-time high at the time. The combination of record OI with rising ELR created the conditions for the May 19 crash, where OI was slashed from $14B to $6B in days. ELR bottomed at 0.19 - the all-time low - as the market completely deleveraged.
Example 2: November 2022 FTX Collapse - Reserve Destruction
Situation: FTX, the third-largest exchange, collapsed in November 2022, destroying customer deposits and exchange reserves.
OI behavior: OI dropped from ~$8B to $6.8B - a moderate decline because most OI was on surviving exchanges.
ELR behavior: ELR actually spiked to 0.50 despite lower OI because exchange reserves were decimated (BTC withdrawn en masse from all exchanges as trust collapsed). With the denominator (reserves) falling faster than the numerator (OI), ELR rose.
Price behavior: BTC fell from $21K to $15.5K, then stabilized near $16.5K for two months.
Conclusion: This event demonstrates why ELR is more nuanced than raw OI. OI declined, which normally suggests deleveraging. But the reserve outflow made the remaining positions effectively more leveraged. ELR correctly signaled elevated risk even as OI dropped.
Example 3: January 2024 ETF Approval - Structural Shift
Situation: The SEC approved spot Bitcoin ETFs on January 10, 2024, marking a regime shift in how institutional capital could access Bitcoin.
OI behavior: OI was at $10.3B at approval, then surged to $18.3B by March 2024 as BTC rallied to $71.7K.
ELR behavior: ELR rose from 0.37 (Jan 2024) to 0.41 (Mar 2024) - a controlled increase suggesting the OI growth was backed by proportional reserve growth. Institutions were depositing collateral alongside opening positions.
Price behavior: BTC rallied 55% from $46K to $71.7K in two months, then consolidated for months before the next leg.
Conclusion: Healthy OI growth with moderate ELR increase is the "good" version of derivative expansion. The ETF era introduced structural buyers who use leverage differently from retail perpetual traders - lower leverage, longer timeframes.
Example 4: October 2025 Peak - ETF-Era Excess
Situation: BTC reached $124,600 in October 2025 following sustained institutional inflows and post-election policy optimism.
OI behavior: Set the all-time high at $47.6B - more than triple the 2021 cycle peak.
ELR behavior: ELR reached 0.70 - the highest reading of the post-2019 era (excluding early low-reserve periods).
Price behavior: BTC subsequently corrected from $124.6K to the low-$70K range by early February 2026.
Conclusion: Despite the structural maturation of Bitcoin's market, the OI + ELR dynamic played out identically to prior cycles: extreme leverage accumulation, followed by a sharp unwind. The absolute numbers were larger (OI peak 3× higher than 2021), but the ELR pattern was the same. This confirms OI and ELR remain relevant risk signals even in the ETF era.
Practical Application: Derivatives Risk Playbook
Accumulation / Low-Risk Entry Conditions
- Signal: ELR < 0.35 AND OI 30-day change negative (market recently deleveraged).
- Confirmations: Funding rate near zero or slightly negative (no crowded longs). Exchange inflows declining (no panic selling). BTC holding above key support.
- Common traps: ELR can stay low during prolonged bear markets (2022 Q3–Q4 consolidation). Low leverage ≠ guaranteed bottom. Requires spot market confirmation.
- Risk guidance: This is a "de-risked" environment. Position sizing can be more aggressive than during High-ELR regimes. Dollar-cost averaging is mechanically effective here.
Risk-Off / Distribution Conditions
- Signal: ELR > 0.55 AND OI at or near 90-day high AND 30-day ELR change > +15%.
- Confirmations: Funding rate persistently above 0.01% per 8h (longs paying premium). Liquidation volumes increasing even on moderate dips. Divergence between OI growth and price momentum.
- Common traps: High ELR can persist for weeks in a strong trend. Exiting too early costs more than a 10% correction in a secular bull market. Use time-stops, not just level-stops.
- Risk guidance: Reduce leveraged positions. Move stop-losses to breakeven. Consider hedging with put options if available. This is not a sell signal - it's a "reduce risk" signal.
Neutral / Wait Conditions
- Signal: ELR between 0.35–0.50 AND OI stable (±5% over 30 days).
- Confirmations: Funding rate oscillating around zero. No divergence between OI and price direction. Liquidation volumes normal.
- Risk guidance: Standard positioning. No excess risk in either direction. Focus on spot market and on-chain signals for directional bias.
Open Interest vs. Leverage Ratio vs. Funding Rate
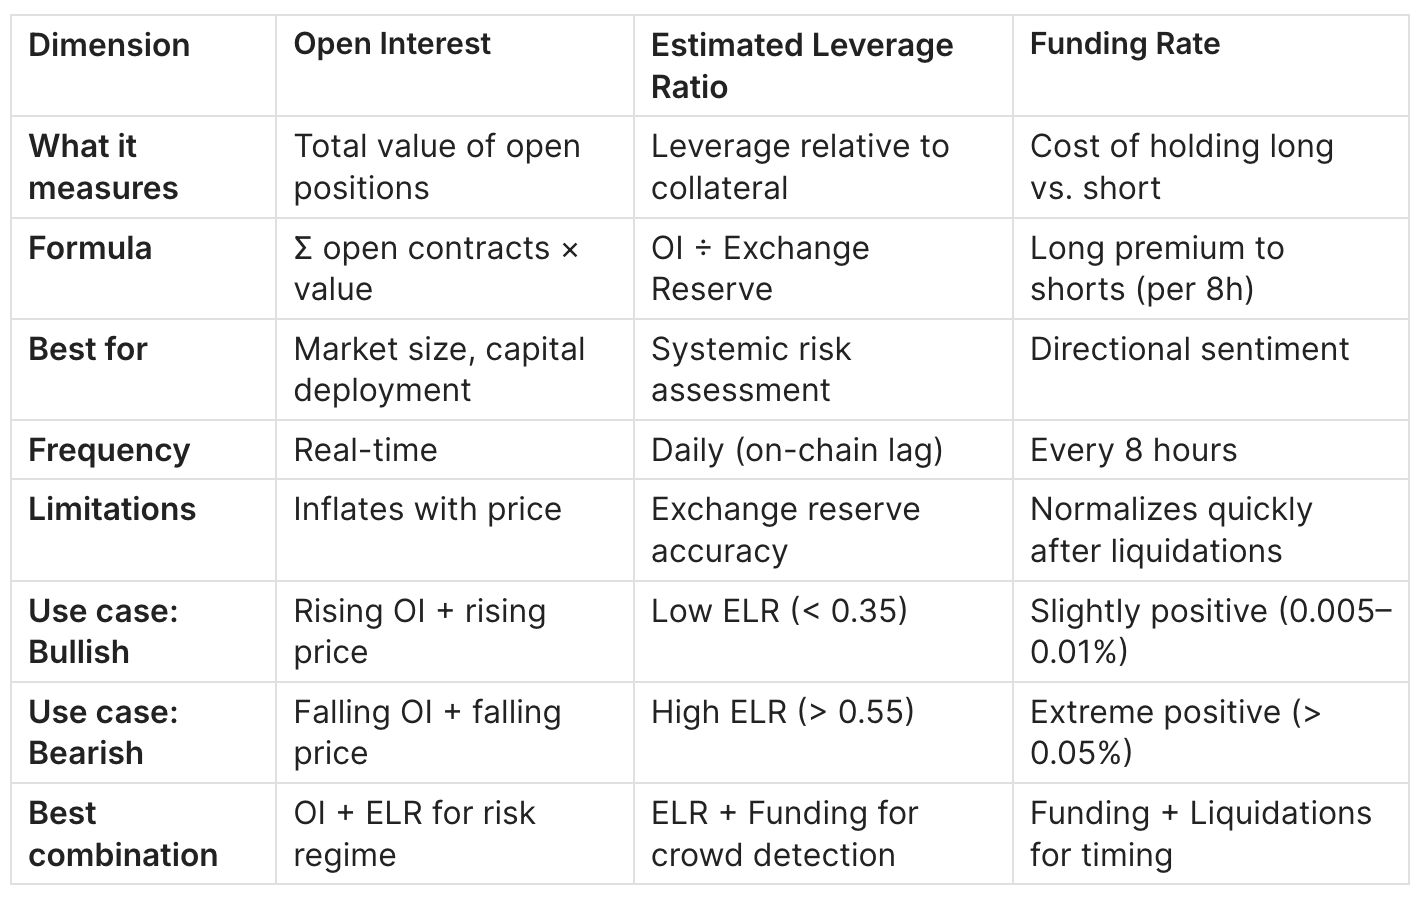
When to use which:
- "Is the market getting bigger or smaller?" → Open Interest.
- "Is the market dangerously leveraged?" → Estimated Leverage Ratio.
- "Are longs or shorts paying up?" → Funding Rate.
- "Is a liquidation cascade likely?" → All three combined.
Combined Analysis: The Derivatives Pressure Index
A simple framework combining all three:
- Score OI: +1 if above 90-day average, -1 if below.
- Score ELR: +1 if above 0.50, -1 if below 0.35, 0 if between.
- Score Funding: +1 if above 0.03%, -1 if below -0.01%, 0 if between.
Combined Score:
- +3: Maximum liquidation risk (all metrics flashing overheated).
- +1 to +2: Elevated but manageable risk.
- -1 to 0: Neutral.
- -2 to -3: Maximum opportunity (market is deleveraged).
How These Metrics Relate to Other Indicators
OI → Liquidation Volume
High OI + Sudden Price Move = High Liquidation Volume
Liquidations are the mechanism through which OI decreases during disorderly moves. When OI is $40B+ and BTC drops 5%, liquidation volumes can exceed $1B in hours. At $10B OI, the same percentage move produces proportionally smaller liquidation cascades.
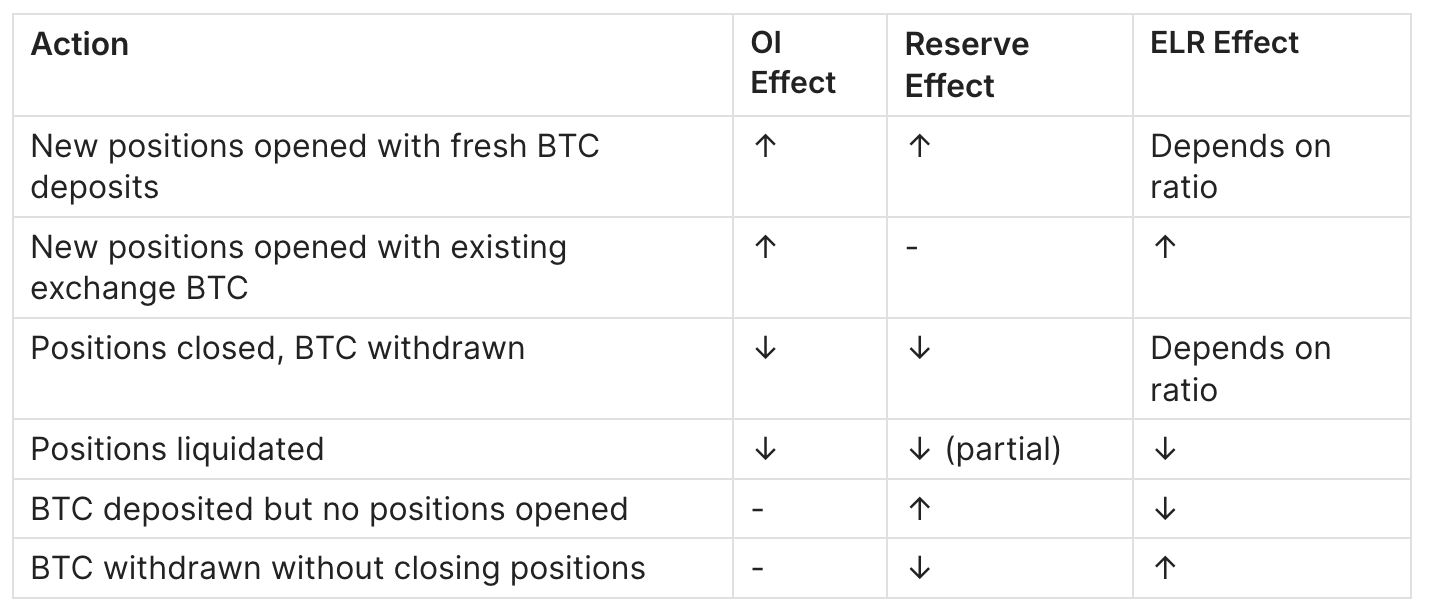
ELR → Exchange Reserve → On-Chain Flows
ELR = OI ÷ Reserve
Reserve ↓ (withdrawals) → ELR ↑ even if OI is flat
Exchange reserve outflows post-FTX were the primary driver of ELR elevation in late 2022. Monitoring netflow to derivative exchanges provides a leading signal for ELR changes.
OI × Price = Effective Leverage
For coin-margined contracts:
Effective Position Leverage = OI (BTC) × Price ÷ Margin Deposited
As BTC price rises, coin-margined positions become worth more in USD terms, increasing the effective leverage of existing positions without any new contracts being opened.
ELR ↔ MVRV Relationship
When MVRV (Market Value to Realized Value) is above 3.0 and ELR is above 0.50, the combination has historically preceded 20%+ corrections within 30 days. Both metrics independently signal overheating - MVRV from the spot/on-chain side, ELR from the derivatives side.
Limitations
1. USD-denominated OI inflates with price
When it fails: In bull markets, OI can double solely because BTC price doubled. This creates the illusion of "record speculative activity" when actual positioning (measured in BTC) may be unchanged.
Solution: Always check OI in BTC terms alongside USD terms. CoinGlass and Glassnode provide both denominators.
2. Exchange reserve data is imperfect
When it fails: ELR depends on correctly identifying exchange wallets. If an exchange uses unlabeled cold storage or custodial arrangements, the reserve figure may be understated, making ELR appear higher than reality.
Solution: Cross-reference ELR from multiple data providers (CryptoQuant vs. Glassnode). Focus on ELR trends rather than absolute levels.
3. Aggregation masks exchange-level dynamics
When it fails: Aggregate OI may be stable, but if 70% of it is concentrated on one exchange (e.g., Binance), the liquidation cascade risk is exchange-specific. The FTX collapse showed that exchange-level risk can override aggregate metrics.
Solution: Monitor per-exchange OI breakdown. CoinGlass provides this. Pay special attention to Binance (typically 40–50% of OI) and CME (institutional proxy).
4. ELR is a daily metric with on-chain lag
When it fails: On-chain reserve data updates with block confirmation delays (10–60 minutes). During flash crashes, ELR displayed on dashboards may lag real-time conditions by the time you see the spike, the liquidation event may already be over.
Solution: Use ELR for strategic regime assessment, not tactical entry/exit timing. For timing, use real-time funding rates and liquidation feeds.
5. Does not account for hedged positions
When it fails: OI counts all positions, including those that are perfectly hedged (e.g., cash-and-carry arbitrage, basis trades). A market maker with $1B in long futures hedged by $1B in short spot adds $1B to OI without adding any directional risk. ETF-era basis trading has significantly increased "non-directional" OI.
Solution: No clean solution exists. Proxy: if OI is rising but funding rate stays flat and liquidations are low, a large portion may be hedged/arbitrage OI.
FAQ
What is Bitcoin Open Interest?
Open Interest is the total USD value of all outstanding (unsettled) Bitcoin futures and perpetual swap contracts across all derivative exchanges. It includes both long and short positions.
What is the Estimated Leverage Ratio?
The Estimated Leverage Ratio (ELR) is the ratio of aggregate Open Interest to the total Bitcoin reserve held on derivative exchanges. It measures the average leverage being used across the market.
Where to find current Open Interest data
Free Resources
- CoinGlass – Total BTC Open Interest
- CryptoQuant – BTC Derivatives Hub
- CryptoQuant – BTC Open Interest (Direct Chart)
Paid / Premium Resources
- Glassnode Studio – BTC Derivatives Dashboard (OI & Volume)
- Glassnode Studio – BTC Futures Open Interest (Metric Chart)
- Laevitas – BTC Asset Overview (OI Breakdown)
CME-Specific (Institutional Data)
- CME Group – Bitcoin Futures Volume & Open Interest
- CME Group – Bitcoin Options Volume & Open Interest
- CME Group – Daily Exchange Volume & Open Interest Report
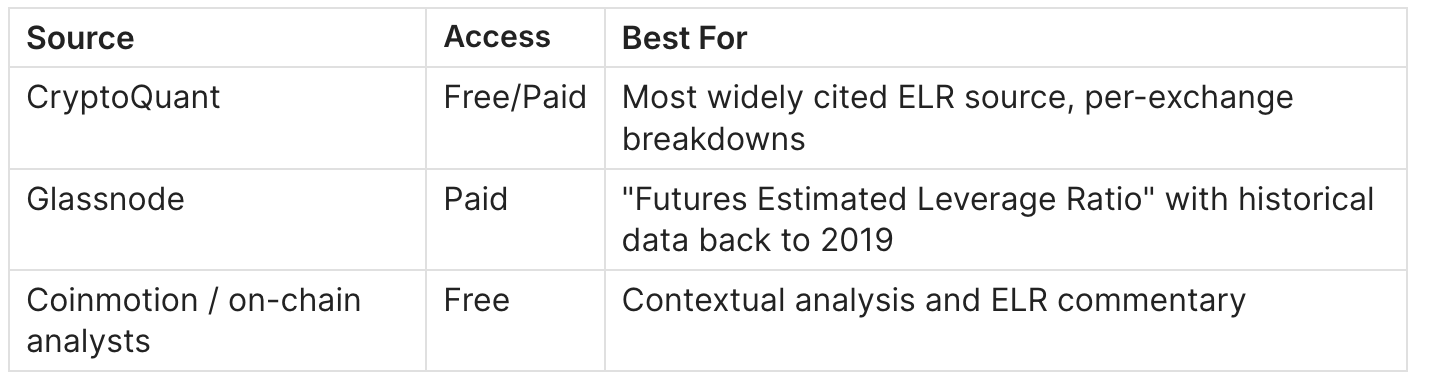
Where can I find ELR data?
CryptoQuant (market-indicator/estimated-leverage-ratio) offers free charting. Glassnode provides historical exports. Both CryptoQuant and Glassnode offer per-exchange breakdowns.
What ELR level is dangerous?
Based on historical data, ELR above 0.55 consistently precedes elevated volatility. Above 0.60, the probability of a 15%+ correction within 30 days increases significantly. The October 2025 peak at 0.70 preceded a 44% correction.
Why does OI increase when BTC price goes up?
USD-denominated OI inflates mechanically because existing BTC-margined contracts are worth more in dollar terms. Always check OI in BTC terms for a cleaner read.
Can OI and ELR be used for altcoins?
Yes, the same framework applies. However, altcoin derivative markets are thinner, which makes extreme OI and ELR readings even more significant. Liquidation cascades in altcoin derivatives tend to be sharper and faster.
How reliable is ELR as a standalone indicator?
Moderately reliable for regime identification, unreliable for timing. ELR correctly signals "dangerous" environments but cannot predict when the liquidation trigger will occur. Combine with funding rate and liquidation data for timing.
What is the difference between OI and trading volume?
Volume counts every contract traded during a period (buys + sells, opens + closes). OI counts only positions that remain open at a given moment. High volume with falling OI = positions are being closed (deleveraging). High volume with rising OI = new positions are being opened (leveraging up).
Why did ELR spike during the FTX crash even though OI dropped?
Exchange reserves (the denominator) fell faster than OI (the numerator). Massive BTC withdrawals from all exchanges after the FTX collapse reduced collateral in the system, making remaining positions effectively more leveraged.
What combinations work best with OI and ELR?
The strongest framework uses OI + ELR + Funding Rate + Liquidation Volume as a four-factor derivatives risk model. For macro-level analysis, adding MVRV and Long-Term Holder supply creates a comprehensive cycle framework.
Is high OI always bearish?
No. High OI is a volatility signal, not a directional signal. High OI during a well-funded, low-ELR environment (like early 2024 post-ETF) supports trend continuation. High OI during a high-ELR environment (like October 2025) signals fragility.
Conclusion
- Open Interest measures the total capital committed to Bitcoin derivatives - it tells you the size of the game, not who is winning.
- Estimated Leverage Ratio measures how much leverage backs those positions - it tells you how fragile the game is.
- Together, they form the core of any derivatives risk framework: High OI + Low ELR = healthy trend; High OI + High ELR = approaching correction risk.
- Historical consistency is strong: every major correction since 2020 was preceded by elevated ELR, and every major rally launched from periods of low ELR post-deleveraging.
- In the ETF era, absolute OI levels are structurally higher due to institutional basis trading, but the ELR pattern remains intact - leverage relative to collateral still governs correction risk.
Adler AM - Free daily morning brief with Bitcoin macro and derivatives snapshot. Subscribe
Adler Insight 💎 Premium The market is noisy and contradictory. Our system converts raw data into a clear weekly action - BUY, HOLD, REDUCE, or EXIT. adlerinsight.com
Combine with:
- Funding Rate Guide - Understanding the cost of leverage in real-time.
- Bitcoin Exchange Flows - On-chain signal for ELR's denominator.
- MVRV Ratio - Spot-market valuation complement to derivatives risk metrics.