



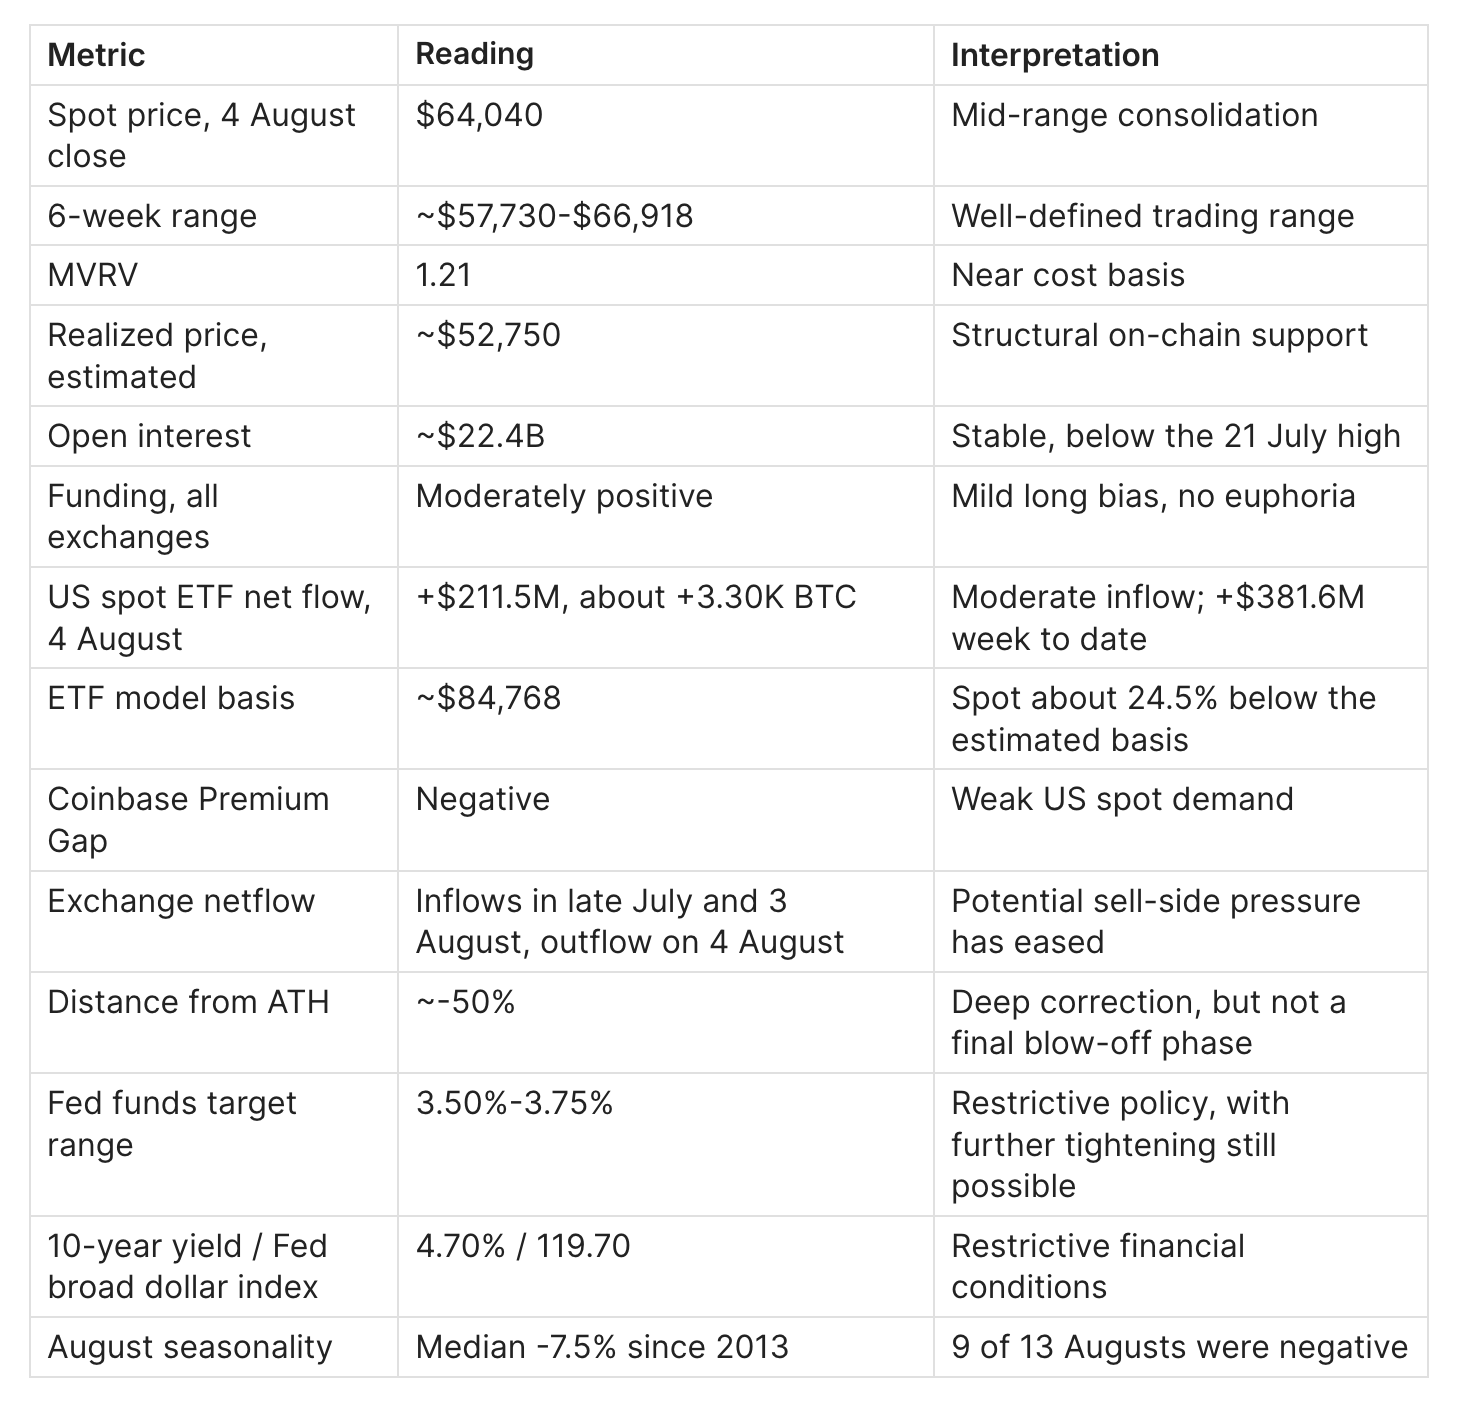
Bitcoin enters August 2026 at $64,040 (4 August spot close, all-exchange aggregate), roughly 50% below the October 2025 cycle high of $126,209. This is the defining feature of the current market: after a year-long correction, price is trading near the aggregate on-chain cost basis, changing how each August scenario should be interpreted. This data-driven outlook covers Bitcoin's multi-year August performance, support and resistance levels, the macro backdrop, on-chain and derivatives market structure, US spot ETF flows, and a scenario-based price forecast. On-chain and flow data come from CryptoQuant and the BTC US ETF Flow Monitor, while macro data come from official US agencies, central banks, and institutional statistical databases as of early August 2026.
Market snapshot as of 5 August 2026
Bitcoin's historical performance in August
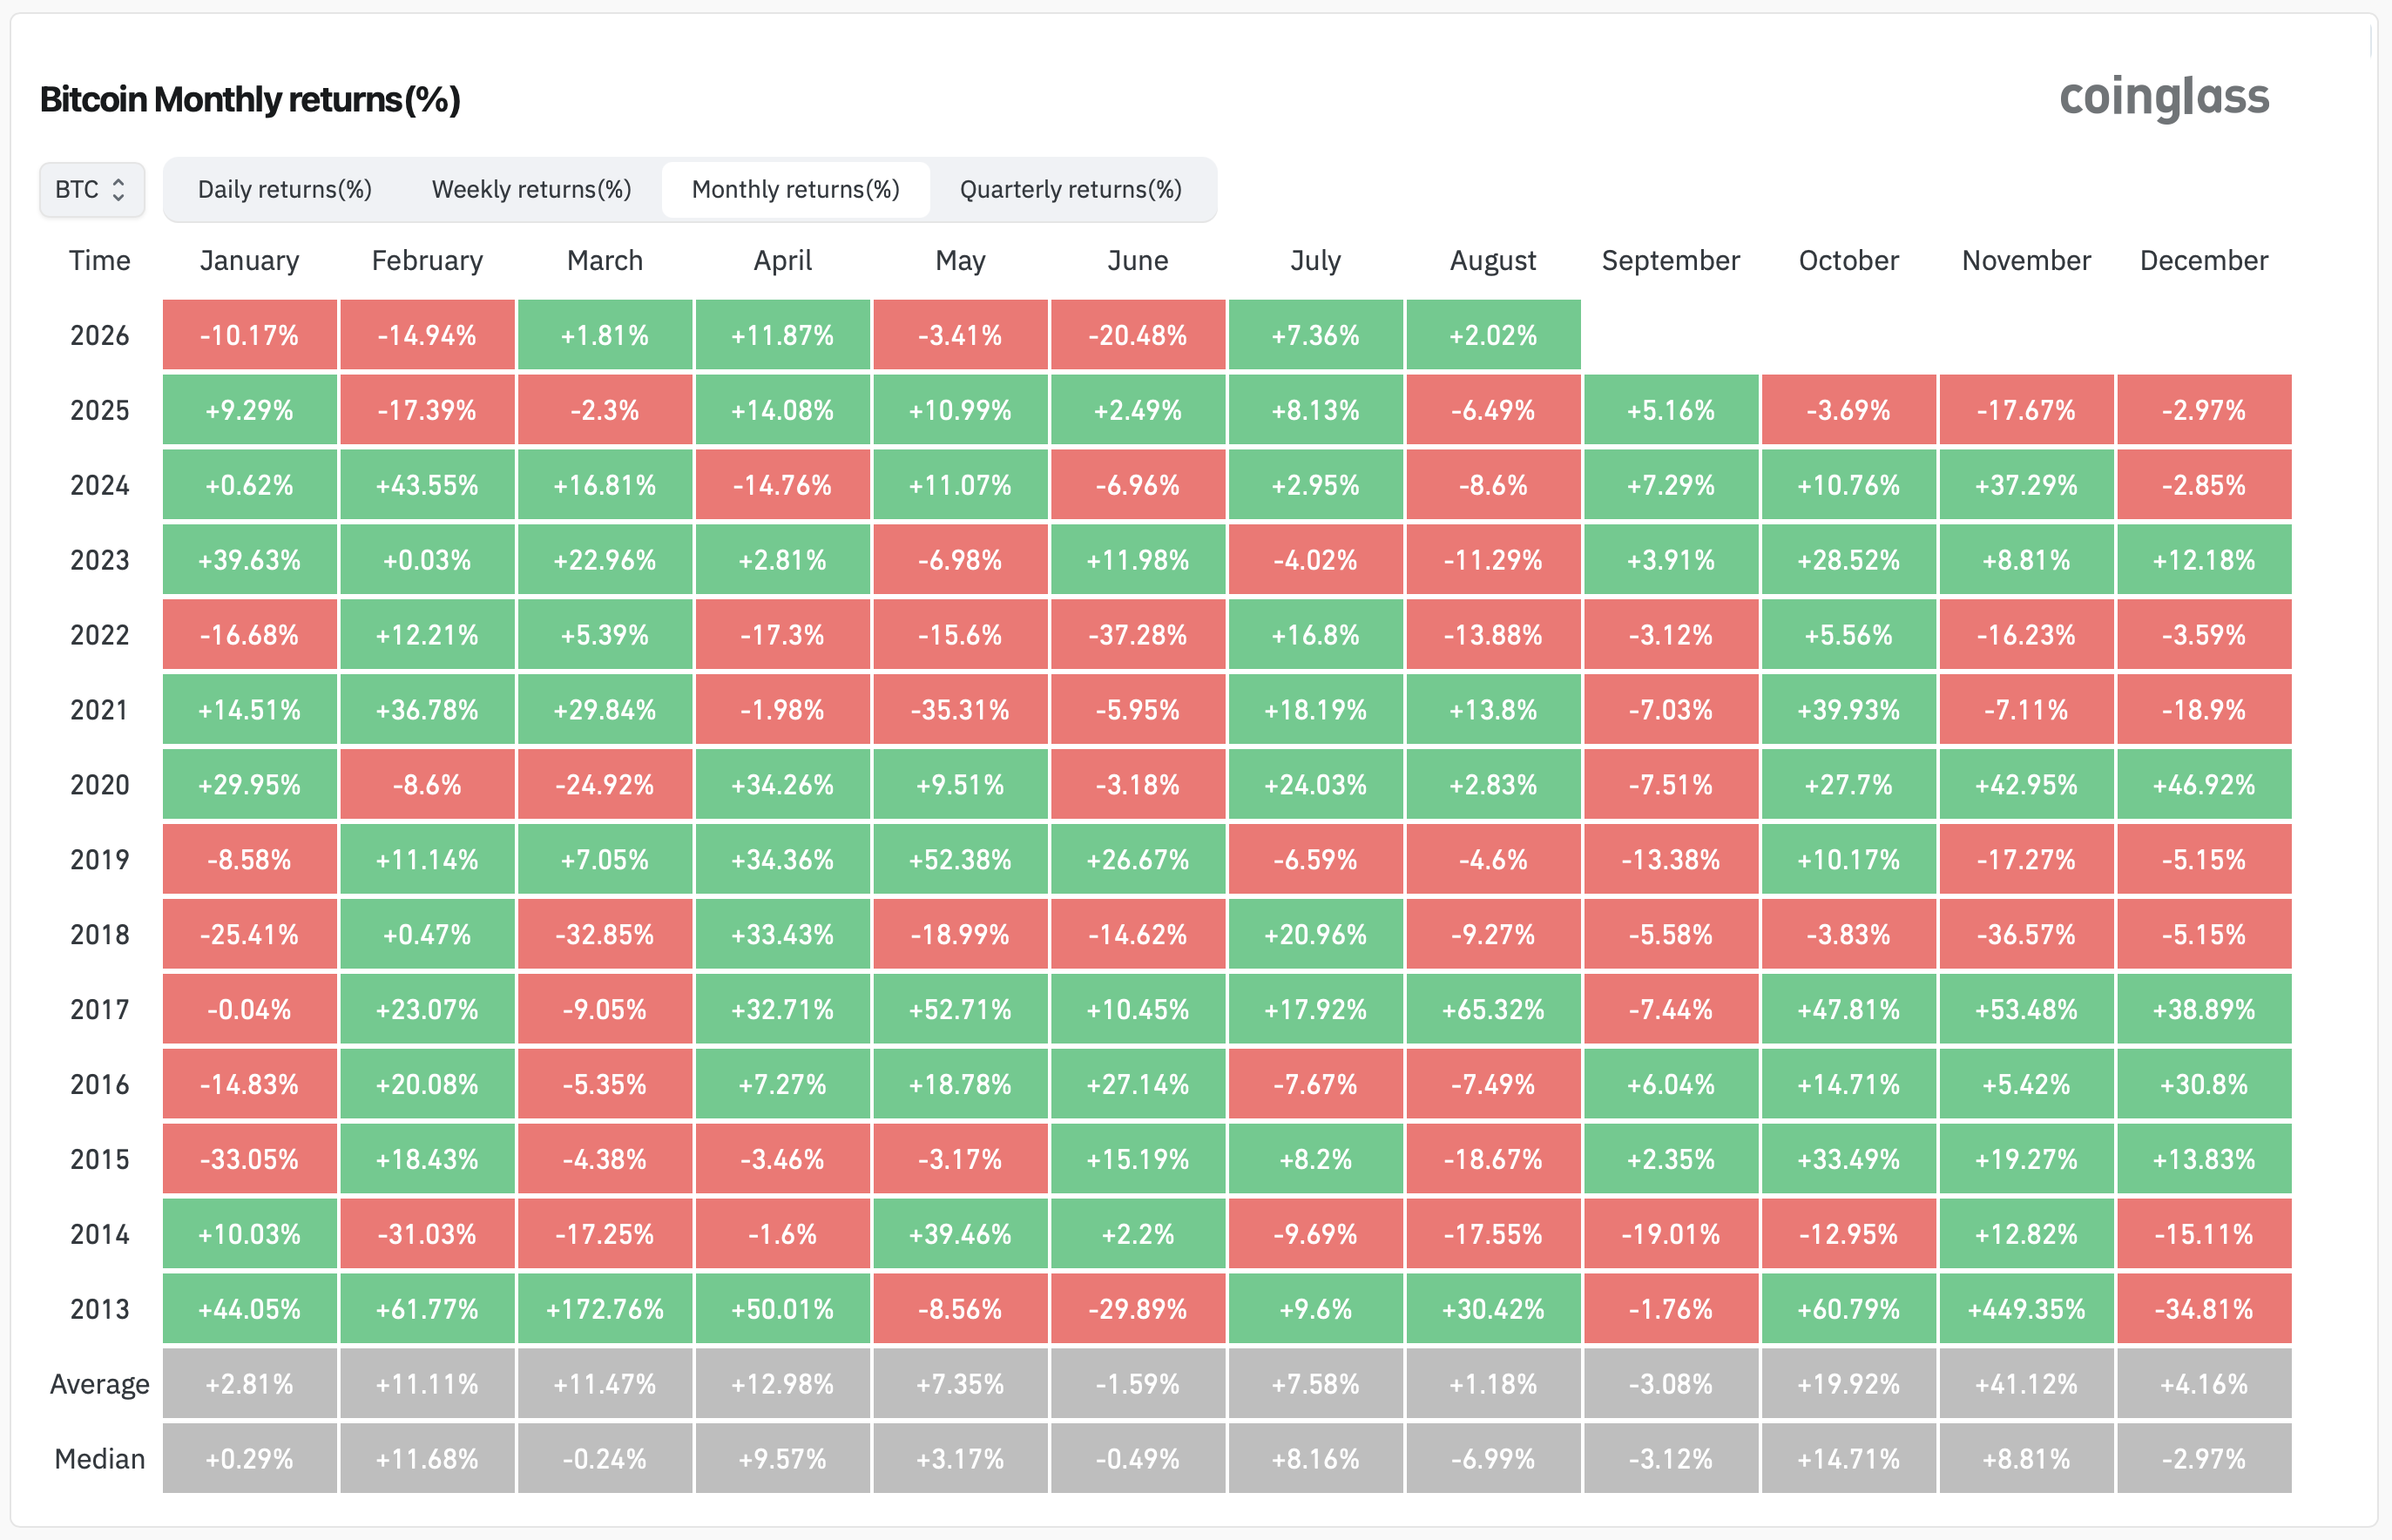
Historically, August has been one of Bitcoin's weakest months, making the multi-year return distribution the starting point for any 2026 forecast. According to CoinGlass monthly return data, Bitcoin's average August return since 2013 is +1.12%, while the median is approximately -7.49%. This gap reflects the main pattern: a few unusually strong rallies pull the average into positive territory, while the typical August ends lower. Of the past 13 Augusts, only four closed higher - 2013, 2017, 2020, and 2021. In other words, nine of thirteen Augusts ended lower.
The extremes show the breadth of the distribution. The strongest August on record was 2017, with a gain of +65.32%, during the expansion phase of that bull market. The other positive years were much weaker: about +30% in 2013 and +13.8% in 2021. The weakest was August 2015, at -18.67%.
The full year-by-year record:
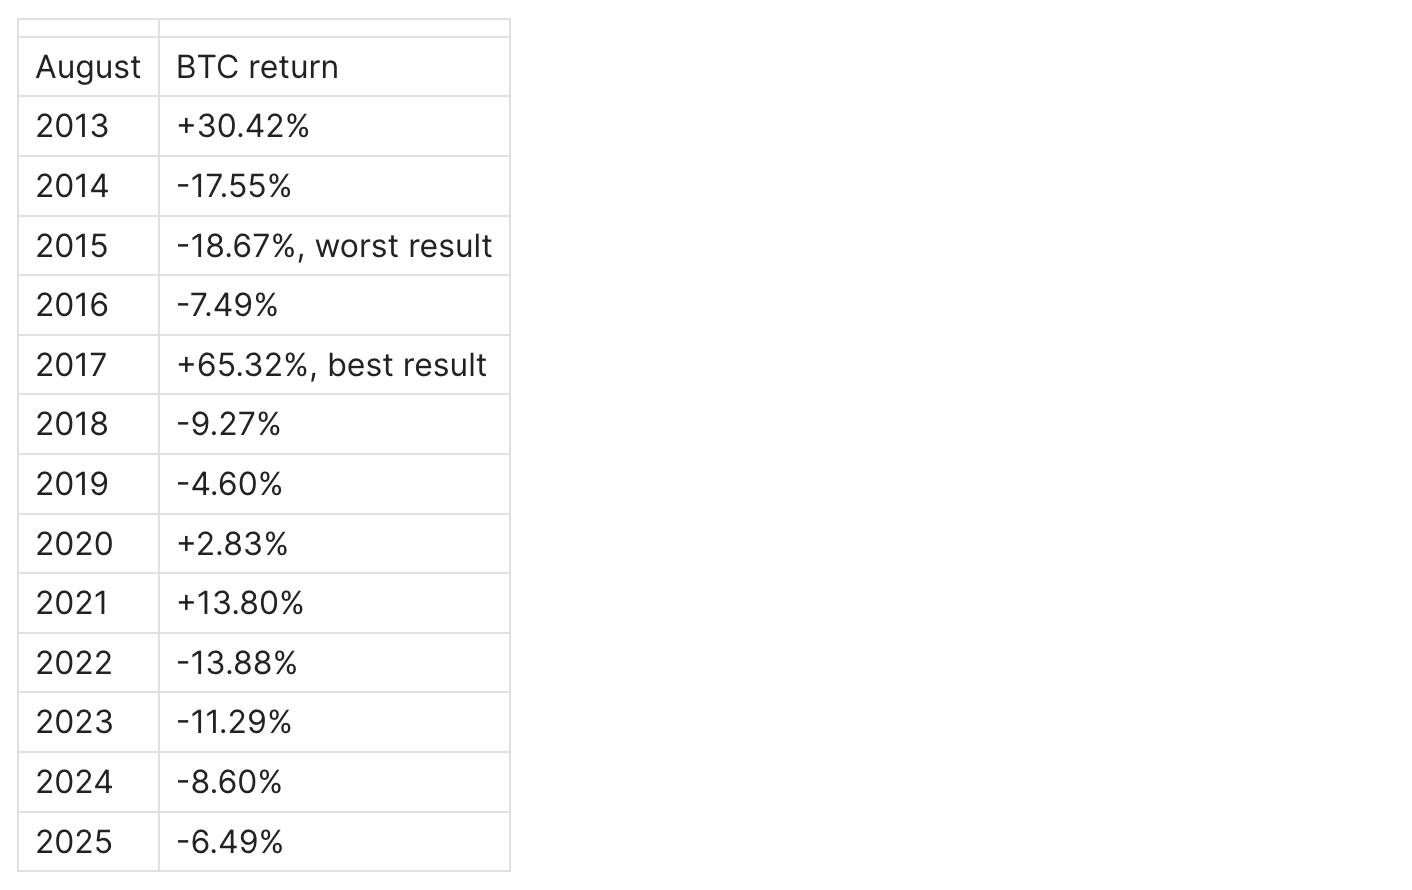
The nine negative Augusts ranged from modest declines to severe losses. The deepest drops came in 2015 (-18.67%) and 2014 (-17.55%). The latest sequence has been more contained: all four Augusts from 2022 through 2025 ended lower (-13.88%, -11.29%, -8.60%, and -6.49%), with an average loss of roughly -10%. The size of the decline also narrowed each year. This does not establish a reliable trend, but it shows that seasonal losses have gradually become smaller over the past four years.
Two additional factors matter for August 2026. First, this is a US midterm election year, and all three previous Augusts in midterm years within the available sample ended lower: 2014 at -17.55%, 2018 at -9.27%, and 2022 at -13.88%. The average decline was approximately -13.6%. The sample is very small, so this should be treated only as additional context, not as a standalone forecasting signal. Second, July 2026 was a recovery month, not a momentum breakout. After the roughly 20% June collapse, Bitcoin recovered above $60,000 but repeatedly failed to break through $65,500. As a result, the market enters August without the trend strength that has occasionally produced a positive monthly return.
Applying the historical median of -7.49% to a starting price near $63,000 gives an estimated month-end level of approximately $58,300, effectively a retest of the June low. This is the seasonal base rate, not the forecast itself. The valuation, flow, and macro data below point to a more moderate outcome.
Bitcoin support and resistance in August 2026
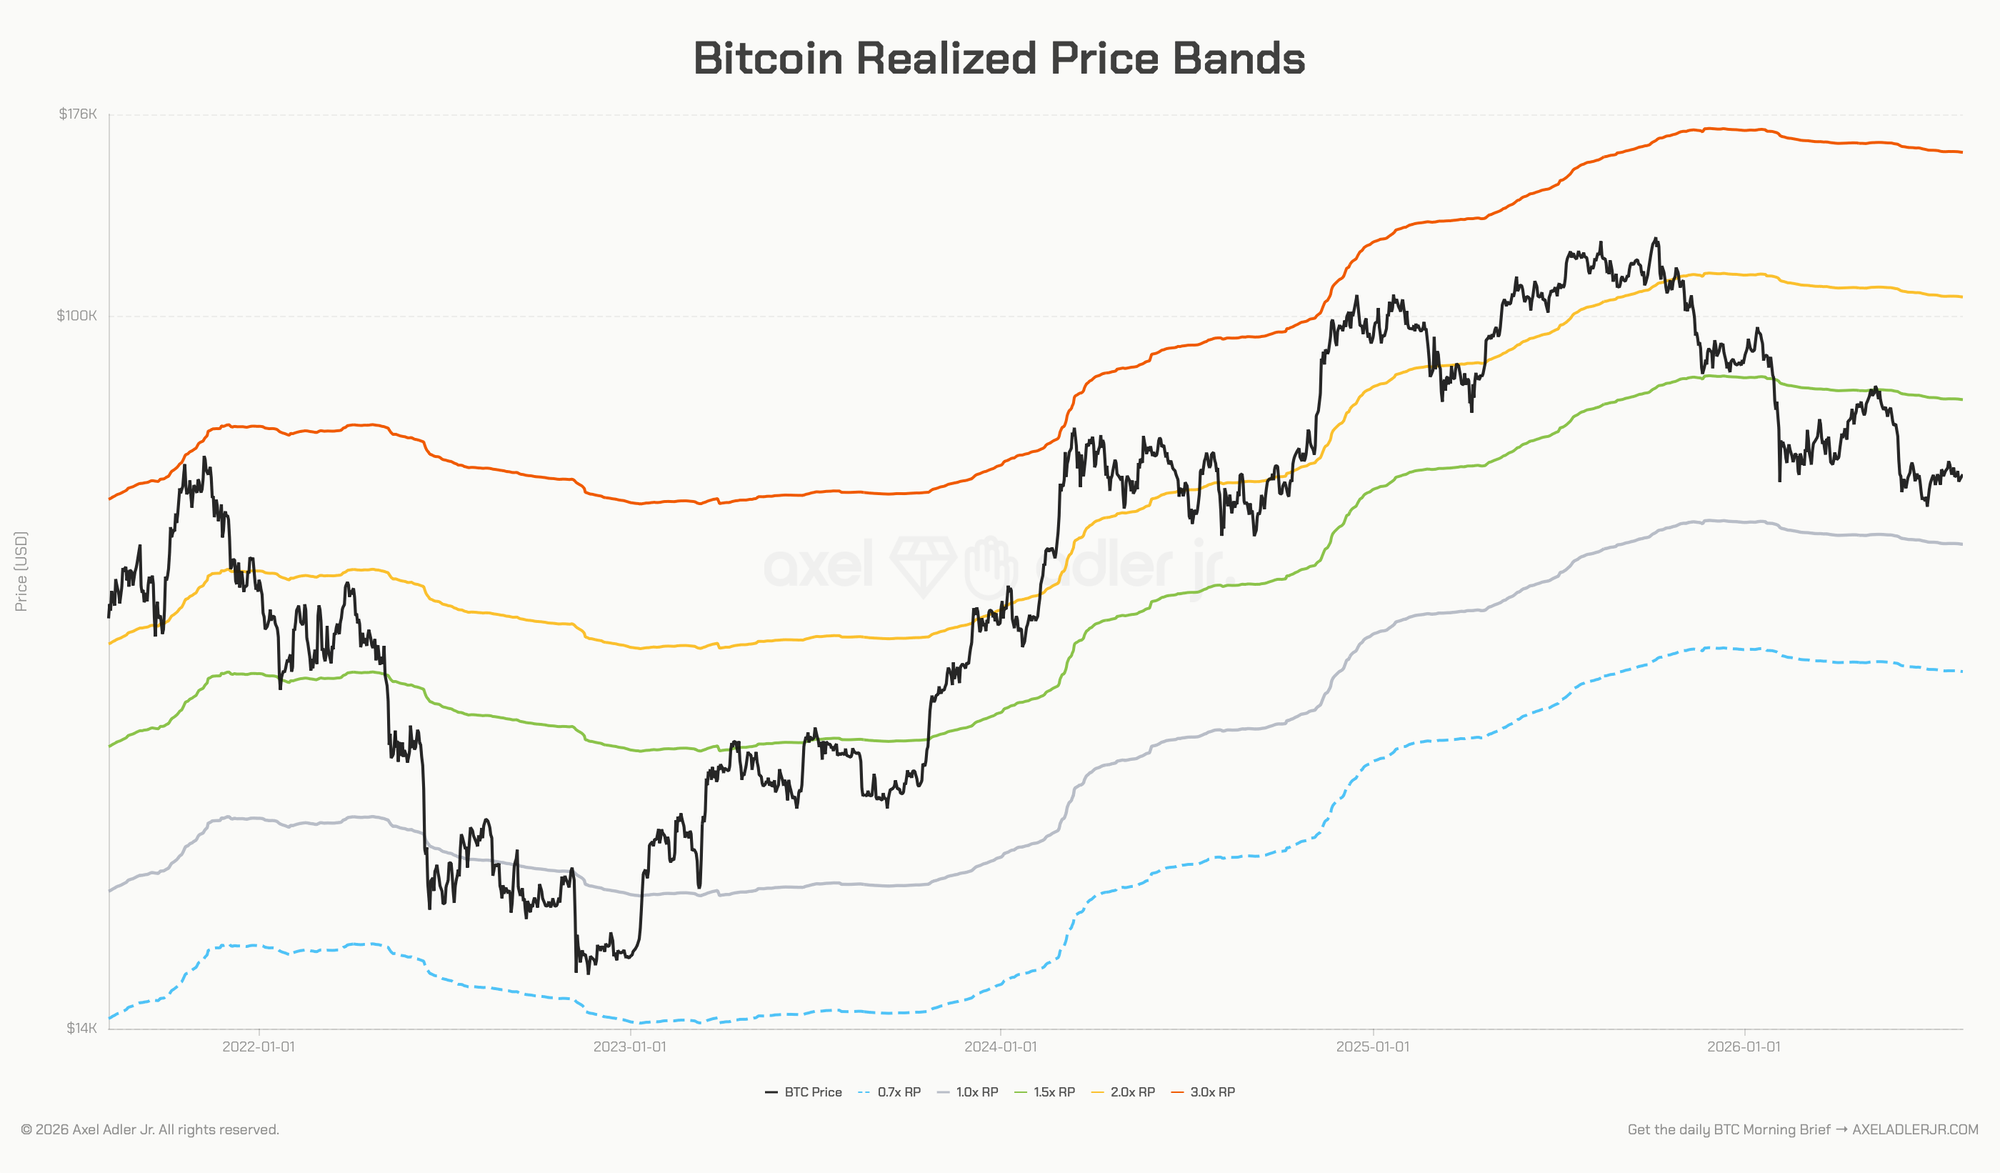
Over the past six weeks, the market has formed a clear structure. The lower boundary of the range sits near the 1 July local low of $57,730, while the upper boundary is near the 21 July local high of $66,918. Price is currently trading around the middle of this range.
Resistance levels:
- $64,000-$64,700 - the nearest supply zone, defined by recent daily highs. This is the first obstacle to further upside.
- $66,500-$67,000 - the July local high and the level capping the current range. A daily close above it would provide the first meaningful bullish signal.
- $71,000-$74,000 - the June breakdown zone, where a larger layer of overhead supply formed during the June decline remains in place.
Support levels:
- $62,000-$62,200 - the nearest support and the lower boundary of this week's trading range.
- $59,500-$60,000 - round-number support reinforced by the late-June consolidation. The $60K area also absorbed the February 2026 flash sell-off, when the intraday low reached $60,001, confirming demand in this zone.
- $57,730 - the lower boundary of the range and the July local low. A close below this level would break the current market structure.
- ~$52,750 - realized price, estimated at an MVRV of 1.21. This is the aggregate on-chain cost basis and the deepest structural support level in this analysis.
The practical conclusion is simple: the trading range runs from $57,730 to $67,000, while realized price near $52,750 separates a normal correction from capitulation below the aggregate cost basis.
Bitcoin macro outlook for August 2026
The macro backdrop in August 2026 remains restrictive and represents the main external source of pressure on Bitcoin this month. The picture is not entirely negative: inflation slowed sharply in June, energy prices declined, and international dollar credit continued to expand. The balance between restrictive US interest rates and gradually improving liquidity will determine whether Bitcoin remains range-bound or begins a broader recovery.
Federal Reserve. On 29 July, the Federal Reserve kept the federal funds target range at 3.50%-3.75%. The decision passed by a nine-to-three vote. Beth Hammack, Neel Kashkari, and Lorie Logan favored a 25-basis-point increase. The official statement said economic activity continued to expand at a solid pace, while inflation remained above the Fed's 2% target, partly because of energy and other supply shocks.
According to the June Summary of Economic Projections, the official median projection for the federal funds rate at the end of 2026 was 3.8%, but the distribution of estimates was almost evenly split. Nine of the 18 participants expected the rate to finish above the current target-range midpoint of 3.625%, eight expected it to remain at the current level, and one expected it to be lower. The full range of projections extended from 3.375% to 4.375%. The SEP is not a policy commitment, and participants' estimates can change as new inflation and labor-market data are released.
The next FOMC meeting is scheduled for 15-16 September, when the Committee will also publish an updated Summary of Economic Projections. Market-implied probabilities should be tracked through the CME FedWatch Tool, which calculates them from 30-Day Federal Funds futures. Because these probabilities change throughout the trading day, this analysis does not use a single fixed figure.
The transmission mechanism is direct: restrictive monetary policy and the possibility of further rate increases keep risk-free yields and dollar funding costs elevated, putting pressure on long-duration risk assets, including Bitcoin. A sustained decline in inflation, weaker employment data, or softer September Fed projections would reduce that pressure.
Inflation and oil. The official June CPI report from the US Bureau of Labor Statistics showed a sharp monthly slowdown in inflation. Headline CPI fell 0.4% month over month, the largest decline since April 2020, while the annual rate slowed to 3.5% from 4.2% in May. Core CPI was unchanged on the month and rose 2.6% year over year, down from 2.9%.
Energy was the main driver of the monthly decline. The BLS energy index fell 5.7% in June, including a 9.7% drop in gasoline prices, although energy remained 15.7% more expensive year over year. According to the US Energy Information Administration, Brent averaged $85 per barrel in June, $22 below the May level and $32 below April's highest monthly average. On 1 July, the Brent spot price fell below $70. Based on conditions as of 7 July, the EIA projected an average price of about $74 in the third quarter, expecting trade flows to recover, supply to increase, and the decline in global inventories to slow. However, prices rose sharply again in the second half of July: the official EIA spot price reached $105.32 on 23 July and remained above $100 on 24 July. The EIA's July forecast should therefore be treated as a scenario formed before the latest price spike, not as a current description of the market.
The transmission mechanism is straightforward: sustained energy disinflation reduces pressure on headline CPI, Treasury yields, and the expected policy path, supporting Bitcoin. A renewed oil shock would have the opposite effect by raising inflation expectations and increasing the probability of further monetary tightening.
Yields and the dollar. According to the Federal Reserve's official H.15 Selected Interest Rates release, the 10-year Treasury constant-maturity yield closed at 4.70% on 3 August, while the 2-year yield stood at 4.25%. These were the latest official H.15 readings available on 5 August and replaced the earlier estimates of 4.56% and 4.18%.
For the dollar, this analysis uses the Federal Reserve's broad trade-weighted measure rather than the six-currency DXY. The Nominal Broad US Dollar Index stood at 119.7034 on 31 July, down from 120.7892 on 29 July but still indicating firm dollar conditions. This is the latest published daily reading in the series, with the next update expected on 10 August. The index measures the dollar against a broad group of major US trading partners and provides a better view of global financial conditions than DXY alone.
A 10-year yield near 4.70% raises the opportunity cost of holding a non-yielding asset such as Bitcoin. A strong trade-weighted dollar also tightens financial conditions for global borrowers and generally reduces demand for more volatile assets. A sustained decline in long-term yields and the broad dollar index would provide clearer macro confirmation that conditions are improving.
Global liquidity. One component of global dollar liquidity continues to expand. The Bank for International Settlements reported that dollar credit to non-bank borrowers outside the United States increased 7.3% year over year in the first quarter of 2026, reaching approximately $14.7 trillion. The measure includes bank loans and international debt securities and does not cover the entirety of global dollar liquidity.
The signal remains mixed rather than outright bearish. Dollar credit to non-bank borrowers outside the United States is growing, but domestic US financial conditions remain constrained by the 3.50%-3.75% target range, a 10-year Treasury yield near 4.70%, and a strong trade-weighted dollar. For Bitcoin, the structural bullish catalyst would be a combination of further credit expansion and falling US yields, rather than growth in a single measure on its own.
August calendar. There is no FOMC decision in August, but several official events during the month will shape expectations for September:
- 7 August - BLS Employment Situation report for July
- 12 August - BLS Consumer Price Index for July
- 19 August - publication of the minutes from the 28-29 July FOMC meeting
- 27-29 August - Jackson Hole Economic Policy Symposium, hosted by the Federal Reserve Bank of Kansas City
- 15-16 September - next FOMC meeting and updated economic projections
The theme of the 2026 Jackson Hole symposium is "Financial Innovation: Implications for Payments and Monetary Policy." Each of these events could materially shift rate expectations and trigger volatility in an already thin summer-liquidity environment.
On-chain and derivatives structure
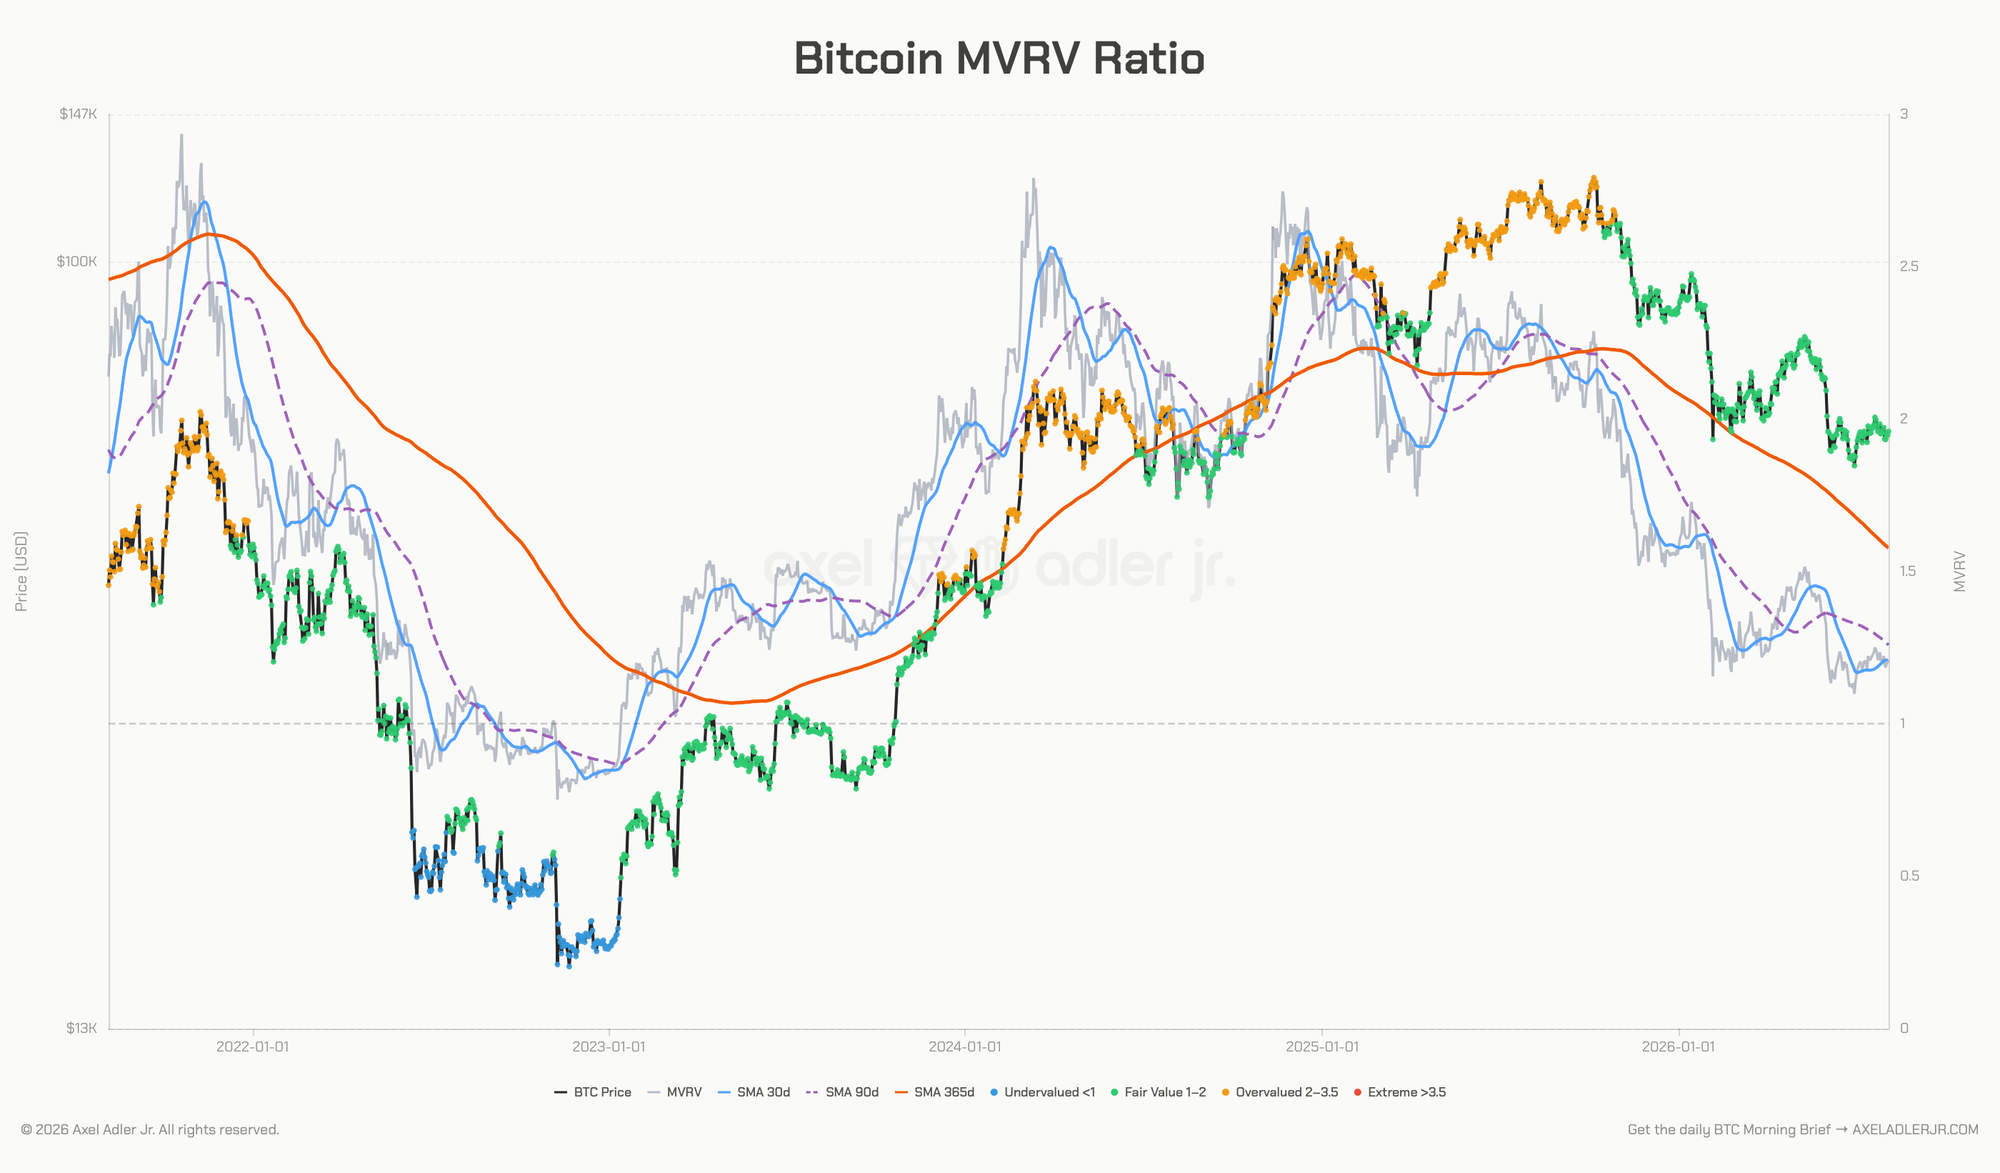
Against restrictive macro conditions, Bitcoin's internal market structure looks more constructive, with on-chain valuation remaining the main source of support.
Valuation. An MVRV of 1.21 means the market is trading only slightly above the aggregate cost basis. Historically, this range reflects neither panic-level undervaluation, when MVRV falls below 1.0, nor euphoria, when it rises above 3.0. It is an accumulation and value zone in which downside pressure usually eases because a large share of supply remains only marginally profitable. After a decline of roughly 50% from the cycle high, this is the most constructive part of the current market structure.
Derivatives. Open interest remains stable near $22.4B, having declined from the 21 July high of about $23.1B rather than continuing to rise. This means the market did not enter August with an excessively crowded leveraged position. Funding across all exchanges remained moderately positive, with aggregate daily readings in the low thousandths and a brief rise toward 0.0088 on 29 July. This indicates a mild long bias, but not the overheated conditions associated with leverage-driven tops. This combination reduces the risk of a sharp long squeeze while also confirming the absence of strong directional momentum.
Supply pressure. Exchange netflows shifted toward inflows in late July and on 3 August. In particular, inflows reached +6,658 BTC on 31 July and +5,847 BTC on 3 August, coinciding with a price decline from $66K to $63K. On 4 August, the metric reversed to an outflow of -3,211 BTC. The inflows pointed to higher potential sell-side pressure, but the 4 August outflow partly weakened that signal. The scale of the flows does not yet confirm a broad sell-off.
Bitcoin ETF flows in August 2026
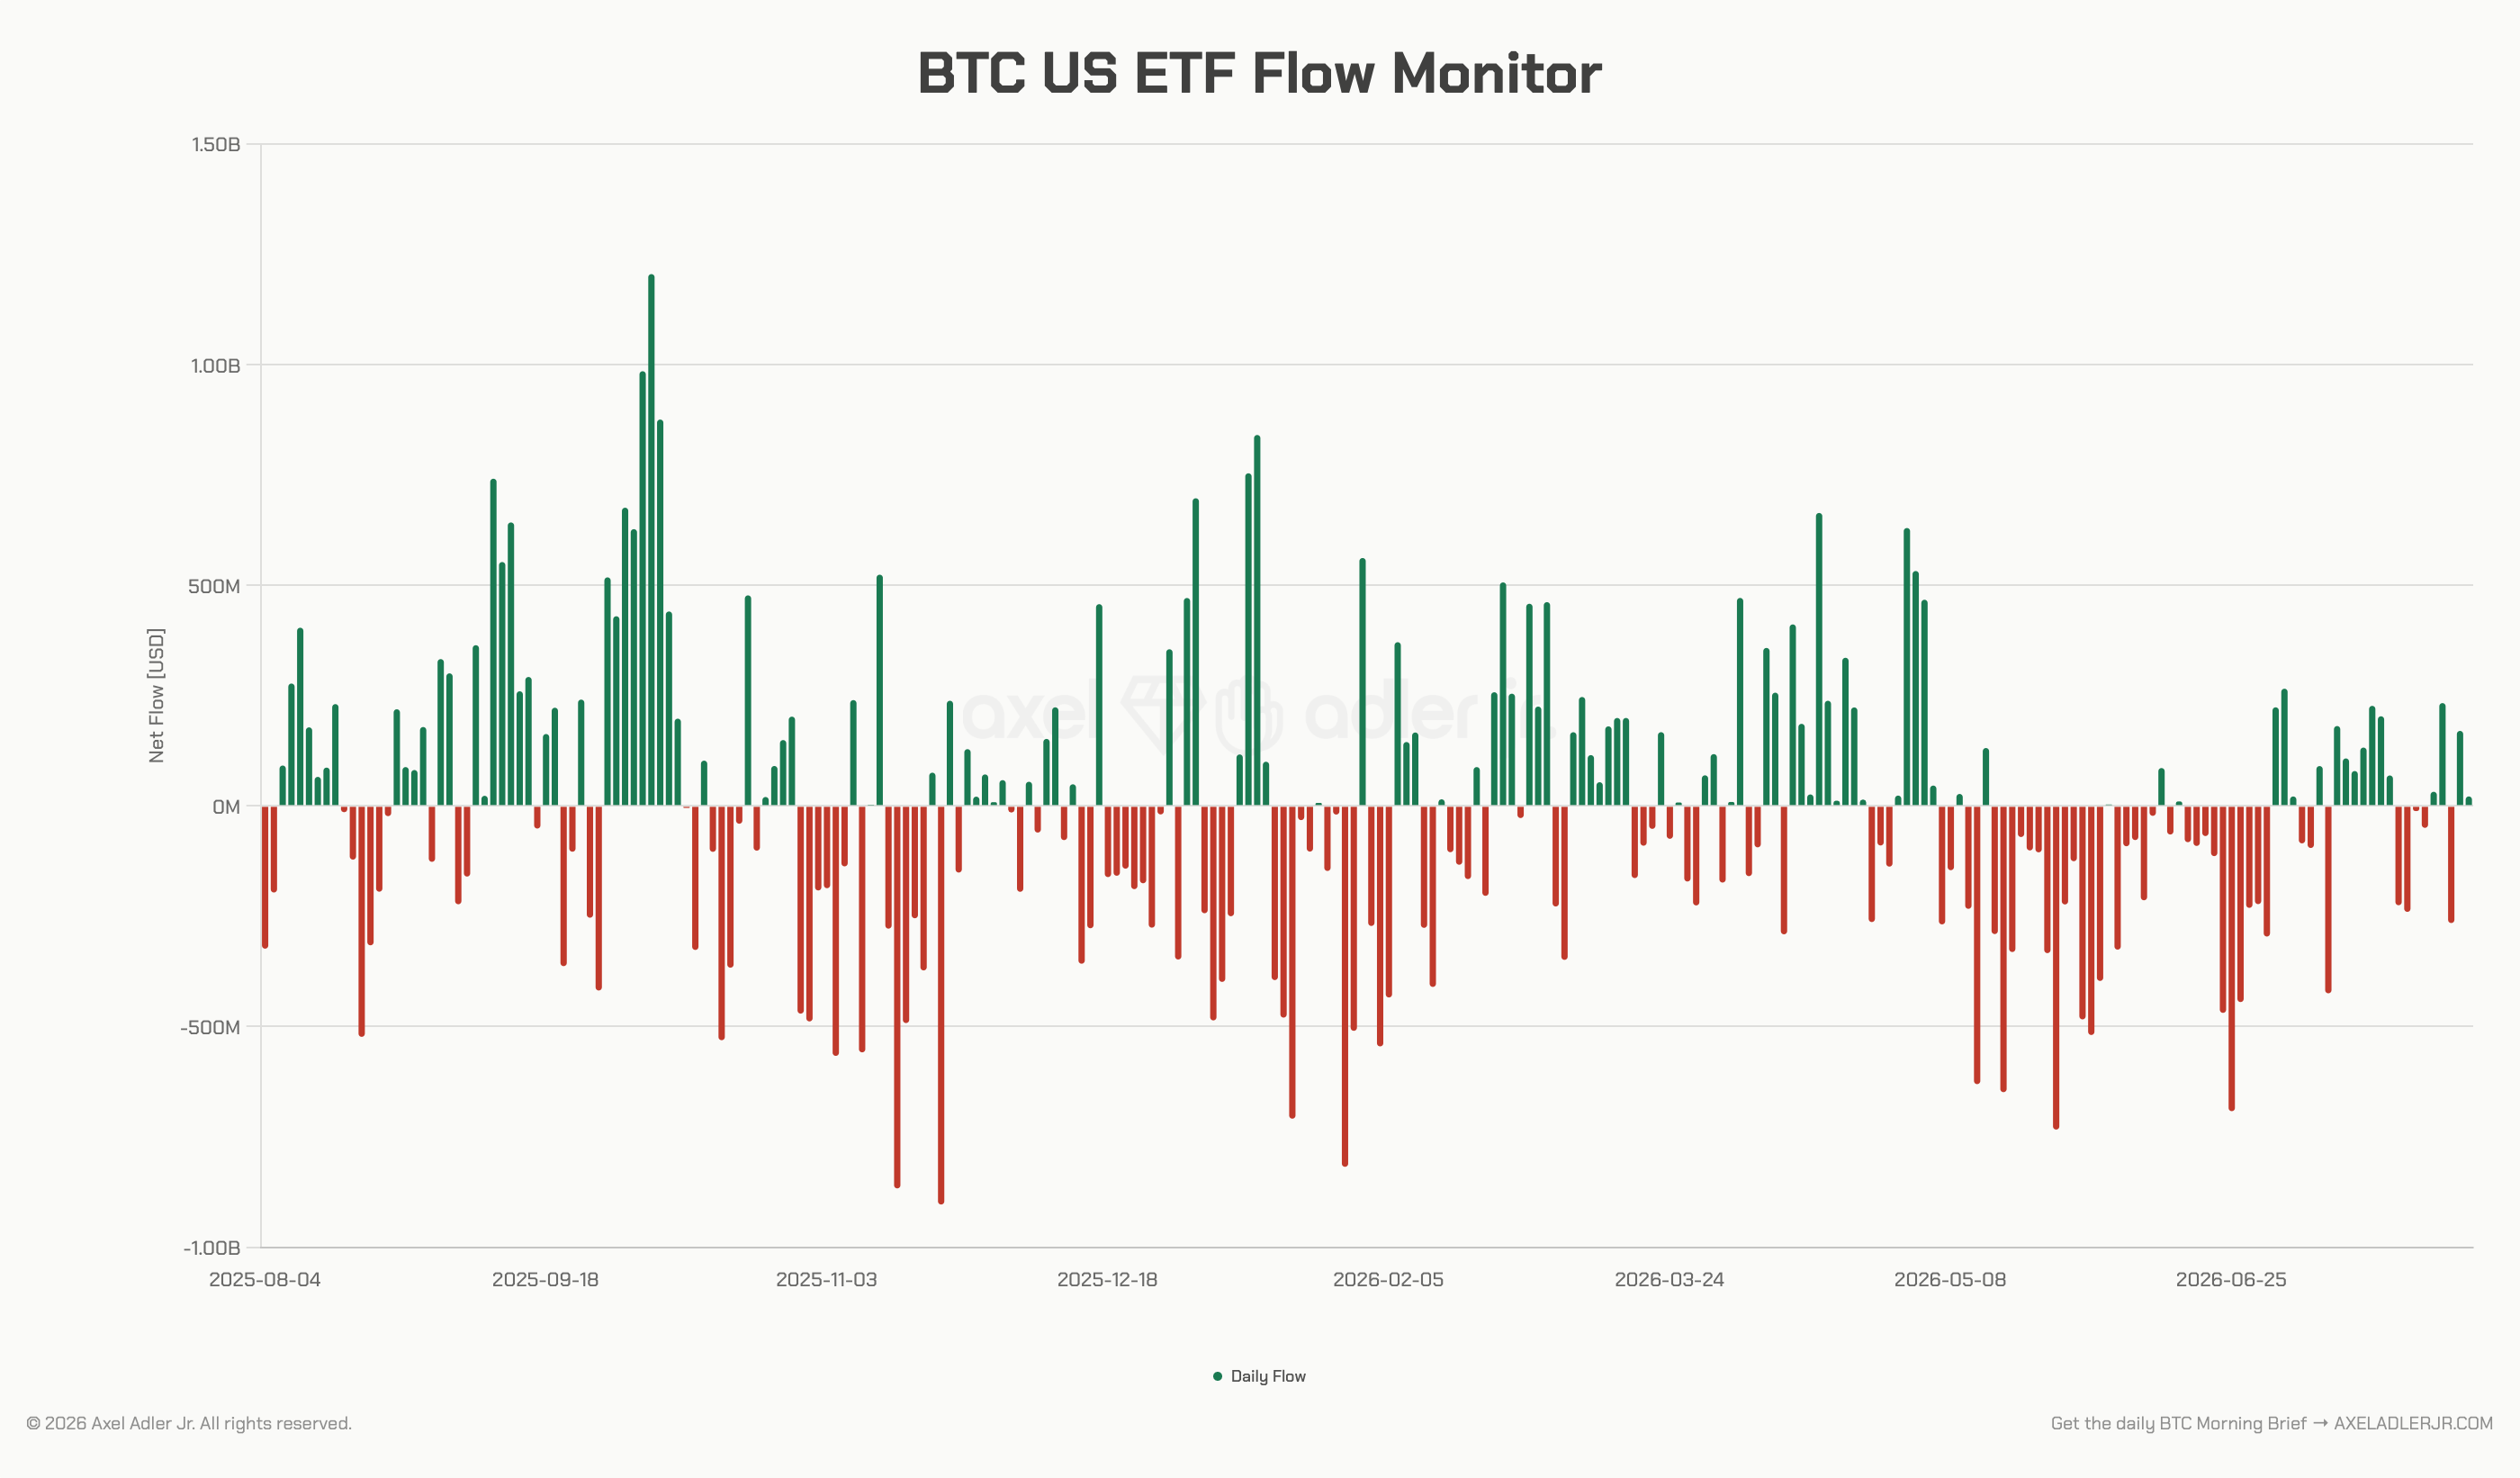
US spot Bitcoin ETFs remain net buyers, but the spot price is significantly below the modelled basis of aggregate flows. This gap defines the current ETF-channel setup. Daily dollar flows come from Farside Investors, while BTC-denominated estimates come from the BTC US ETF Flow Monitor.
Flow. The latest completed session on 4 August recorded a net inflow of +$211.5M, equivalent to approximately +3.30K BTC at the $64,040 closing price. Week-to-date net inflows reached +$381.6M, or about +5.98K BTC. Demand through the ETF channel remains positive, but has not yet reached the scale typically associated with sustained uptrends.
Scale. Since launch, US spot ETFs have attracted approximately $51.76B in cumulative net inflows. The modelled accumulated amount is approximately 610.59K BTC, worth around $39.10B at a price of $64,040. The BTC amount is calculated by converting daily dollar flows at the corresponding market price rather than using direct custody-balance data, so these figures should be treated as modelled context, not exact holdings.
Basis. The ETF model basis is approximately $84,768 and represents a flow-weighted estimate of the level at which aggregate capital entered. At a spot price of $64,040, the market is approximately 24.5% below this estimated basis.
This figure should not be interpreted as the verified average purchase price of every current ETF holder. ETF shares change hands between investors, while aggregate flows do not reveal the cost basis of the current shareholder base. The metric is better used as an estimate of where historical net flows were concentrated, not as a direct accounting measure of investor losses or the break-even point of current holders.
With that limitation in mind, the model basis remains a useful long-range benchmark for comparing the current price with the concentration level of historical flows. However, by itself it does not prove the existence of a break-even zone, overhead supply, or technical resistance near $84,768.
Spot-demand cross-check. The Coinbase Premium Index, which reflects the strength of US spot demand, remained negative in late July and early August. The raw Coinbase Premium Gap was approximately between -$28 and -$88. This is more consistent with passive, price-insensitive demand than active accumulation.
Demand through the ETF channel remains positive but cautious. The clearest bullish confirmation would be a sustained increase in daily inflows alongside a shift in the Coinbase Premium into positive territory. Until then, ETF flows support the base-case range rather than a breakout scenario.
Bitcoin price prediction for August 2026: scenarios
Base-case expectation: Bitcoin is likely to spend most of August between $58,000 and $67,000, with the most likely month-end closing range between $60,000 and $64,000. The seasonal base rate, which implies a level near $58,300 based on the historical median, and the restrictive macro backdrop create a modest downside bias. At the same time, valuation near cost basis, growth in dollar credit to non-bank borrowers outside the United States, and continued positive ETF flows reduce the probability of a deeper decline. The probabilities below reflect my subjective assessment, not a guaranteed outcome.
Base case - range-bound, approximately 55%. BTC holds the $57,730-$67,000 range and moves sideways amid thin summer liquidity. Valuation near cost basis limits the downside, while moderate ETF-channel demand and elevated Treasury yields cap the upside. The most likely month-end closing range is $60,000-$64,000.
Bear case - seasonal breakdown, approximately 30%. A daily close below $57,730 would break the current structure, expose the $52,750 realized-price level, and push MVRV toward 1.0. Downside risk is higher than in a typical month because August seasonality, the midterm-year pattern, and restrictive US rate conditions all point in the same direction. Potential triggers include accelerating BTC inflows to exchanges, a stronger-than-expected July CPI reading, renewed energy inflation, or hawkish signals from Jackson Hole.
Bull case - range breakout, approximately 15%. A daily close above $67,000, confirmed by stronger ETF inflows, a positive Coinbase Premium, falling Treasury yields, and a weaker trade-weighted dollar, would open the path toward the $71,000-$74,000 June supply zone. This scenario requires a demand or macro catalyst that current data has yet to confirm.
The risk-reward balance favors patience over chasing the move: deep support is clearly defined near the aggregate cost basis, while the upside still requires a demand or macro catalyst that is not yet visible in spot flows, yields, or the dollar.
How the probabilities are calculated. The framework starts with the 13-year seasonal frequency: nine of thirteen Augusts closed lower, four closed higher, and the median return was -7.49%. These frequencies are then adjusted for the current market structure.
The bullish scenario receives a weight of approximately 15%, below the raw 31% frequency of positive Augusts, because a confirmed breakout above range resistance under passive ETF demand and elevated Treasury yields is a narrower event than simply closing the month higher.
The bearish scenario receives a weight of approximately 30%, above the usual probability of a tail event, because the seasonal median of -7.49%, corresponding to a price near $58,300, falls directly at the lower boundary of the range. The distribution is also skewed lower by the midterm-year sample of 2014, 2018, and 2022, which produced an average return of approximately -13.6%. The sample includes only three such years, so the size of this adjustment is deliberately limited.
The base case receives the remaining weight of approximately 55%, consistent with price holding near cost basis at an MVRV of 1.21 and balanced flows. This structure is consistent with the central thesis that valuation near cost basis should soften seasonal pressure without eliminating the risk of another test of the lower boundary of the range.
Key levels
- Bullish trigger: daily close above $67,000
- Range midpoint: $62,000-$63,000
- Structure break: daily close below $57,730
- Deep support: ~$52,750, realized price
- Flow confirmation: rising ETF inflows and a positive Coinbase Premium
- Macro confirmation: falling Treasury yields and a weaker Fed broad dollar index
- Distant model benchmark: ~$84,768, estimated ETF basis
- Macro catalysts: 7 August employment report, 12 August CPI, 27-29 August Jackson Hole, 15-16 September FOMC meeting
Data sources: on-chain and derivatives metrics come from CryptoQuant; US spot Bitcoin ETF flow data come from Farside Investors and the BTC US ETF Flow Monitor at axeladlerjr.com; monetary-policy data come from the Federal Reserve Board and CME FedWatch; inflation data come from the US Bureau of Labor Statistics; Treasury yields come from the Federal Reserve H.15 release; dollar data come from the Federal Reserve H.10 release via FRED; oil data come from the US Energy Information Administration; data on dollar credit outside the United States come from the Bank for International Settlements; and the Jackson Hole calendar comes from the Federal Reserve Bank of Kansas City. ETF asset amounts and the model basis are estimates based on aggregate flows, not direct custody data or individual investor cost bases. This is on-chain and market analysis, not financial advice. Do your own research before making any decision.