


The price has recovered to $64.6K, but two flow indicators do not confirm an influx of fresh demand. The Demand-to-Issuance Ratio and Net Age Flow are recovering from their July lows, yet both remain deeply negative. Accumulation and shrinking liquid supply are supporting the market, but buyers have yet to generate new momentum.
TL;DR
The current price rebound is not confirmed by flows. The apparent demand-to-issuance ratio and net age flow are recovering from their July lows but remain negative. Supply is aging and leaving circulation, supporting the price, but fresh demand has yet to return.
Bitcoin Apparent Demand-to-Issuance Ratio (30D)
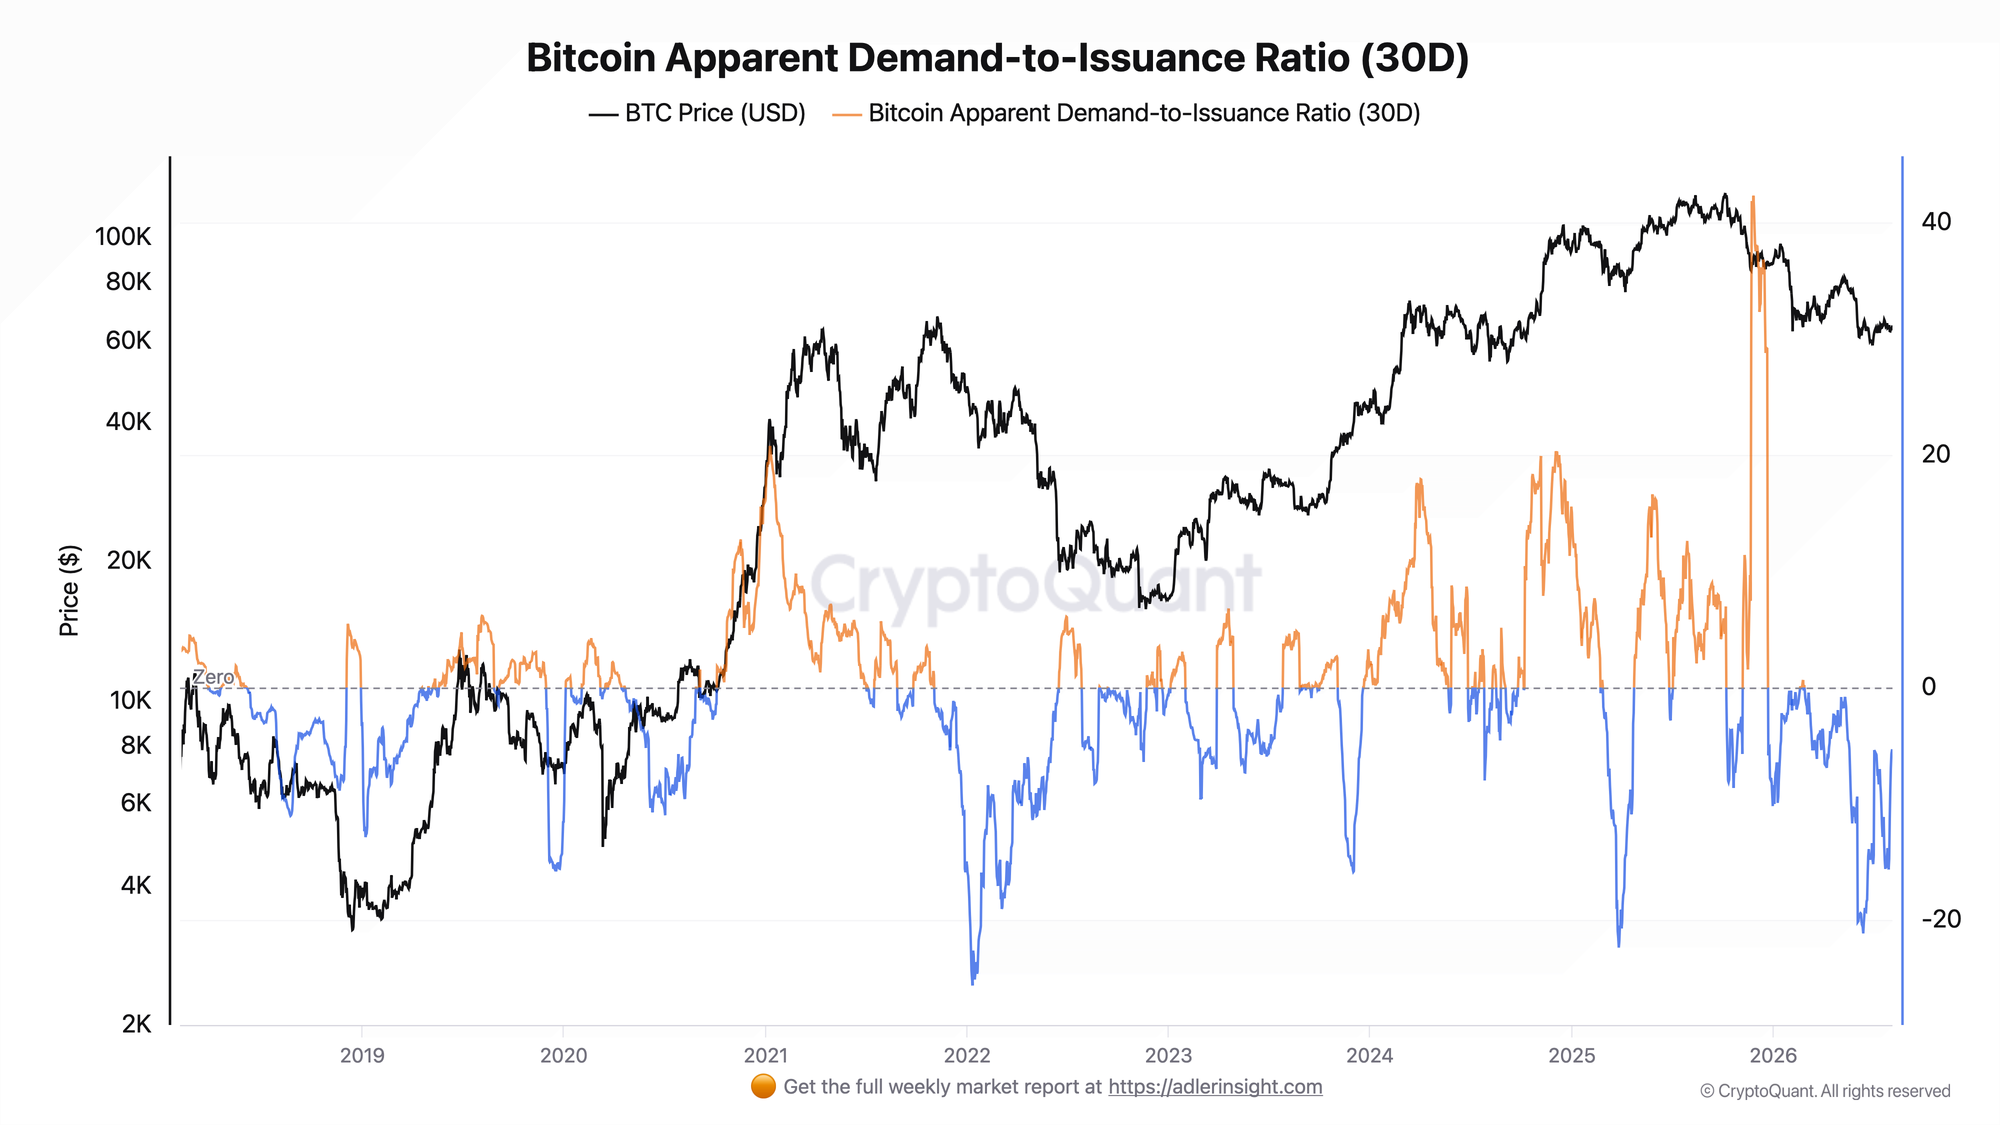
The metric compares the 30-day change in the volume of coins less than one year old with new issuance. A reading above 1 means the volume of young coins is growing faster than issuance. A reading between 0 and 1 indicates growth that does not exceed the amount of newly issued BTC. A reading below zero means the volume of young coins is shrinking.
The ratio currently stands at -5.43. Over the past 30 days, the volume of coins less than one year old has fallen far more than new issuance has added. The indicator has remained below zero for about five months. It has recovered from its July low near -16, so the pressure is easing, but the regime has not changed. The current price rebound is not accompanied by growth in the volume of young coins.
As long as the ratio remains below zero, apparent demand does not confirm the price recovery. A move back above zero would be the first sign of improvement. A sustained move above 1 would confirm a new regime, with the volume of young coins growing faster than issuance.
Bitcoin Net Age Flow (30D Sum)
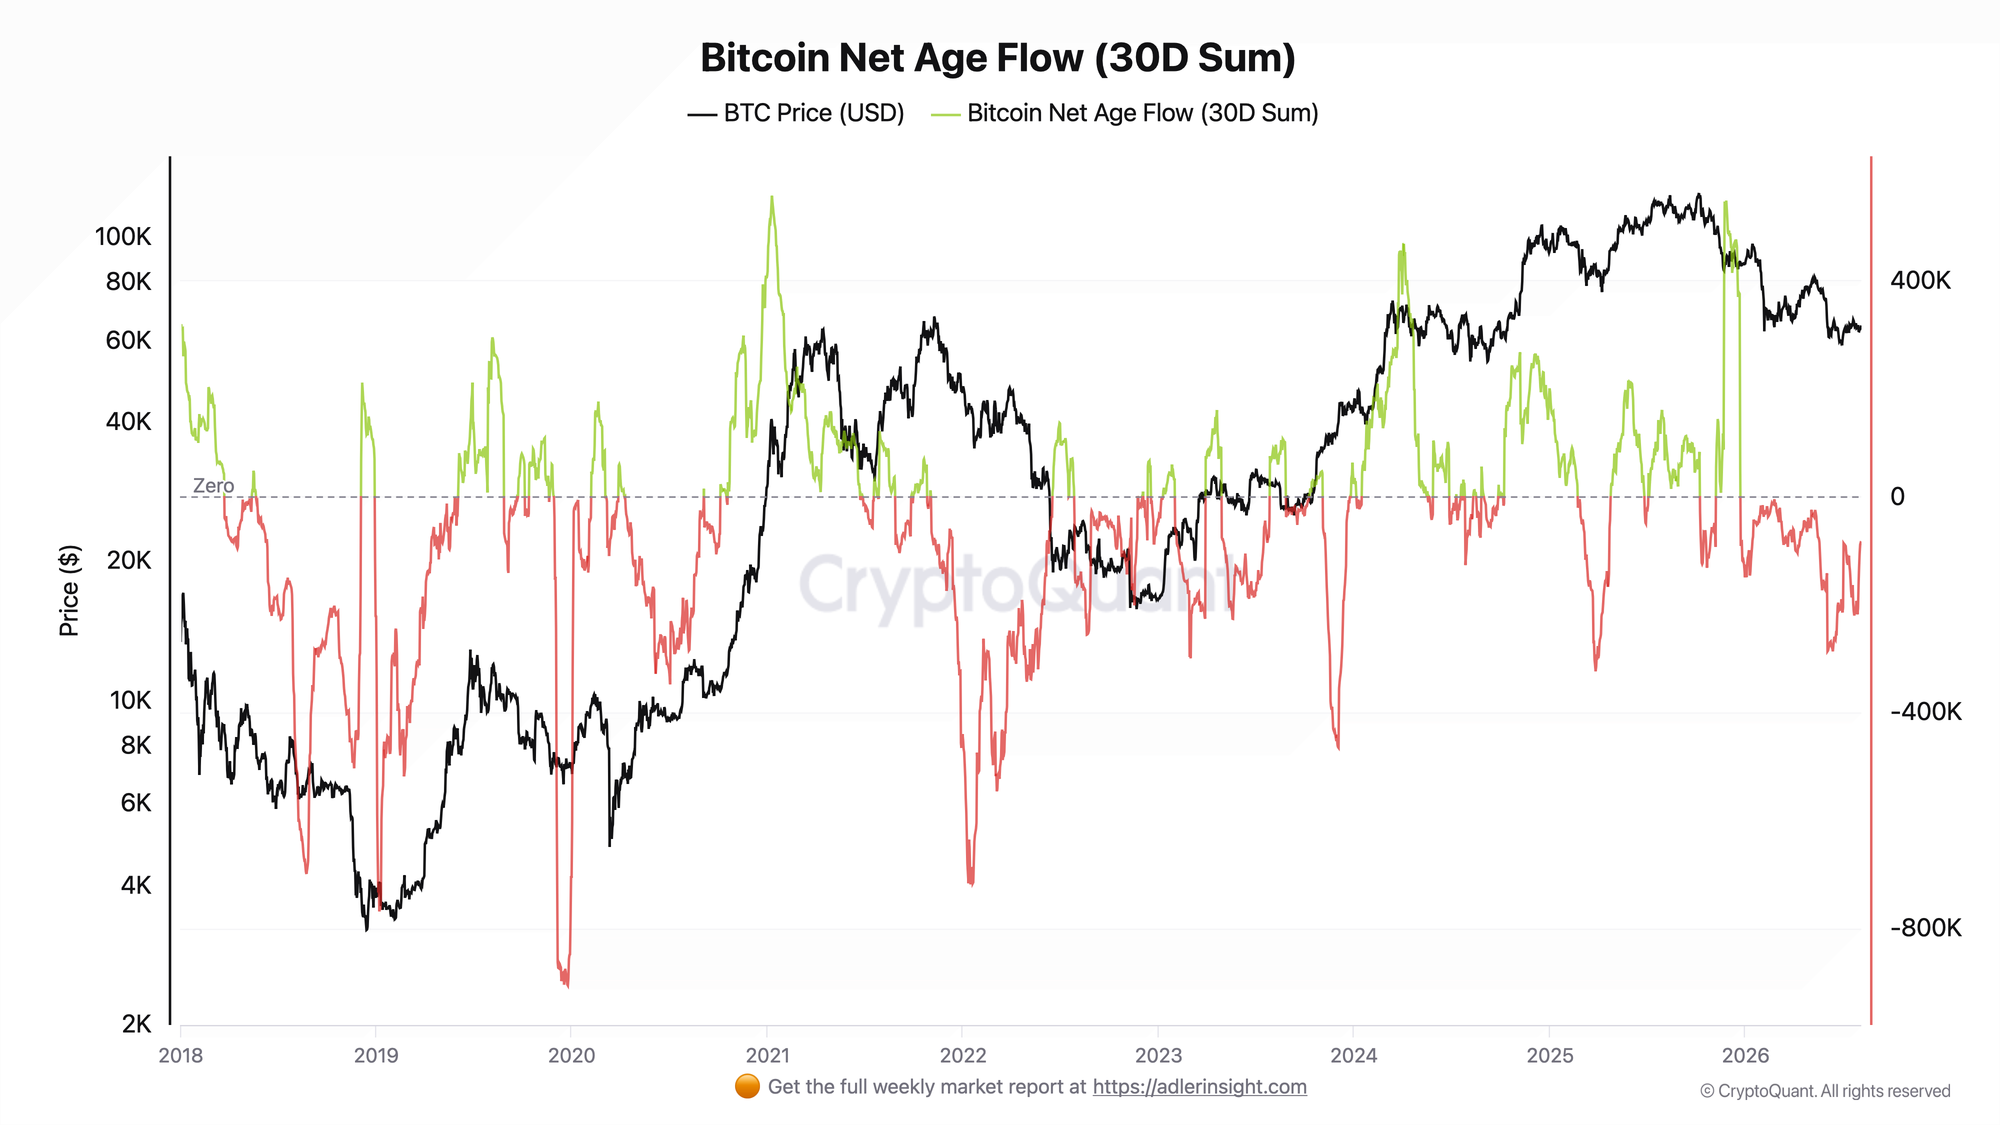
The metric tracks the net movement of BTC between age cohorts over 30 days. A negative reading means more coins moved into the over-one-year category than returned to young supply. A positive reading indicates the opposite.
Net Age Flow currently stands at -85.5K BTC. Over the past month, 85.5K more BTC moved into the over-one-year category than returned to young supply. The flow has remained negative for seven months. It has recovered from its July extreme near -220K BTC but remains deeply negative. Supply continues to age, and its liquid portion continues to shrink.
This pattern points to accumulation and a decline in the supply available for sale. From a positioning perspective, it is more a source of medium-term support than fuel for an immediate rally.
Both charts describe the same market structure: the price is recovering as supply ages and accumulation continues, but without an influx of fresh capital. Net Age Flow shows where the support comes from, while Demand-to-Issuance shows the lack of an independent growth driver. Shrinking supply supports the price, but demand is not yet generating momentum.
The market is forming a bottom, but the best entry only comes after confirmation. Weekly Engine highlights early triggers, key levels, and scenario invalidation conditions. Try it free for 7 days.
FAQ
Why is the price increase not confirmed if both indicators are recovering? They are rebounding from extreme lows but remain negative. The volume of young coins continues to shrink, while the age flow moves BTC out of liquid supply. The rebound is therefore driven mainly by shrinking supply rather than expanding demand.
What would signal a genuine regime change? The first signal would be both metrics moving above zero. A sustained rise in the Demand-to-Issuance Ratio above 1 would provide stronger confirmation. This would mean that the volume of young coins is growing faster than issuance and that net age flow is moving back toward the active portion of supply.
CONCLUSIONS
Both indicators are recovering from their July lows but remain negative: the Demand-to-Issuance Ratio stands at -5.43, while Net Age Flow is -85.5K BTC. Supply continues to age and leave the liquid portion of the market. This supports the price but does not create an independent growth impulse.
The market structure remains accumulation-driven, but demand has yet to confirm it. The first sign of improvement would be both metrics moving above zero, while a rise in Demand-to-Issuance above 1 would provide full confirmation. Without an influx of fresh demand, the current rebound could gradually run out of steam.
Live Charts
Explore the metrics behind this brief with live, auto-updating charts:
LTH vs STH Supply - Supply split between long- and short-term holders to track accumulation and distribution.
Exchange Netflow - Net BTC moving to and from exchanges across positive and negative flow regimes.
BTC US ETF Flow Monitor - US spot Bitcoin ETF daily flow, BTC-denominated accumulation, and fund leadership.
Liquidity Flows - All exchange-flow, ETF, and spot-demand charts in one view.