


🎧 Morning Brief #227 - audio debate
A year ago, Bitcoin was trading at $114K with a neutral level of stress. The price is now around $63.7K, while the Stress Score remains in the high zone. The first chart shows the one-year trend in UTXO structure stress, while the second shows its weekly momentum over the past month.
TL;DR
This brief shows how the balance of supply in profit and loss has changed over the past year and how stress has evolved during the past month. The picture remains strained, but the indicator is still far from previous extremes, while weekly momentum has only started to turn higher.
Bitcoin: Profit/Loss Stress Score
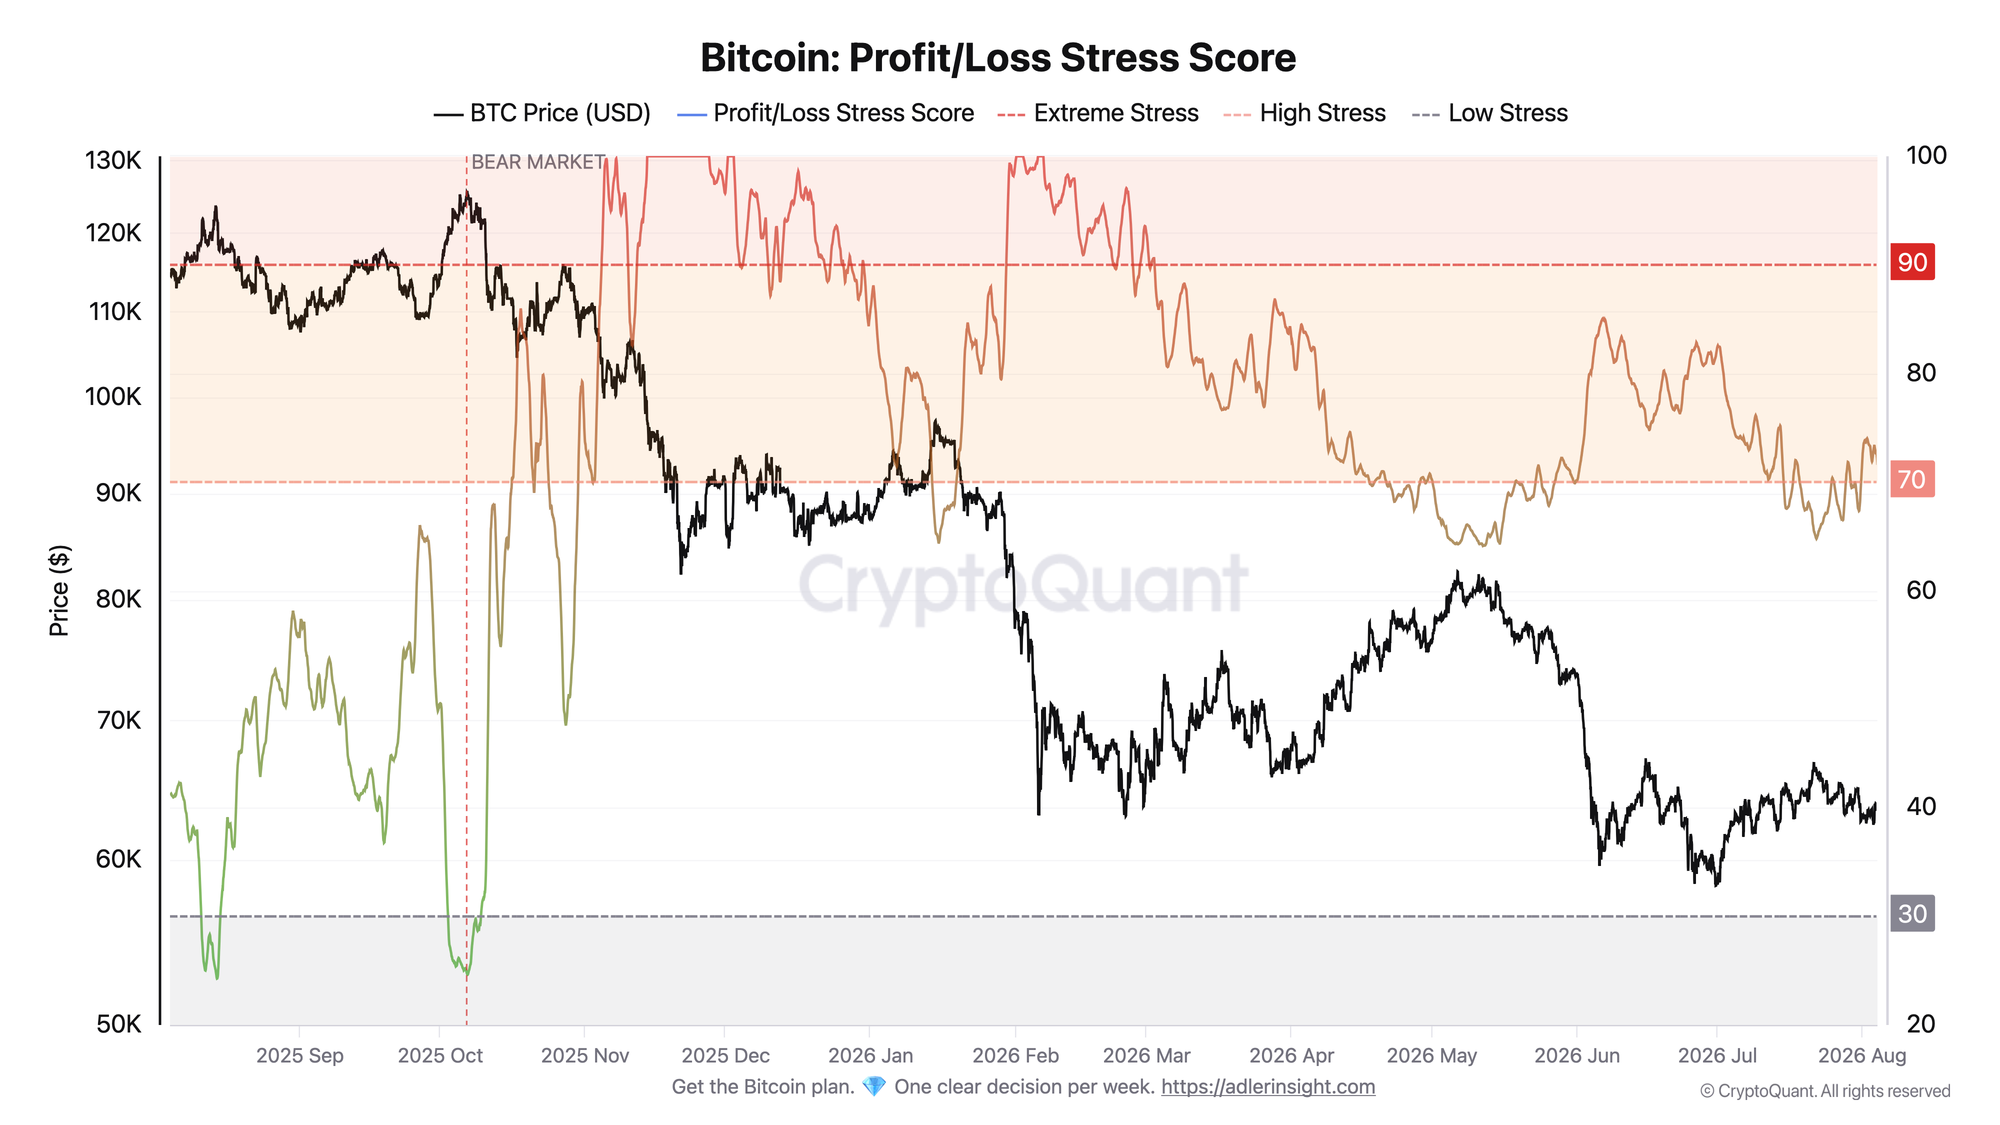
UTXO Stress Score:
0-30 - supply is predominantly in profit;
70-90 - high stress;
90-100 - an extreme shift toward loss.
A year ago, the indicator was in the neutral zone near 41, with Bitcoin priced at $114K. Over the past twelve months, the price fell toward $58K, while the Stress Score reached two extremes: a low of 24.27 in August 2025 near the price highs and the absolute level of 100 in November 2025 during the market crash. For nearly two-thirds of the year, supply remained in the high or extreme stress zone. The indicator now stands at 71.58, meaning it only recently crossed the 70 threshold and entered the lower end of the high-stress zone.
The one-year picture remains strained: the market is dominated by a regime in which a significant share of supply is underwater. A return below 70 would confirm easing stress, while a move toward 90+ would signal deterioration, as it did in November.
Bitcoin: Profit/Loss Stress Score Momentum
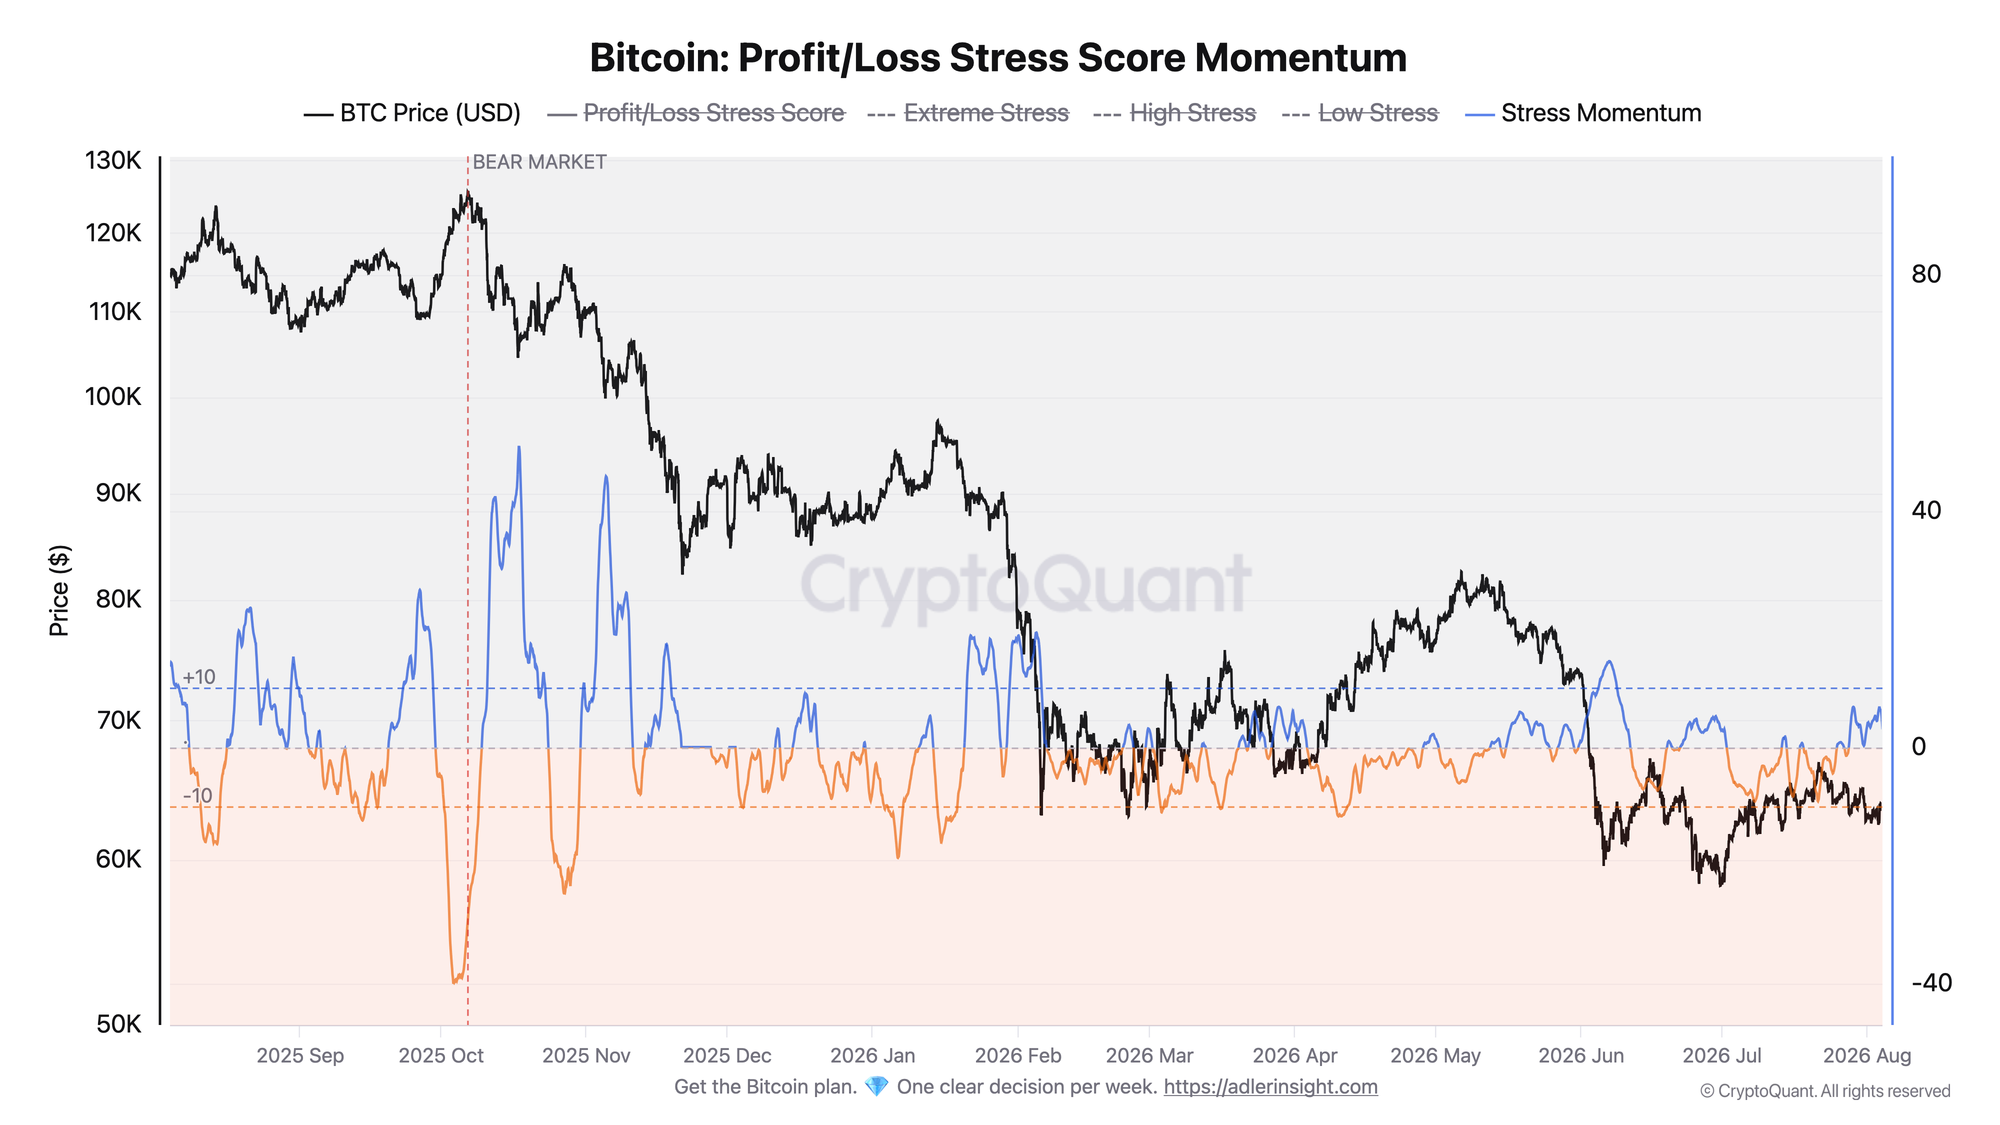
Stress Momentum is the seven-day change in the Score:
above 0, stress is increasing;
below 0, stress is easing;
a move beyond +/-10 indicates a rapid shift.
Over the past month, the Score fluctuated mainly within the high-stress zone, between 65 and 76, while momentum remained negative for most of the period, meaning stress was gradually easing. Momentum did not move beyond +/-10 at any point during the month, so there was neither a rapid deterioration nor a meaningful recovery. In late July, the Score crossed back above 70, while current momentum stands at +3 points, indicating that stress has started to increase moderately.
The second chart adds context to the first: one-year stress remains high, while weekly momentum shows that pressure is beginning to rise again after a month of easing. The main takeaway today is that the market remains in the high-stress zone but has not yet entered an extreme regime.
Invest in Bitcoin with discipline, not emotion. Start free and follow a clear, rules-based system built to keep fear, FOMO, and panic selling out of every decision.
FAQ
What does a Stress Score above 70 mean with Bitcoin near $63K? A significant share of supply was acquired above the current price and is now held at a loss. The market has entered the high-stress zone but has not yet reached the extreme imbalance associated with capitulation.
What signal would indicate a regime change? A sustained return below 70 with negative momentum would confirm easing stress and a recovery in the share of supply held in profit. A move toward 90+ with momentum above +10, by contrast, would indicate an accelerating deterioration.
CONCLUSIONS
The one-year picture remains stressful: the price is nearly half the level seen last August, while the Stress Score spent most of the year in the high or extreme zone. The past month brought a gradual easing, but momentum turned higher by early August, while the Score moved back above 70. The main trigger for improvement is a return below 70 with negative momentum. The main risk is an acceleration toward the 90+ zone if Bitcoin breaks below the monthly low near $61.5K.
Live Charts
Explore the metrics behind this brief with live, auto-updating charts:
Supply in Loss - Share of supply held at a loss to flag stress and capitulation zones.
Supply in Profit - Share of circulating supply in profit as a cycle-phase and euphoria gauge.
NUPL - Net unrealized profit/loss across holders, mapped into cycle sentiment phases.
SOPR - Spent Output Profit Ratio shows whether moved coins realize profit or loss.
Holder Behavior - All holder profitability and supply-cohort charts in one view.