


🎧 Morning Brief #224 - audio debate
Local stress has picked up again - the second impulse in three days, and it remains driven by a single component. The first chart shows the scale of the increase against previous peaks, while the second shows which driver caused it.
TL;DR
Local stress rose to 16 points. The impulse was driven almost entirely by price movement, while exchange flows and derivatives do not confirm it.
Bitcoin Local Market Stress Index

The chart shows when local market stress emerges.
Over the past few hours, the index formed a new impulse and reached a local peak of 16. This is already the second spike in three days: on July 28, the index reached 52 and entered the Elevated zone, after also rising on July 25 and 27.
The current move extends the series of July stress spikes, but it is about one-third the size of the July 28 spike and nowhere near the June extreme. The key question is not the index reading of 16 itself, but which components produced it. The mix of drivers determines whether the impulse remains in the Calm zone or can move above 40.
Bitcoin Local Stress Drivers
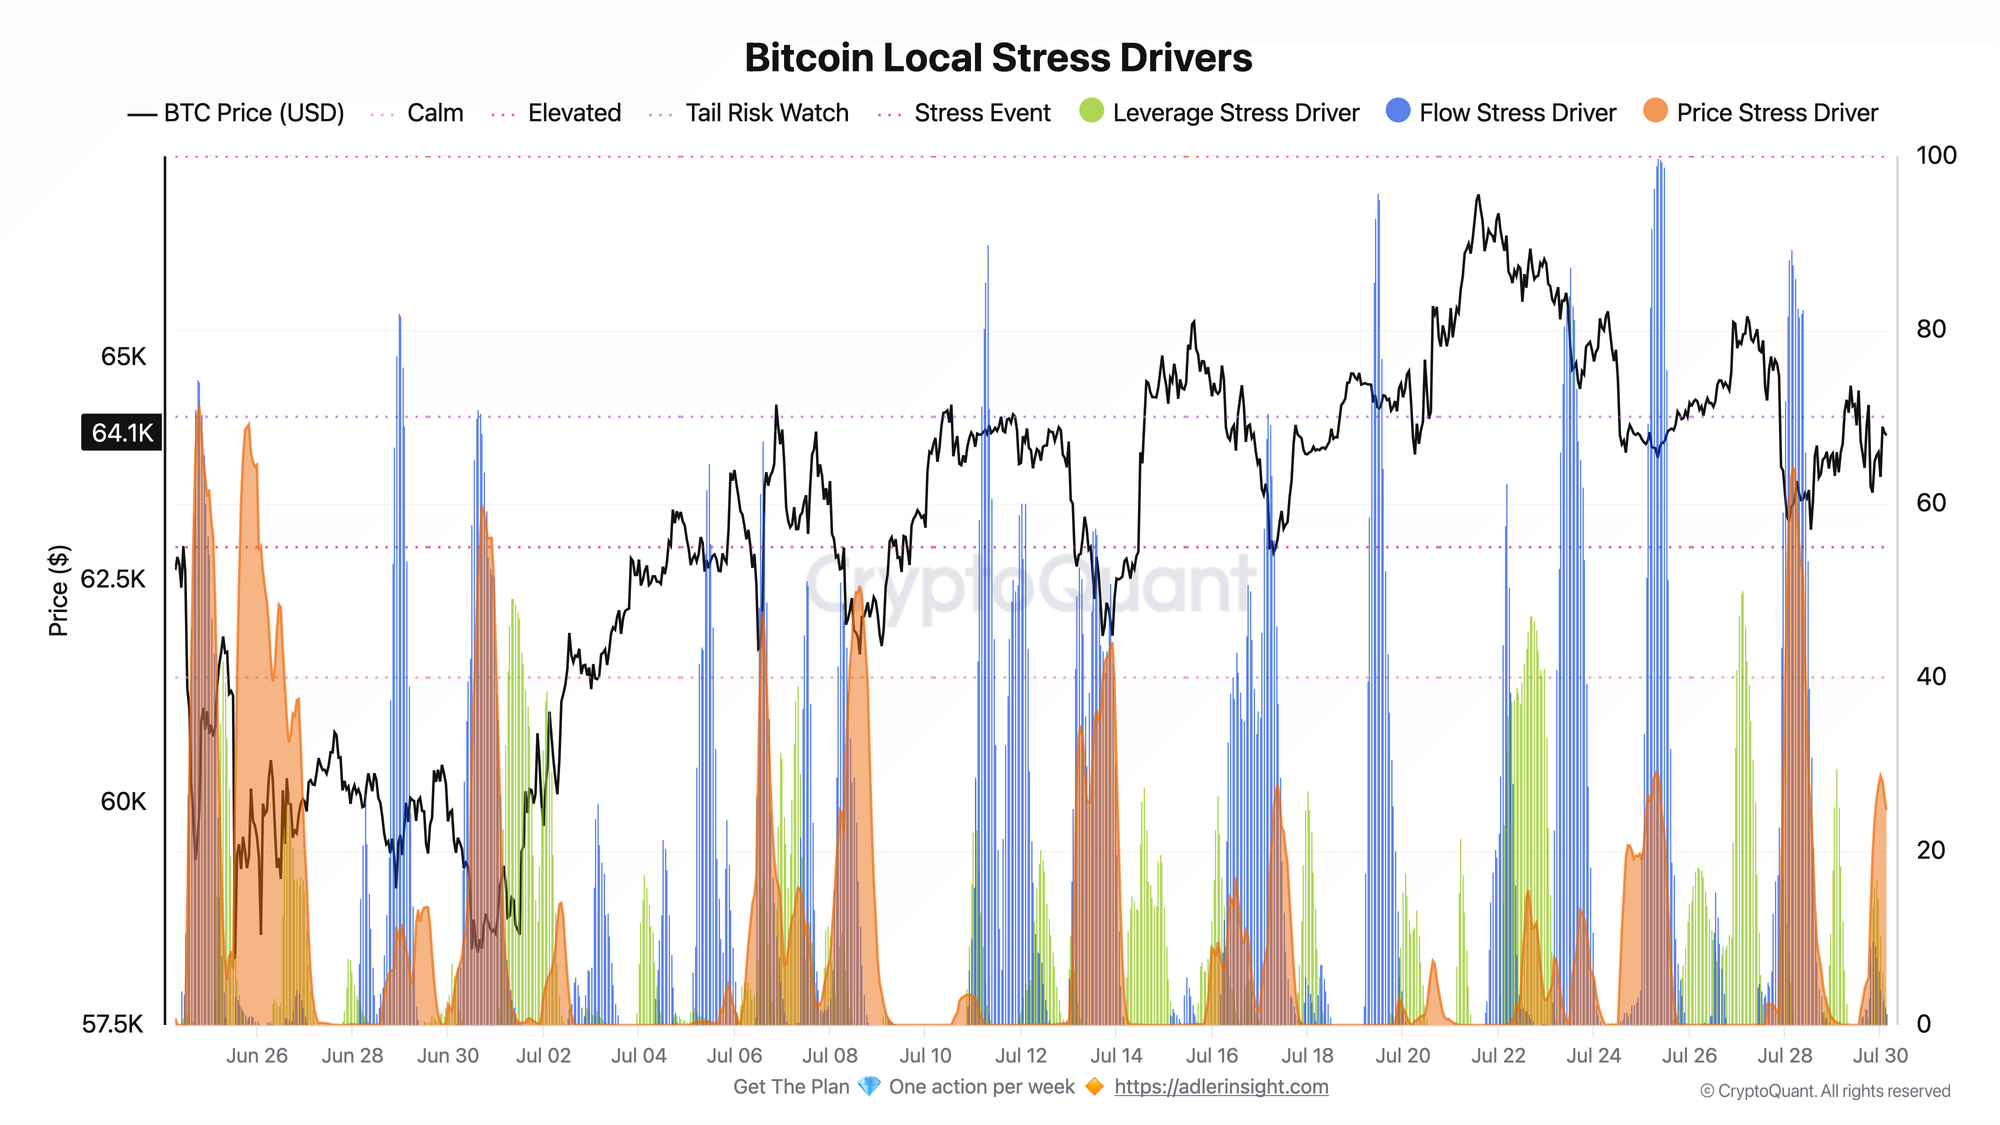
The second chart shows what is driving the stress. The index consists of three components on a scale from 0 to 100: Price Stress, Flow Stress, and Leverage Stress.
Price Stress is the leading component today. It measures how far the current price dynamics deviate from the previous 90 days.
A high reading means that elevated downside volatility, a local drawdown, and a persistent majority of negative hours are occurring at the same time.
The pattern across all major spikes is the same: the index moved above 50 only when exchange flows joined the downside price stress. There is no flow pressure now, which is why the impulse stalled at 16.
The second chart explains the shape of the first: the rise is real, but it is being sustained only by downside price stress, while exchange flows and derivatives leverage are not participating.
Reading the signal is not enough - you need to act on it. Weekly Engine turns on-chain data into one clear decision per week, with risk caps and invalidation built in. Start free.
FAQ
Why is the index only at 16 if stress is "rising"?
Because only the price component is rising, while flows and leverage remain quiet. The model requires spot sellers and derivatives to join the price move. Without that confirmation, the spike remains in the Calm zone and quickly loses momentum, which is exactly what we are seeing.
What would turn this impulse into real stress?
A rise in Flow Stress while Price Stress remains elevated. This is how the moves developed on July 28, when Flow Stress reached ~88, and on June 4, when price and flow pushed the index to 71. As long as Flow remains low, an escalation above 40 is unlikely.
CONCLUSIONS
Late July has been marked by regular stress spikes. So far, they have been driven only by price stress, without pressure from exchange flows or derivatives. The main trigger for further deterioration is a rise in Flow Stress.
Live Charts
Explore the metrics behind this brief with live, auto-updating charts:
Exchange Netflow - Net BTC moving to and from exchanges across positive and negative flow regimes.
Funding Rates - Perpetual futures funding to track long-side or short-side leverage pressure.
Open Interest (BTC) - Total futures positioning and 7-day BTC-denominated change.
Coinbase Premium Index - Coinbase vs global market premium as a proxy for US spot demand pressure.
Fear & Greed Index - Composite market sentiment for risk appetite and sentiment extremes.