


🎧 Morning Brief #223 - audio debate
Bitcoin is trading around $64K and remains below levels seen a week ago. At the same time, exchange flows show no clear directional shift in supply: BTC inflows have fallen toward multi-year lows, while the net balance between inflows and outflows remains near zero.
TL;DR
Price weakness has not been accompanied by an increase in supply on exchanges. BTC inflows continue to decline, while Netflow remains neutral. Coins are not accumulating on exchanges in volumes that would point to rising sell-side pressure, but there is also no meaningful reduction in liquid supply that could support the price.
Bitcoin Exchange Inflow
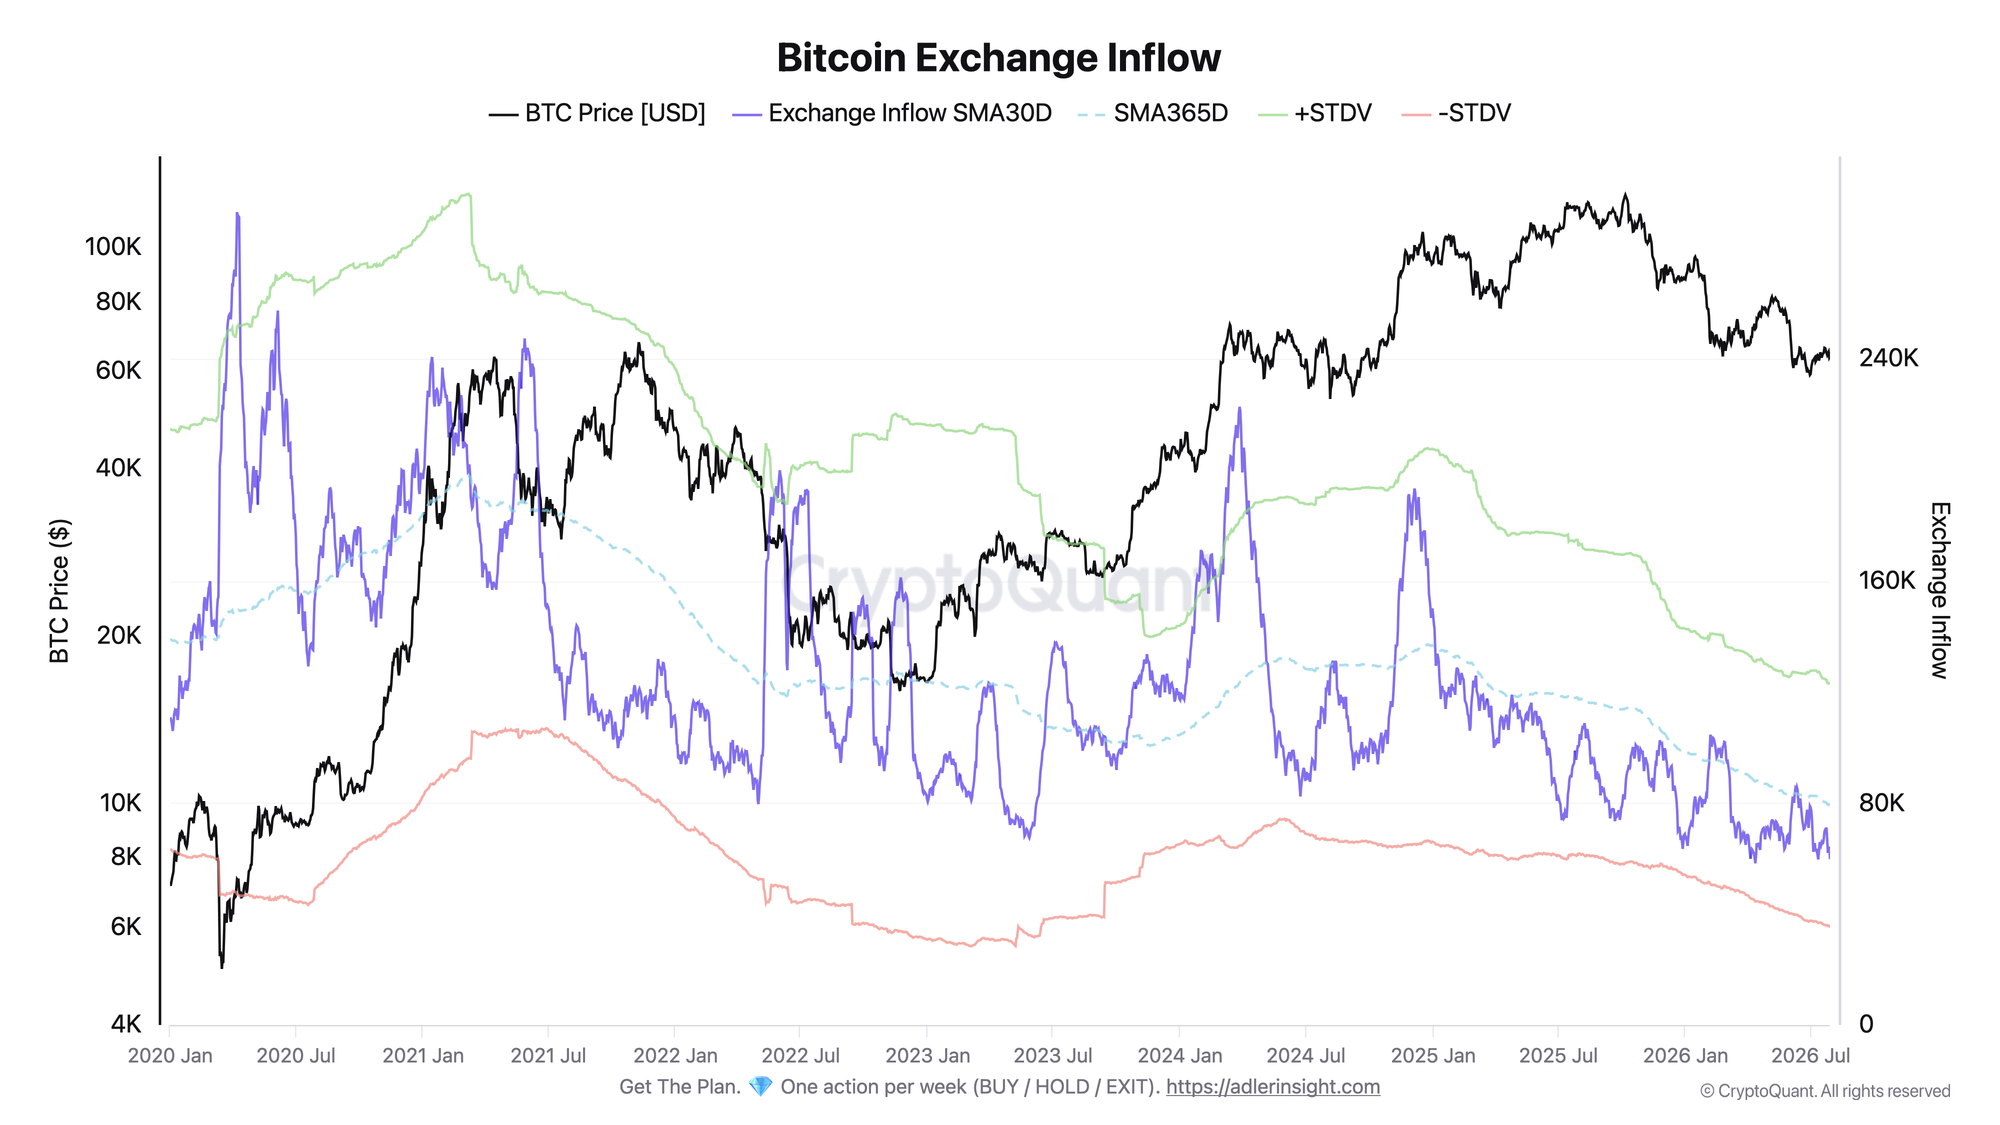
The metric shows the average amount of BTC sent to exchange addresses over the past 30 days. The higher the value, the more coins are being transferred to exchanges.
Inflows currently stand at around 60K BTC. This is roughly 76% of the annual average near 79K BTC and is close to the lowest level across the full available data range. The historical low of 58.3K BTC was recorded in April 2026.
A year ago, inflows were near 100K BTC. Over the past twelve months, the volume of coins moving to exchanges has fallen by roughly a quarter.
The metric remains above the lower standard deviation band, which is near 35K BTC. The current setup therefore reflects a sustained decline in activity, but it is not yet statistically extreme.
Low Inflow does not determine market direction on its own. Inflows may be offset by outflows, while some transfers may be linked to internal exchange operations. Still, declining inflows show that the potential supply of BTC on exchanges is not increasing.
Bitcoin Exchange Netflow
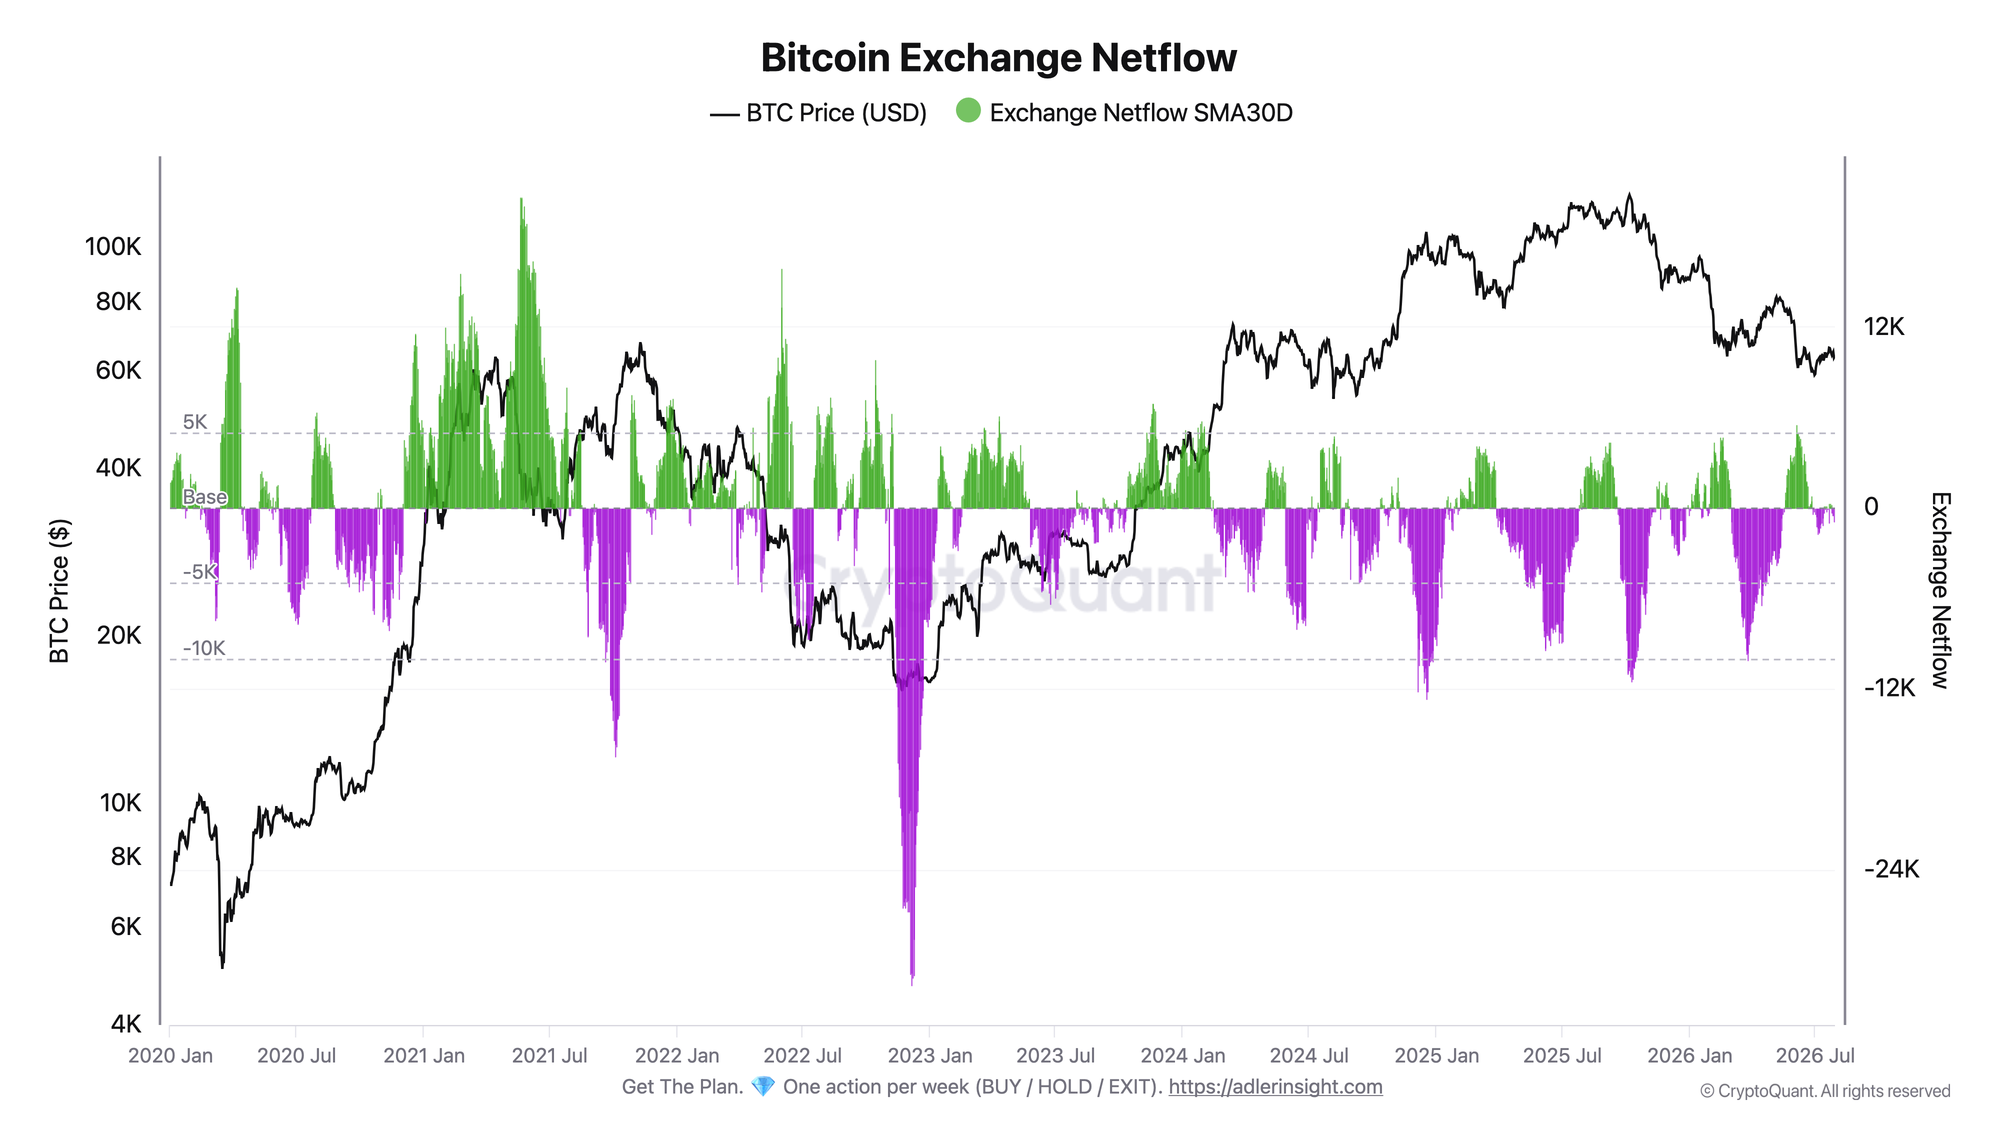
Netflow is calculated as the difference between BTC inflows and outflows. A positive value means coins are accumulating on exchanges. A negative value means outflows exceed inflows.
Netflow is currently near -1.3K BTC. A week earlier, it was slightly positive at around +0.3K BTC.
The monthly average balance remains moderately negative, but it is still far from the annual low of -11.5K BTC recorded in October 2025. Exchanges are not accumulating additional supply, but there is also no large-scale withdrawal of coins that could create a shortage of liquid supply.
A rise in sell-side pressure would be signaled by a simultaneous increase in Inflow and a sustained move in Netflow into positive territory. A constructive supply-side signal would require the opposite setup - persistently negative Netflow and a noticeable reduction in coins held on exchanges.
Neither scenario is currently in place. Inflows are near their lows, while the net balance remains close to zero. Exchange flows therefore do not confirm stronger selling, but they are also not creating a meaningful supply shortage capable of supporting the price on its own.
Protect capital first. Capture upside second - start 7 days free. Built for long-term investors who want performance, not stress.
FAQ
Why is low exchange inflow not automatically a bullish signal? Because Inflow only shows coins entering exchanges and does not account for outflows. A large inflow may be offset by BTC withdrawals or linked to internal exchange transfers. Netflow is needed to assess the final balance.
What would indicate rising sell-side pressure? A simultaneous increase in Inflow and a sustained move in Netflow above zero. This would mean that coins are not only entering exchanges but also remaining there, increasing the potential supply available for sale.
What would indicate a reduction in liquid supply? Persistently negative Netflow, with outflows clearly exceeding inflows. The balance is currently too close to zero to suggest that a meaningful shortage is forming.
CONCLUSIONS
Exchange flows remain neutral. BTC inflows are near multi-year lows, while the net balance between inflows and outflows remains close to zero.
The current price weakness is not accompanied by an accumulation of coins on exchanges and is not yet confirmed by stronger selling through this channel. At the same time, neutral Netflow does not show a meaningful reduction in liquid supply that could support the price.
The main signal of rising sell-side pressure would be a simultaneous increase in inflows and a sustained move in Netflow into positive territory.
Live Charts
Explore the metrics behind this brief with live, auto-updating charts:
Exchange Netflow - Net BTC moving to and from exchanges across positive and negative flow regimes.
BTC US ETF Flow Monitor - US spot Bitcoin ETF daily flow, BTC-denominated accumulation, and fund leadership.
Coinbase Premium Index - Coinbase vs global market premium as a proxy for US spot demand pressure.
Funding Rates - Perpetual futures funding to track long-side or short-side leverage pressure.
Liquidity Flows - All exchange-flow, ETF, and spot-demand charts in one view.