


🎧 Morning Brief #222 - audio debate
The share of BTC supply in profit has risen from its June low of 47% to 56%, indicating less pressure on holders. However, the metric is still 12 percentage points below its level 90 days ago, so the current increase cannot yet be considered a sustained reversal.
TL;DR
Around 56% of BTC supply is now in profit, compared with 47% at the June low. Market structure has improved, but the 90-day change remains negative: the profitable supply base is recovering, yet it is still well below where it stood three months ago.
Bitcoin Percent Supply In Profit
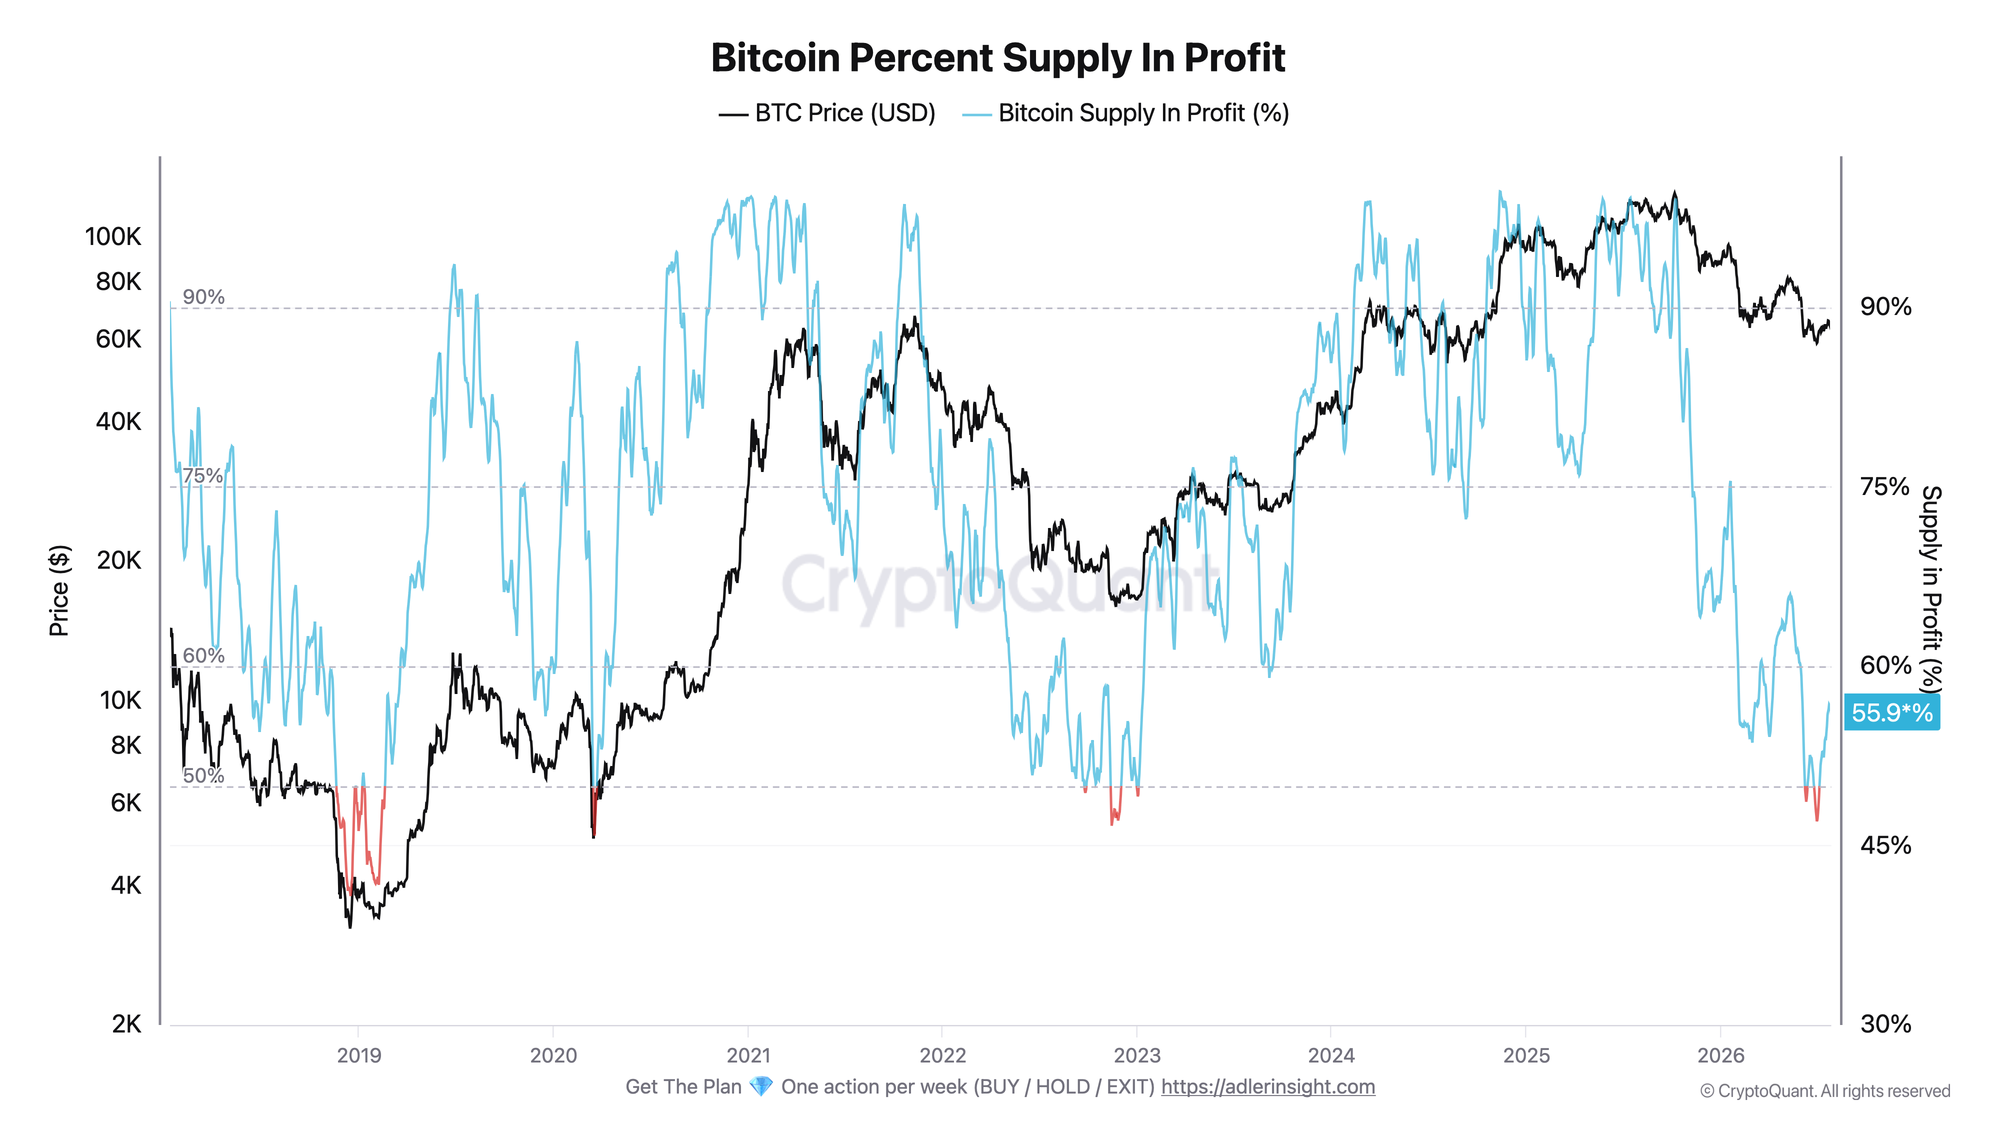
The metric shows what share of the supply is in profit at the current price. Values are expressed as percentages.
After reaching a June low of 47%, when more than half of the supply was underwater, the metric recovered to 56% with Bitcoin trading at $63K. The increase from the low was 8.9 percentage points. Before the latest session, the metric reached 56.5%, then fell by 0.6 points. The current level remains in the lower part of its historical range.
Stress among holders has eased, but the structure remains vulnerable. A sustained move above the 60% zone would strengthen the recovery base, while a return below 50% would bring the market closer to a capitulation regime again.
90D Change in Bitcoin Percent Supply in Profit
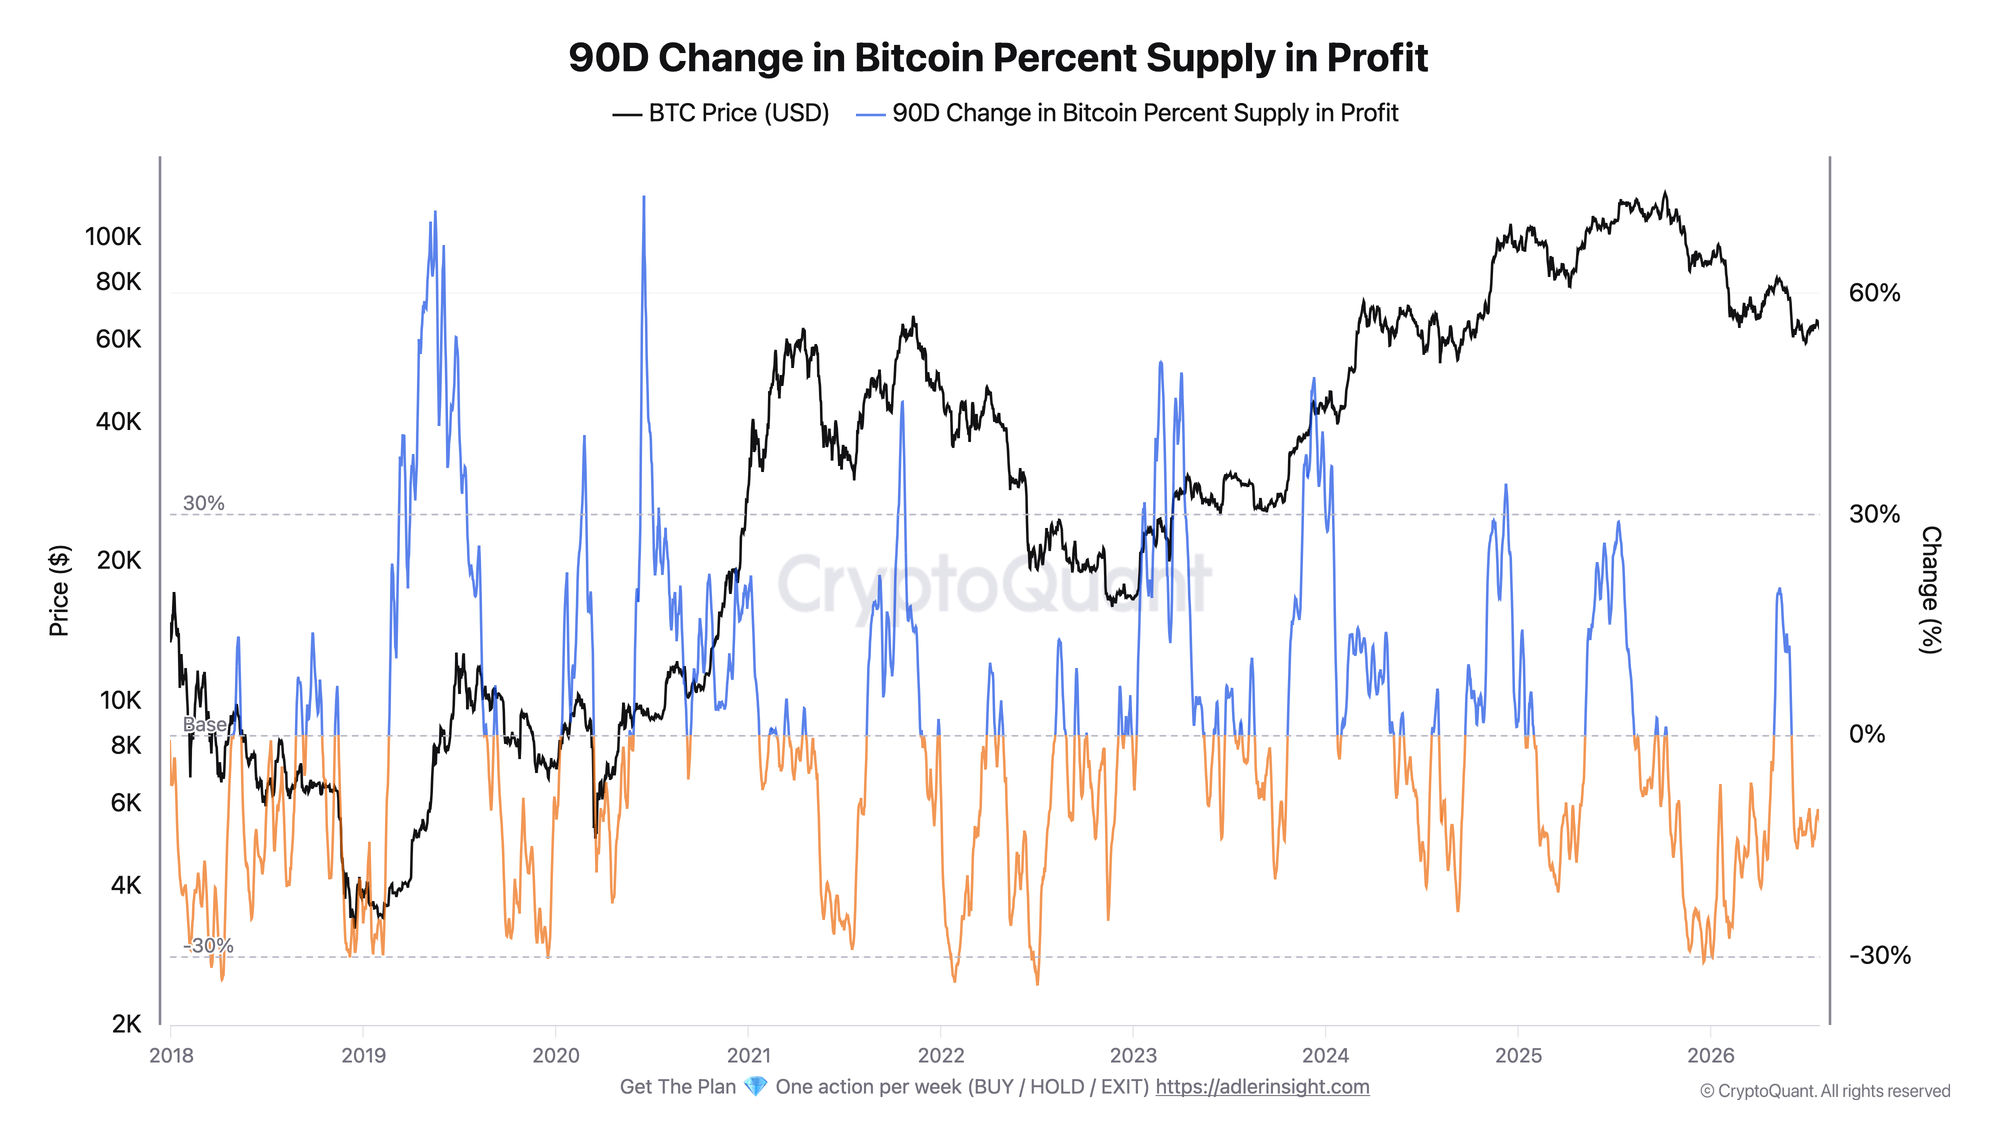
The metric tracks the change in the share of supply in profit over 90 days. Values above zero indicate an expansion in profitable supply, while values below zero indicate contraction.
The metric remains negative at -12 percentage points. This means the share of supply in profit is now 12 points lower than it was 90 days ago. Momentum improved from mid-July, rising from around -14 toward -10, but began falling again over the latest sessions. Meanwhile, the price held around $63-64K.
This divergence means the recovery is losing breadth: the price is holding its level, but the share of profitable supply is no longer improving relative to 90 days ago. The metric has not yet crossed the zero line.
A narrowing recovery while the price remains stable weakens the tactical setup shown in the first chart. The share of supply in profit is holding at 56%, but 90-day momentum does not confirm further expansion in the profitable supply base. A reversal signal would require more than a move above zero. Momentum would also need to accelerate steadily alongside the price.
The second chart adds context to the first: the share of supply in profit has recovered to 56%, but weakening momentum against a stable price shows that the recovery is narrowing rather than broadening. The main signal to watch now is a renewed rise in momentum alongside the price. Until then, the foundation of the rebound remains fragile.
Outperform Buy & Hold with a rules-based strategy - Start free. One weekly action, clear triggers, and invalidation levels. No guessing.
FAQ
What does the recovery in supply in profit to 56% mean? It means that around 44% of the supply is still underwater at the current price. The metric has recovered noticeably from its June low, but remains historically low, indicating that the recovery is incomplete.
What trigger would confirm a regime shift? The key signal would be a move in the 90-day change above zero alongside the share of supply in profit holding above the 60% zone. Until then, the rebound remains vulnerable to a return below 50%.
CONCLUSIONS
The share of supply in profit has recovered to 56% from its June low of 47%, but its 90-day change remains negative at -12 percentage points and has started falling again over the latest sessions.
The main trigger is a move in 90-day momentum into positive territory. The main risk is a decline in the share of supply in profit below 50%, which would bring the market closer to a capitulation phase again.
Live Charts
Explore the metrics behind this brief with live, auto-updating charts:
Supply in Profit - Share of circulating supply in profit as a cycle-phase and euphoria gauge.
Supply in Loss - Share of supply held at a loss to flag stress and capitulation zones.
NUPL - Net unrealized profit/loss across holders, mapped into cycle sentiment phases.
STH-SOPR - Short-term holder profit/loss behavior around the 1.0 breakeven threshold.
Holder Behavior - All holder profitability and supply-cohort charts in one view.