


🎧 Morning Brief #221 - audio debate
Bitcoin's valuation based on the MVRV Z-Score has fallen to multi-year lows, but the metric has still not entered negative territory. At the same time, 7-day realized P/L has shifted from a loss to a profit. We examine what both metrics say about the current market phase.
TL;DR
Bitcoin is in an undervaluation zone based on the MVRV Z-Score, but full capitulation, marked by the metric falling below zero, has not occurred. Realized P/L points to easing selling pressure, but there is still no confirmation of a cycle bottom through capitulation.
Bitcoin MVRV Z-Score
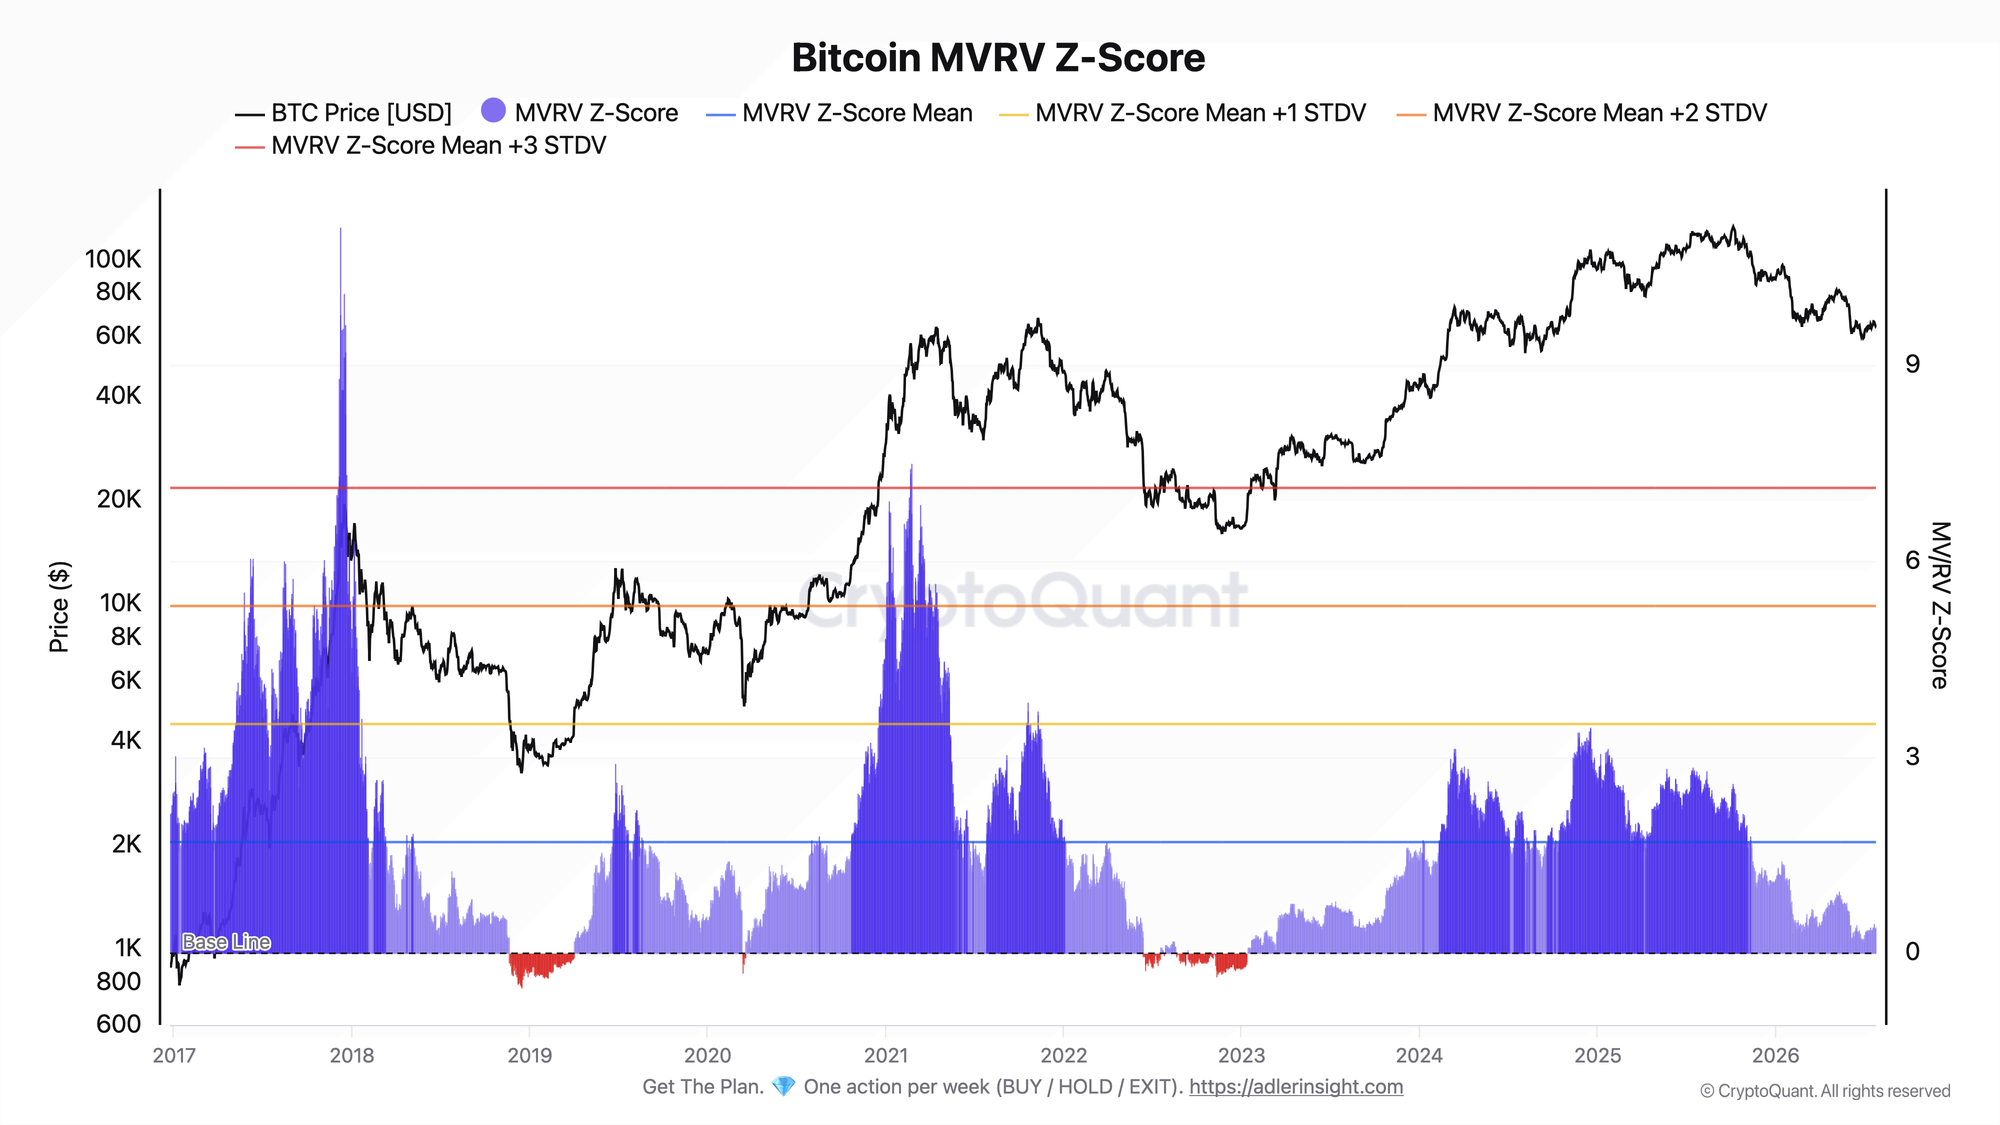
The MVRV Z-Score compares the network's market value with its realized value. The lower the reading, the greater the undervaluation, while the negative, or red, zone marks capitulation.
The metric is holding near 0.42 against a historical average of 1.7. It has remained below the average and close to the zero boundary for all of the past 30 days. Since late 2025, the reading has steadily declined toward the baseline, reaching a summer low of around 0.185 on June 30. However, the metric has still not entered the negative capitulation zone. Meanwhile, Bitcoin's price is consolidating in the $64K-$66K range.
This points to undervaluation without a capitulation-driven washout. Bitcoin has become cheaper, but classic capitulation has not occurred according to this metric. An upward reversal in the Z-Score toward the 1.7 average would be a signal of improvement. A break below the June low of 0.185 and a move into negative territory would signal further deterioration.
Bitcoin Realized Profit / Loss
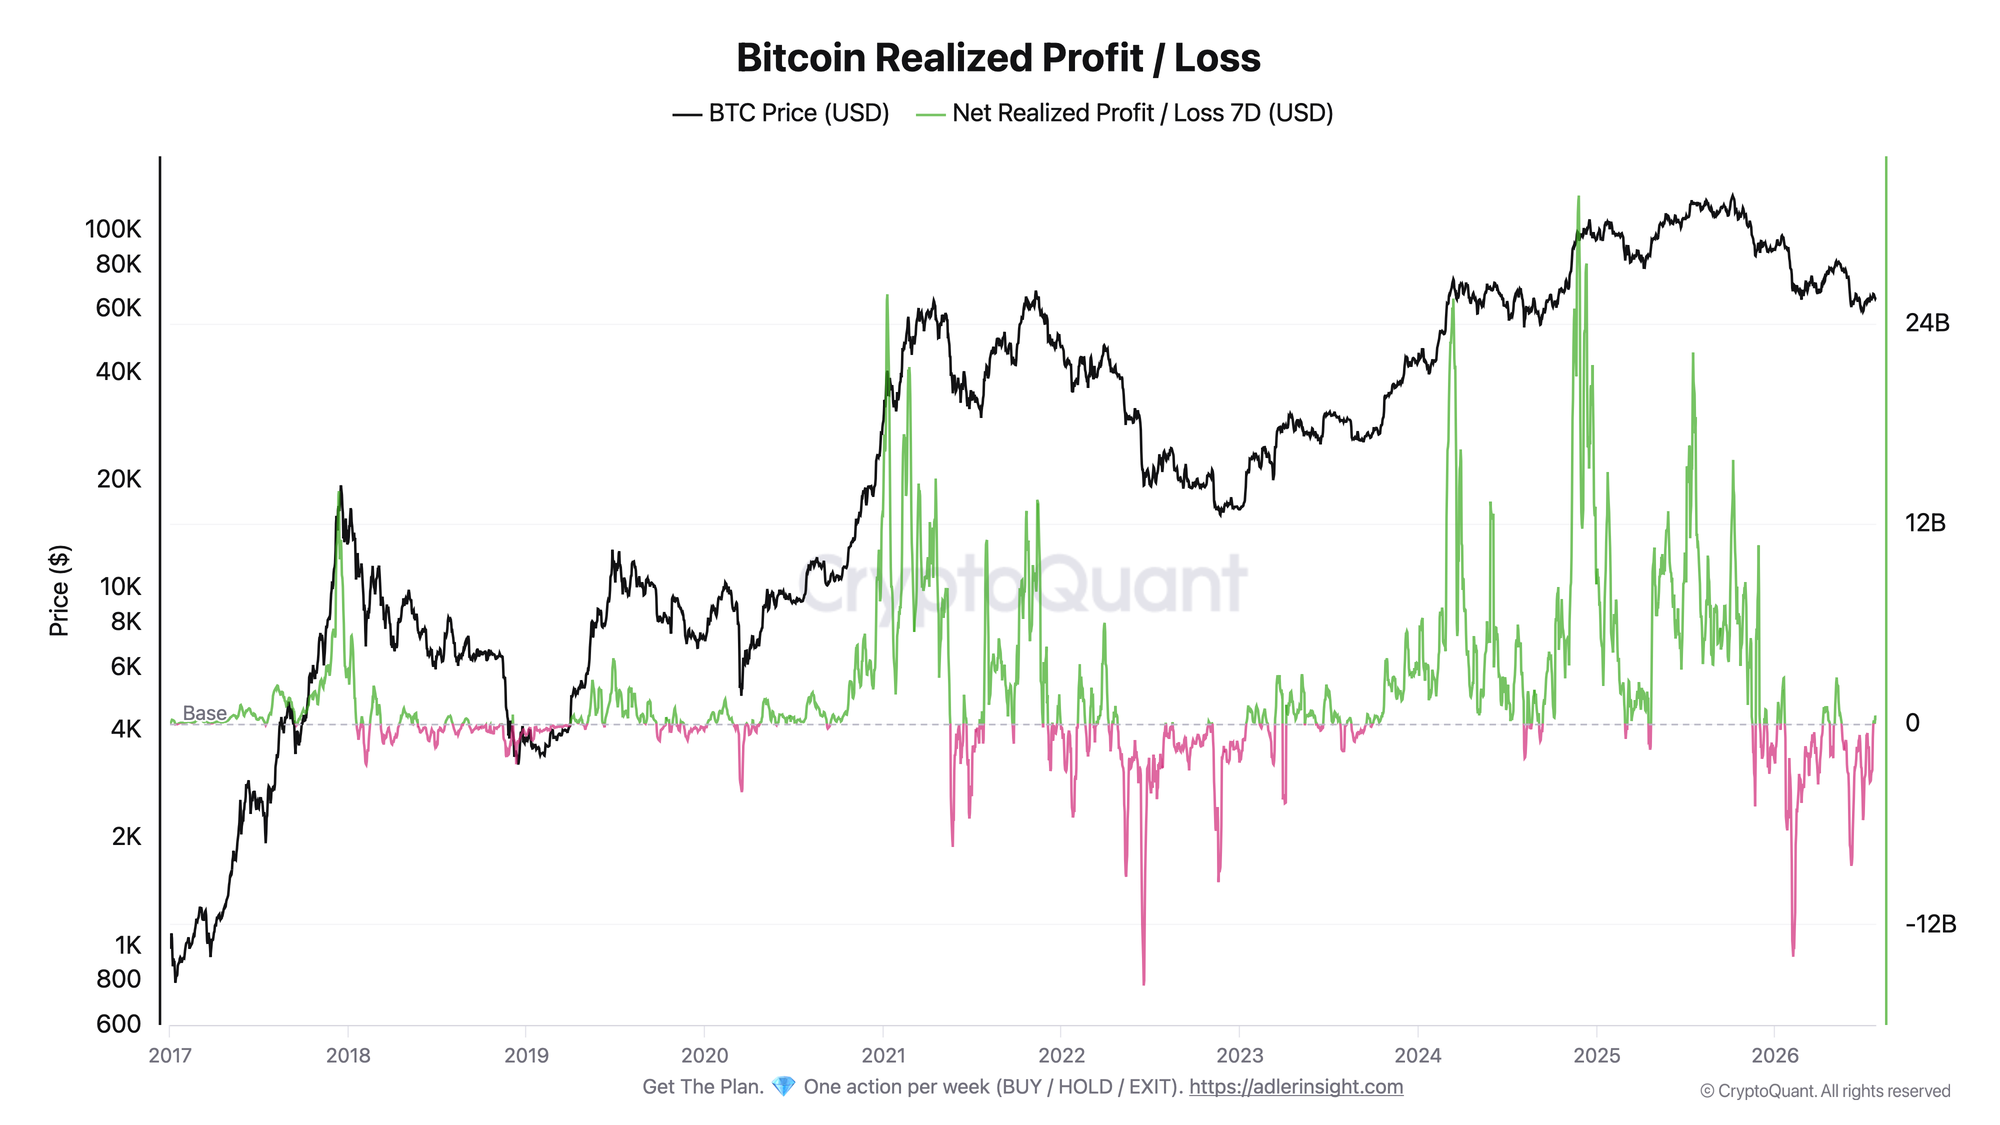
The metric shows the weekly net amount of realized profit and loss across the network, indicating who is realizing gains or losses and at what scale.
The flow remained negative for most of the past month - 23 out of 30 days. In June, the metric fell to -$8.5 billion, while losses reached around -$3 billion in mid-July. Over the past week, the metric has moved into positive territory and remained above zero. The current reading is +$239 million, following readings of +$400-$500 million in previous days.
The shift in the 7-day net flow into profit means that the phase of active loss realization has eased. A sustained reading above zero would support the stabilization phase. A return to prolonged losses would once again increase the risk of another wave of selling.
The second chart adds context to the first: selling pressure has eased slightly as P/L moved into positive territory, but this was not accompanied by a capitulation-driven washout in the Z-Score. The main takeaway today is that the price has fallen and is stabilizing in the short term, but there is no confirmed bottom through capitulation and no clear demand impulse.
Stop holding through every crash - start your 7-day free trial. Weekly Engine tells you when to stay in, when to step aside, and when risk is rising.
FAQ
With the Z-Score this low, has capitulation occurred? No. Capitulation in this metric is marked by a move into the negative, or red, zone. The Z-Score has only approached the zero boundary without breaking below it. This is undervaluation without a classic capitulation-driven washout.
What level would signal a regime change? An upward reversal in the Z-Score toward the 1.7 average, while 7-day realized P/L remains above zero, would confirm improvement. A break below the June low of 0.185, a move into negative territory, and a return of realized flows to prolonged losses would confirm deterioration.
CONCLUSIONS
Both metrics describe a cheap market that has not capitulated. The Z-Score is holding near 0.42 against a historical average of 1.7 and remains close to the zero boundary, but it has never entered negative territory. At the same time, weekly realized P/L points to easing selling pressure after shifting from prolonged losses to a moderate profit.
The current regime remains neutral: the market is in a zone of undervaluation and short-term stabilization, but there is no confirmed bottom through a capitulation-driven washout and no clear demand impulse.
The main trigger for an upward reversal is a recovery in the Z-Score toward its historical average while P/L remains above zero. The main risk is a break below 0.185, followed by a move into negative territory and a simultaneous return of realized losses. That combination would confirm full capitulation.
Live Charts
Explore the metrics behind this brief with live, auto-updating charts:
MVRV Ratio - Market value vs realized value to identify valuation regimes and cycle risk.
SOPR - Spent Output Profit Ratio shows whether moved coins realize profit or loss.
Supply in Loss - Share of supply held at a loss to flag stress and capitulation zones.
NUPL - Net unrealized profit/loss across holders, mapped into cycle sentiment phases.
Realized Price - Aggregate on-chain cost basis compared with BTC price and long-term trend.