


🎧 Morning Brief #220 - audio debate
We compare the current bear market phase with the 2022 cycle through realized profit and loss using 30-day moving averages. The February loss peak was the highest in Bitcoin's history, but loss-driven selling pressure has since fallen by more than half. Realized profit has also started to recover, although at a much slower pace.
TL;DR
The current bear market phase was accompanied by a record volume of realized losses. Capitulation-driven selling pressure has weakened significantly since the February peak, but there is still no sustained recovery in demand: losses are declining faster than profits are returning.
Bitcoin Daily Realized Profit 30DMA
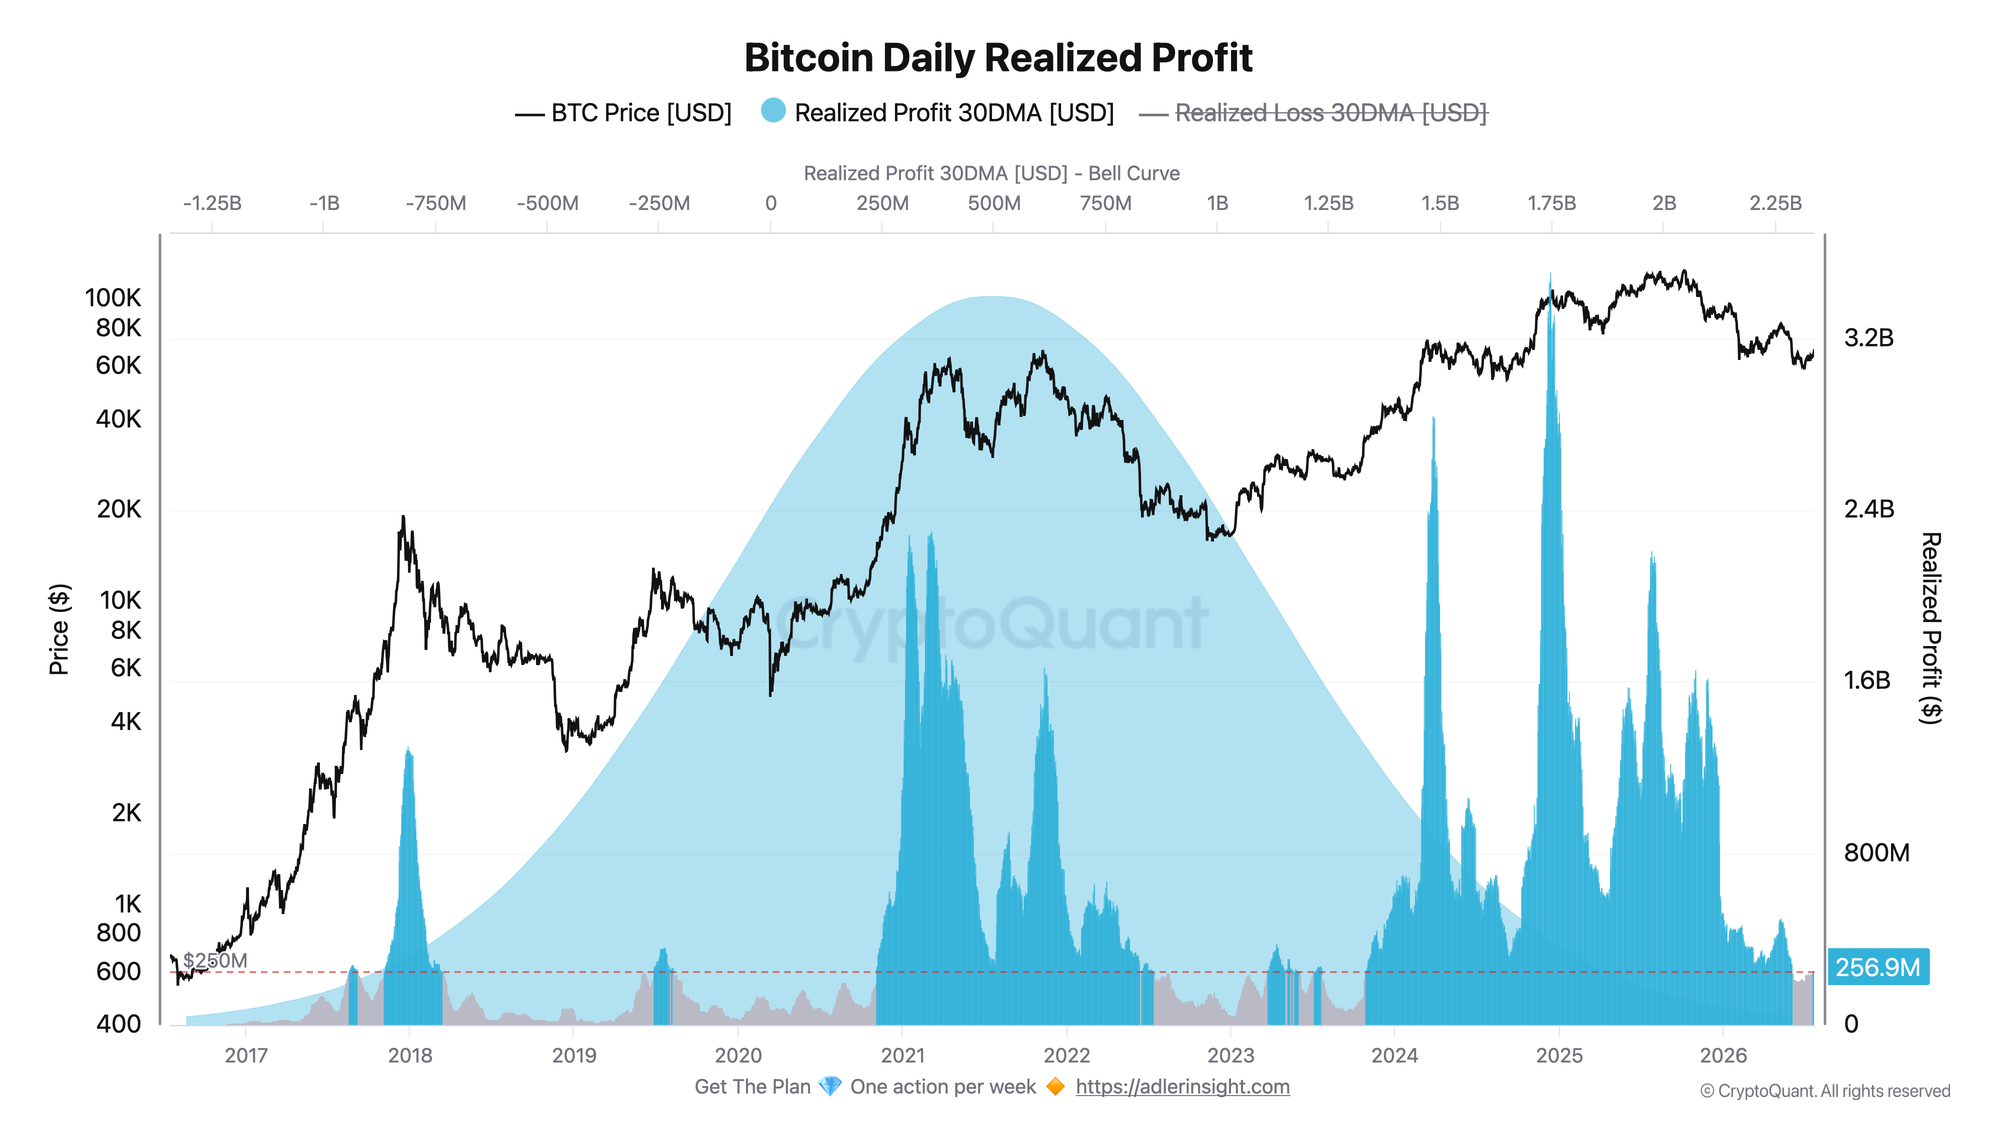
Realized profit on a 30DMA basis compared with the BTC price, USD.
As of July 23, realized profit stands at $257 million, compared with $3.51 billion at the December 10, 2024 peak. This represents a decline of 92.7%. Compared with the day of Bitcoin's all-time price high on October 6, 2025, when BTC traded at $124,710, the metric is 77.7% lower.
The local low was recorded on June 14, 2026, at $191 million. Since then, the metric has increased by 34.7%. For comparison, the absolute low of the 2022 cycle was $44 million on January 1, 2023, although Bitcoin's market capitalization was significantly lower at the time.
Profit-taking as a source of selling pressure has weakened significantly: the volume of coins being sold at a profit remains near the lower end of the current cycle's range. However, this does not mean that sellers have been fully exhausted or that demand has already recovered.
A sustained move in realized profit above $400-500 million would be a sign of lasting improvement, rather than the current rebound from the June low alone.
Bitcoin Daily Realized Loss 30DMA
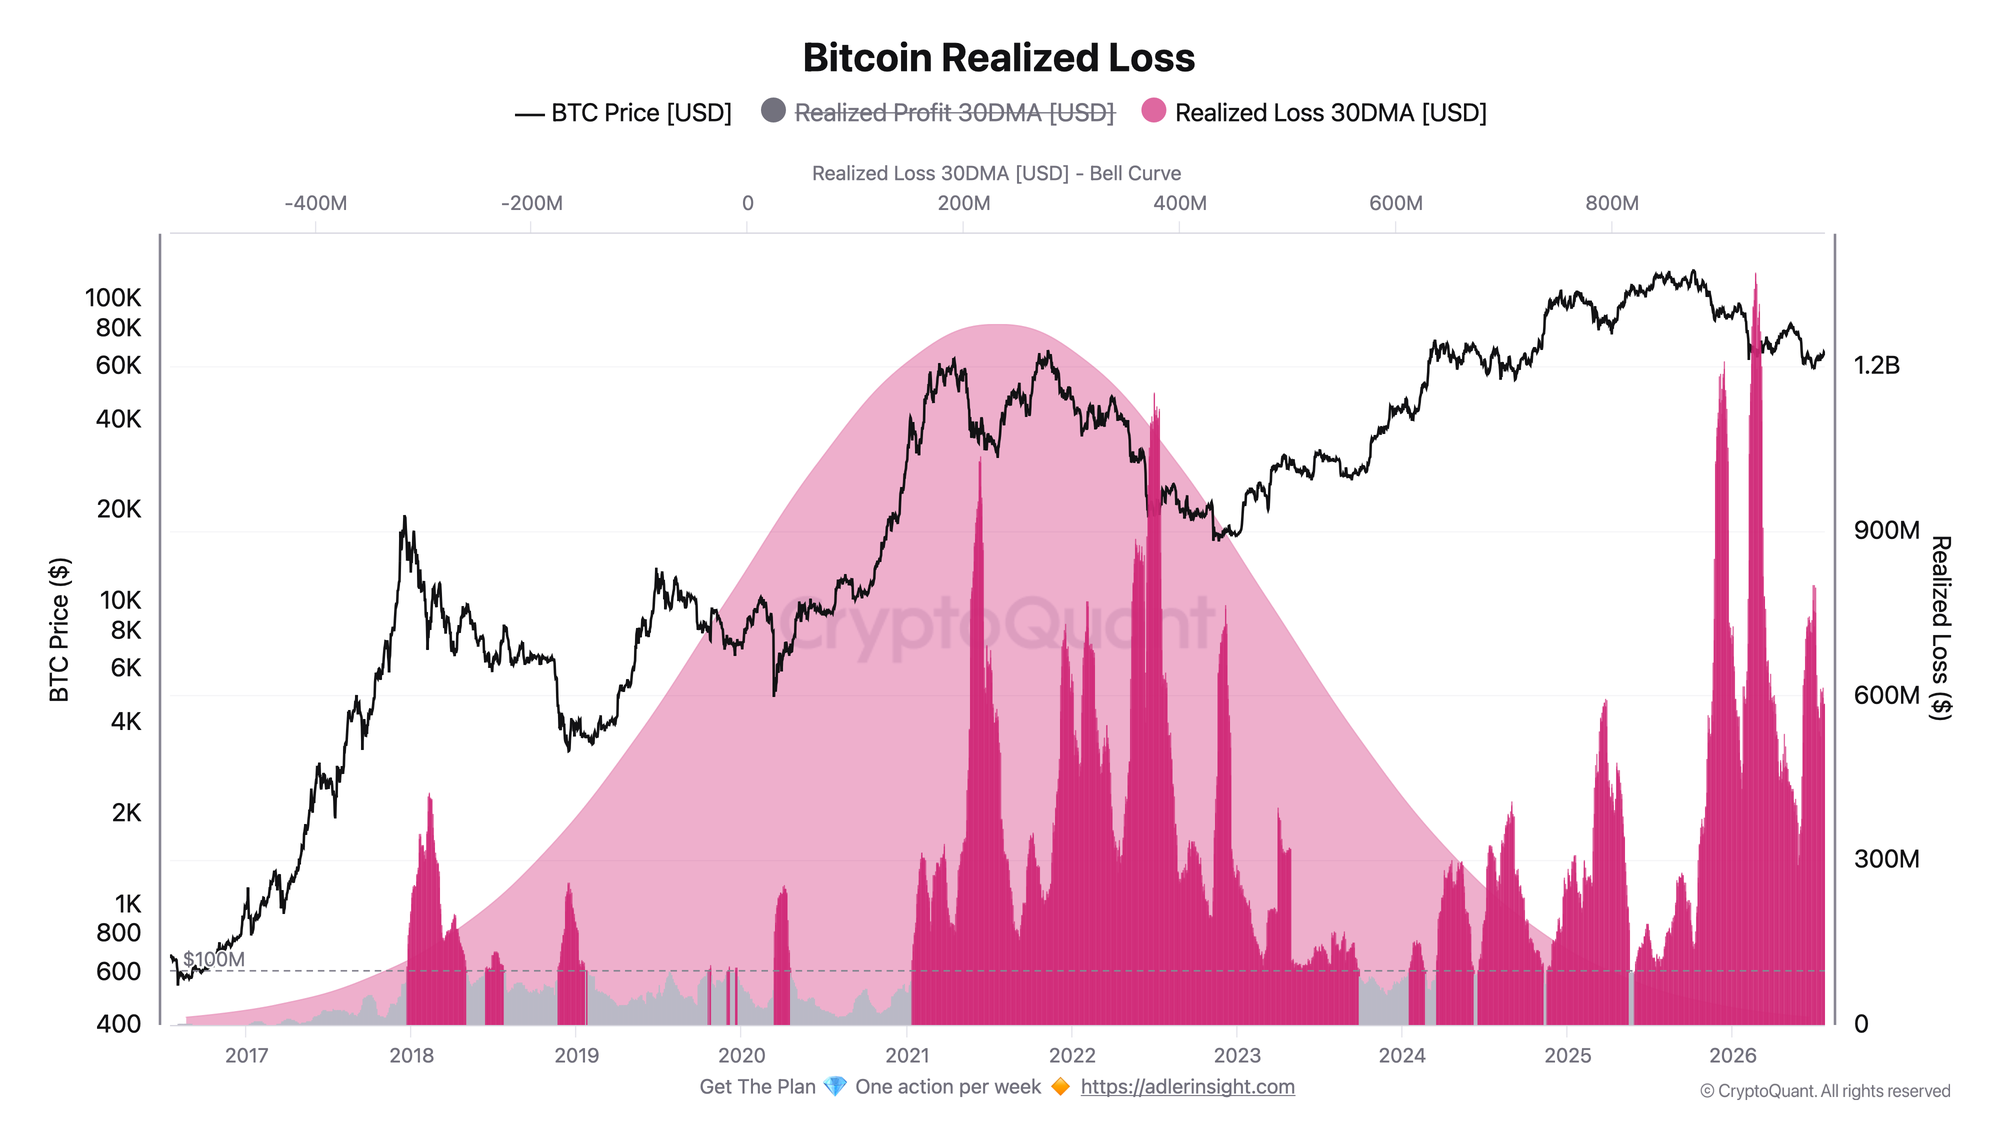
Realized loss on a 30DMA basis compared with the BTC price, USD.
On February 20, 2026, realized loss reached $1.37 billion. This was the highest value in the metric's entire available history and 19% above the 2022 cycle peak of $1.15 billion recorded on June 30, 2022.
The metric now stands at $597 million, 56.5% below the February peak. The current cycle price low of $58,535, recorded on June 30, 2026, coincided with realized losses of $804 million and the cycle-low profit-to-loss ratio of 0.26.
In 2022, this ratio fell as low as 0.13. Therefore, despite the higher nominal volume of losses, the relative imbalance between profit and loss in the current cycle has so far been less severe.
The absolute scale of realized losses reached a record high, but the relative depth of market stress remains below the 2022 level. A renewed decline in the profit-to-loss ratio below 0.26, together with a new low below the June price bottom, would signal further deterioration.
The second chart adds context to the first: realized loss has fallen by 56.5% from its peak, while profit is recovering much more slowly. As a result, the profit-to-loss ratio has increased from its low of 0.26 to 0.43, but it remains well below parity. Since the all-time price high, losses have exceeded profits on 190 of the past 291 days.
Invest in Bitcoin without emotional decisions - Start free. Deterministic signals built to remove fear, FOMO, and panic selling.
FAQ
Why does the record loss peak not indicate a deeper crisis than in 2022? Absolute values rise along with Bitcoin's market capitalization, so nominal figures from different cycles cannot be compared directly. The realized profit-to-loss ratio is more informative. In the current cycle, it has not fallen below 0.26, while in December 2022 it reached 0.13.
Can the capitulation peak be considered definitively behind us? No. The February reading remains the local peak so far, and realized loss has fallen by more than half. However, the peak can only be confirmed retrospectively if the market does not produce another wave of losses during a further price decline.
CONCLUSIONS
The current bear market phase went through a record surge in realized losses. Since February, the metric has fallen from $1.37 billion to $597 million, while realized profit has increased by 34.7% from its June low. The relative depth of stress remains lower than in the 2022 cycle: the minimum profit-to-loss ratio was 0.26, compared with 0.13.
It is still too early to conclude that capitulation has fully ended. The drawdown from the all-time high stands at 47.8%, the profit-to-loss ratio remains at 0.43, and losses have dominated profits on most days since October. These figures confirm that the acute phase of stress has eased, but they do not confirm a market reversal.
The main trigger for improvement will be a move in the profit-to-loss ratio toward parity, accompanied by an increase in realized profit above $400-500 million. The main risk is another acceleration in realized losses if Bitcoin breaks below the June low of $58,535, which would return the market to a regime of intensive loss realization.
Live Charts
Explore the metrics behind this brief with live, auto-updating charts:
SOPR - Spent Output Profit Ratio shows whether moved coins realize profit or loss.
Supply in Loss - Share of supply held at a loss to flag stress and capitulation zones.
STH-SOPR - Short-term holder profit/loss behavior around the 1.0 breakeven threshold.
MVRV Ratio - Market value vs realized value to identify valuation regimes and cycle risk.
Holder Behavior - All holder profitability and supply-cohort charts in one view.