


🎧 Morning Brief #219 - audio debate:
US spot demand has remained at a discount for 78 consecutive days, but the discount is narrowing and weekly flows into US spot ETFs have turned positive again. Both charts point to the same process: pressure is easing faster than sustained demand is recovering.
TL;DR
The US spot market is emerging from a period of maximum pressure. The Coinbase discount has not disappeared, but it has narrowed significantly, while the return of positive ETF flows confirms that the market structure is improving.
Bitcoin: Coinbase Premium Index
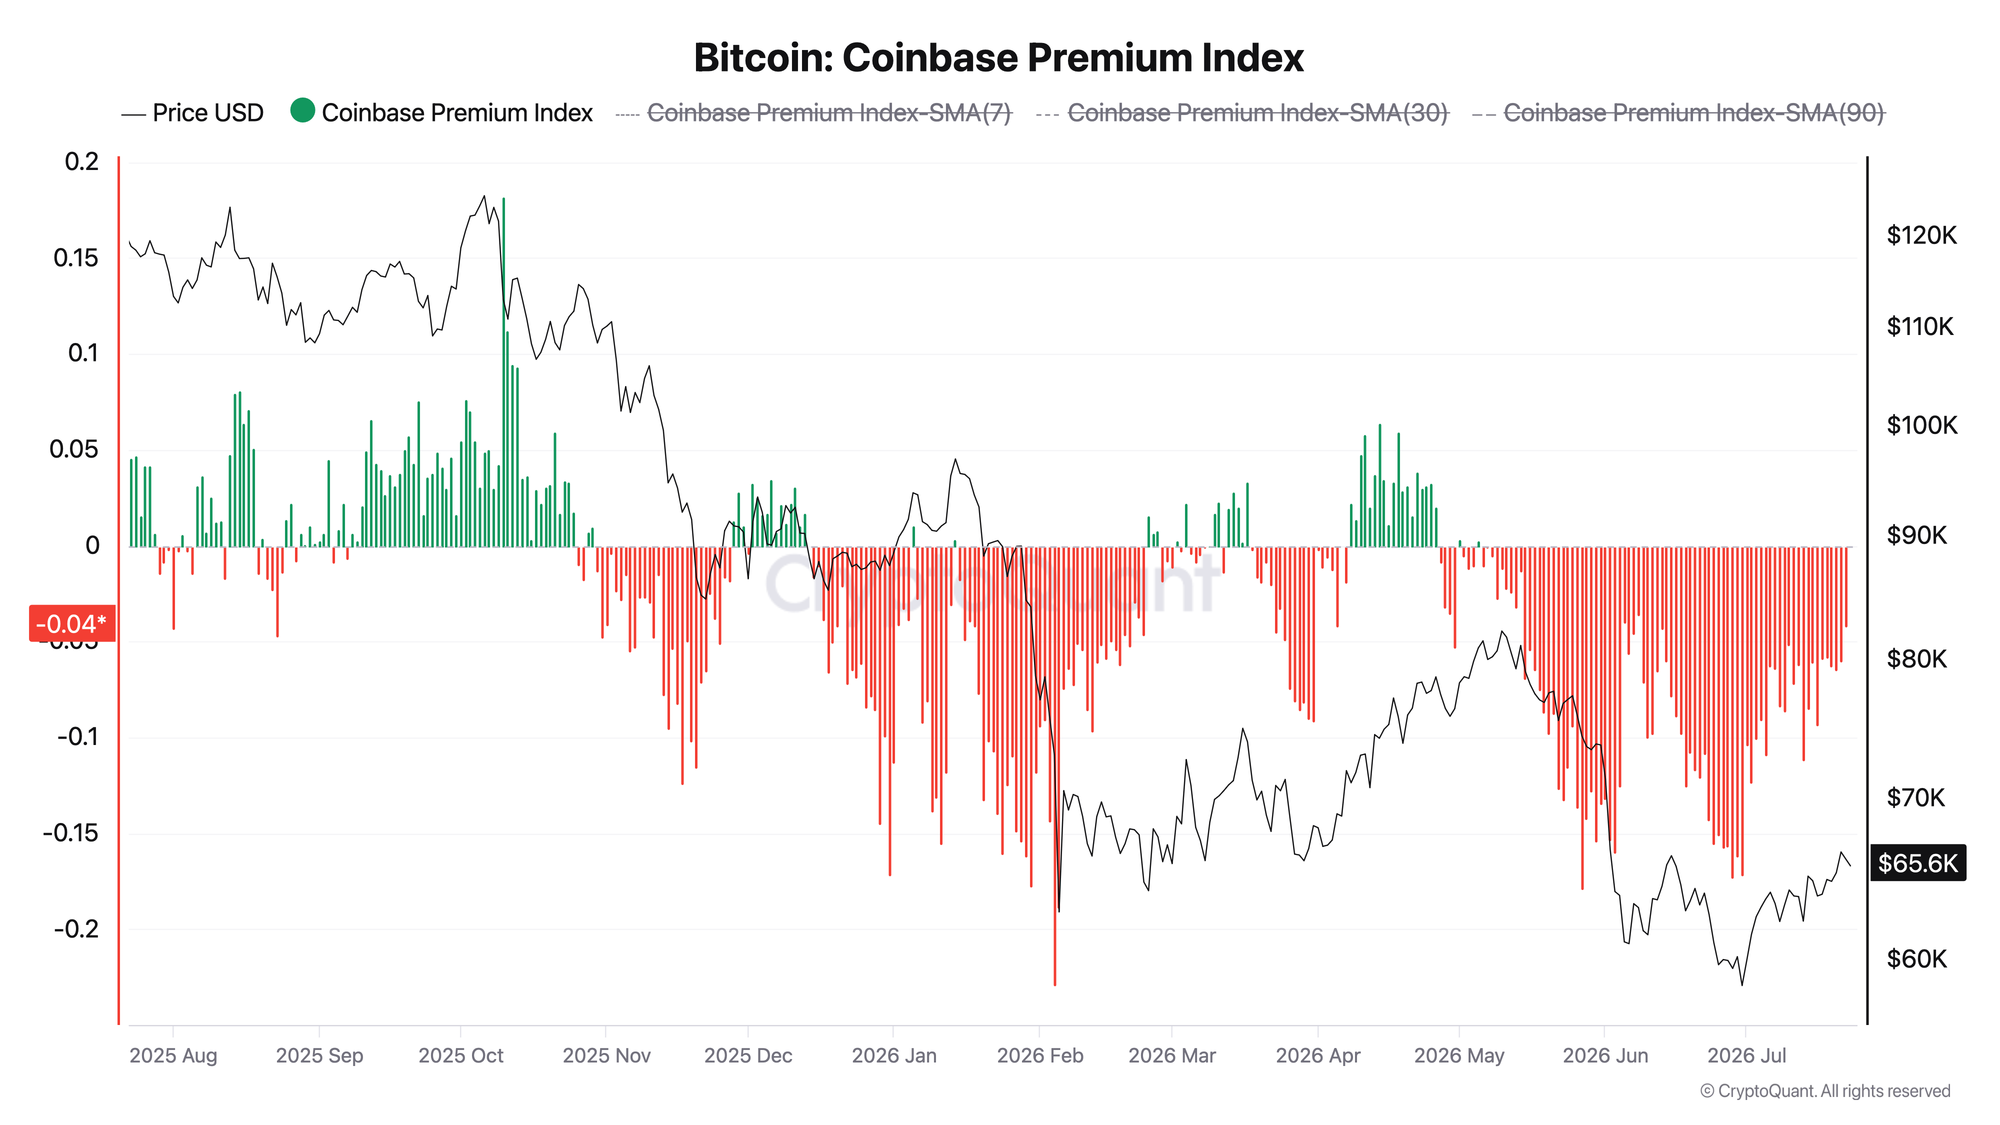
The Coinbase Premium Index measures the difference between the BTC price on Coinbase and Binance and is used as a proxy for the strength of US spot demand.
The index closed at -0.042 on July 22 and has remained negative for 78 consecutive days. The last positive reading was recorded on May 5. At the same time, the current reading is the strongest since June 8, or in the past 44 days.
The seven-day average improved from -0.110 a month ago to -0.063, while the monthly average improved from -0.110 in June to -0.078 in July. The index has recovered by approximately 80% from its February low of -0.229.
The structure remains negative, but the direction has changed: US buyers are no longer lagging offshore liquidity by the same margin. A move into positive territory and several consecutive sessions above zero would confirm a regime shift. A drop in the seven-day average below -0.10 would signal renewed deterioration.
Daily US Spot BTC ETF Flow
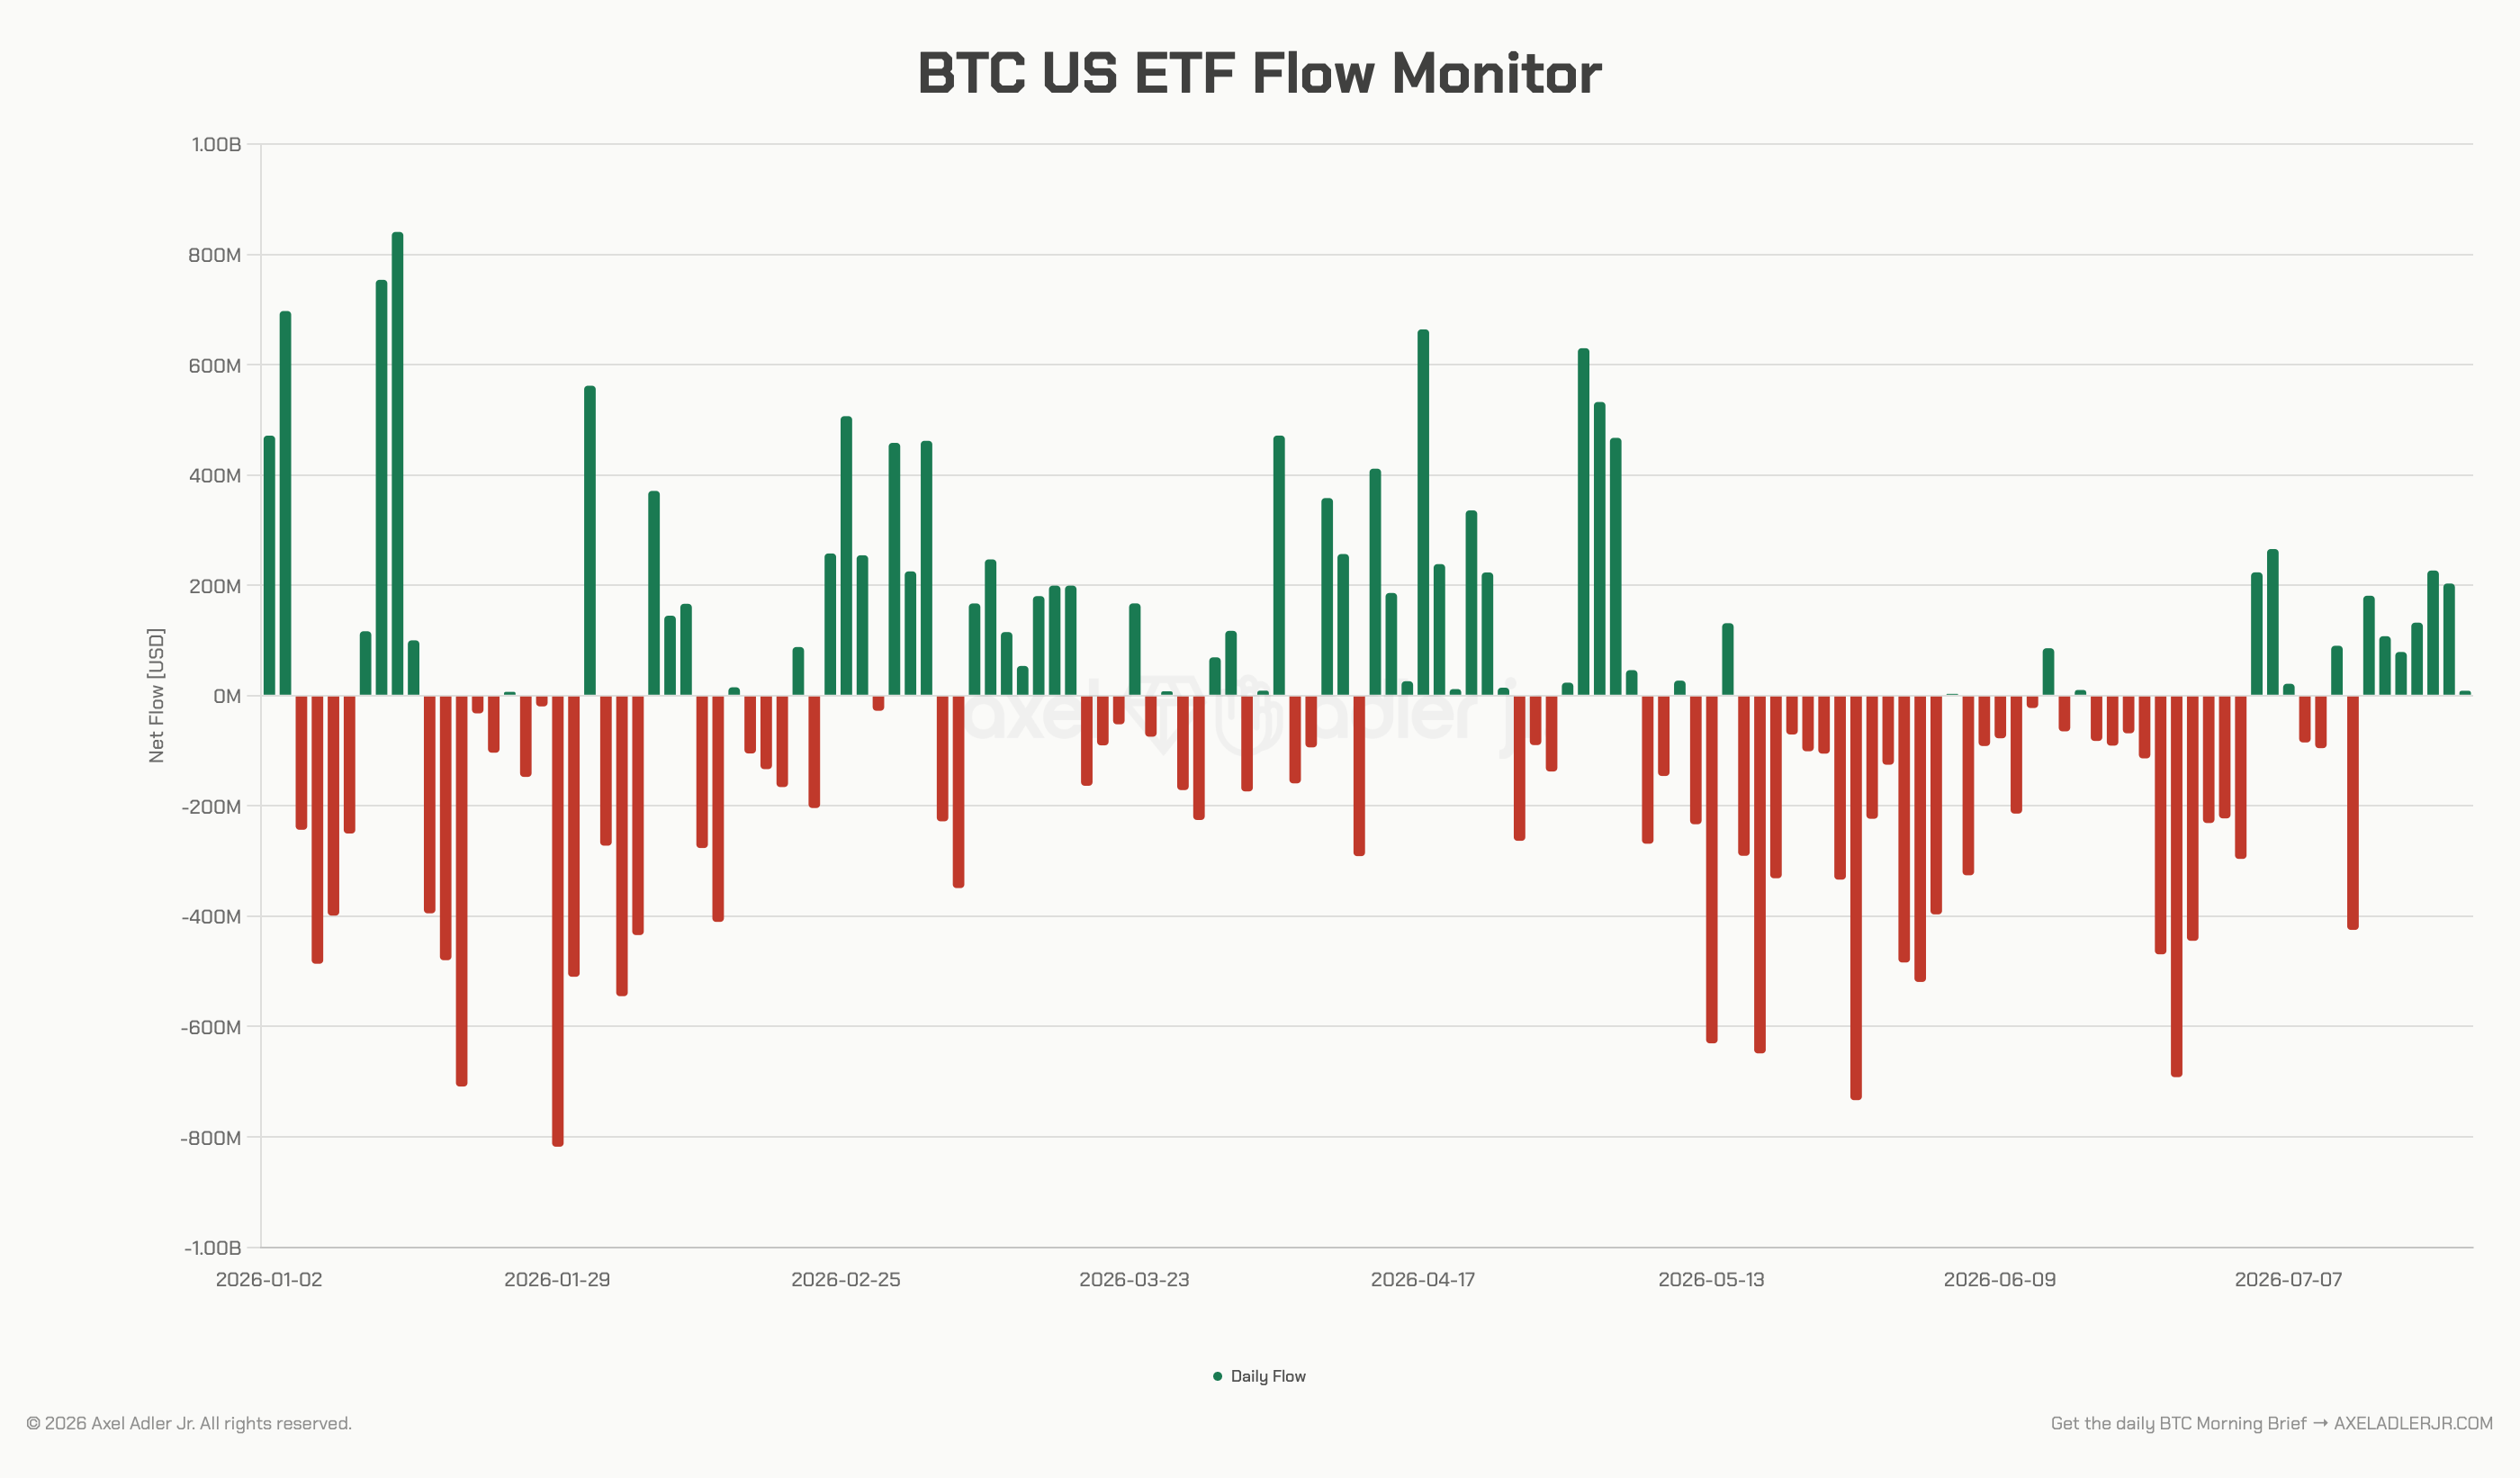
Daily and weekly net flows into US spot BTC ETFs, USD.
The latest session brought in +$9M, or 133 BTC. Weekly net inflows reached +$439M, or 6.66K BTC, marking the first clearly positive stretch after outflows dominated May and June.
Cumulative inflows since the launch of the ETFs have reached $51.84B. The funds hold 611.98K BTC, currently valued at $40.46B. The ETF cohort’s realized price stands at $84,714, while BTC is trading near $66,110. This means the cohort’s average position is sitting on an unrealized loss of approximately 22.0%.
The return of positive flows while the cohort remains deeply underwater shows that new allocations continue to enter below the average cost basis. However, this does not necessarily mean that existing holders are averaging down, as the inflows may also be coming from new participants.
The main risk lies above the current price. As BTC approaches the $84.7K realized price, part of the cohort may use the recovery to exit at breakeven, adding to market supply.
Together, the two charts describe the same process: the Coinbase discount is narrowing as positive weekly ETF flows return. US demand has stopped retreating, but it has not yet shifted into a sustained advance. The key signal is not the absolute level of either indicator, but the fact that both are improving at the same time.
Outperform Buy & Hold with a rules-based strategy - Start free. One weekly action, clear triggers, and invalidation levels. No guessing.
FAQ
Why are a negative Coinbase premium and positive ETF flows not contradictory? ETF flows reflect decisions by institutional investors with a time horizon of days or weeks, while the Coinbase premium measures the immediate balance of supply and demand in the spot market. ETF flows have already reversed, while the spot premium is only beginning to close the gap.
What would confirm a regime shift? The premium index moving into positive territory while weekly ETF net flows remain above zero. A return to negative weekly flows alongside a widening Coinbase discount would restore the May-June regime.
CONCLUSIONS
US spot demand is emerging from a period of maximum pressure. The Coinbase discount has narrowed to -0.042 from its February low of -0.229, while weekly net inflows into spot ETFs have returned to +$439M after two months dominated by outflows.
This is a neutral regime with an improving bias. The premium has remained below zero for 78 consecutive days, so a sustainable reversal has not yet been confirmed.
The main trigger is a move in the premium index above zero while weekly flows remain positive. The main risk is the ETF cohort, which has a realized price of $84,714 and an unrealized loss of 22.0%, and may create additional supply as the price recovers.
Live Charts
Explore the metrics behind this brief with live, auto-updating charts:
BTC US ETF Flow Monitor - US spot Bitcoin ETF daily flow, BTC-denominated accumulation, and fund leadership.
Coinbase Premium Index - Coinbase vs global market premium as a proxy for US spot demand pressure.
Exchange Netflow - Net BTC moving to and from exchanges across positive and negative flow regimes.
Realized Price - Aggregate on-chain cost basis compared with BTC price and long-term trend.
Liquidity Flows - All exchange-flow, ETF, and spot-demand charts in one view.