


🎧 Morning Brief #218 - audio debate
Realized volatility has fully reversed the June spike and returned to the bottom 10% of its historical range since 2016, while Open Interest normalized by market capitalization has declined for 21 consecutive days. Together, the two charts show that leverage is not building inside the current compression, but is gradually leaving the market.
TL;DR
This brief examines what is happening inside the volatility compression. Low volatility is neutral on its own - its meaning depends on the direction of positioning. Leverage is currently declining, so the risk of a sharp move amplified by a liquidation cascade is lower than it was a month ago.
Realized Volatility
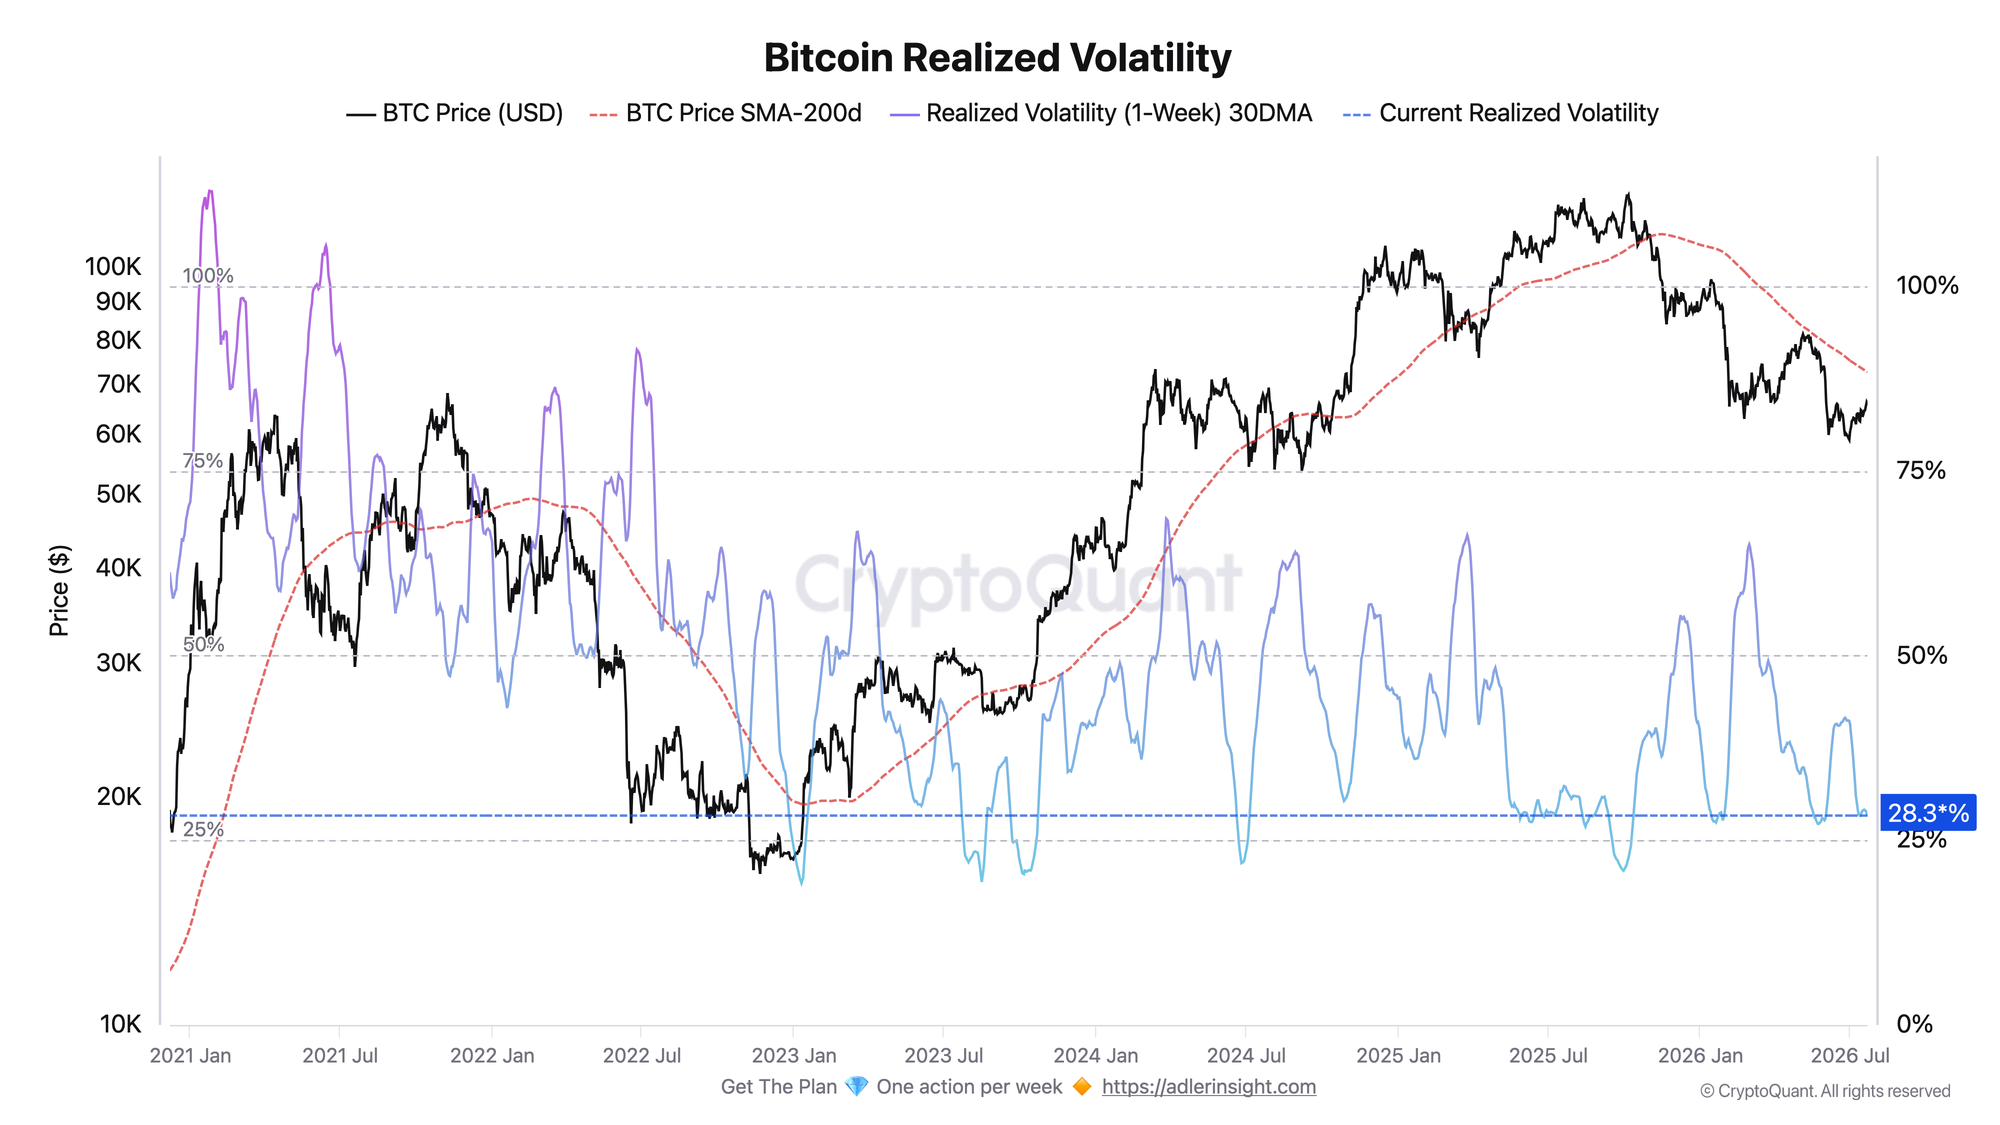
One-week realized volatility smoothed by a 30-day moving average, compared with the BTC price and its 200-day moving average.
After peaking at 41.6 on June 25, the indicator declined almost continuously and now stands at 28.3, representing a 31% drop in July. The June expansion has been fully reversed, and the metric has returned to late-May levels.
Within the historical distribution since 2016, the current value is approximately in the 8th percentile. In other words, realized volatility was higher on 92% of trading days over this period.
Over the same period, the price rose 11.4% from the June 30 low of $59,165 to $65,936, but remains 9.3% below the 200DMA at $72,666.
A rising price alongside declining realized volatility is not a sign of weakness. It shows that the recovery is unfolding without sharp swings or widespread repositioning. A negative signal would be a return above 35 while the price remains below the 200DMA. In that case, volatility would expand within a still-weak long-term structure, increasing the risk of a move lower.
Bitcoin Open Interest / Market Cap Momentum
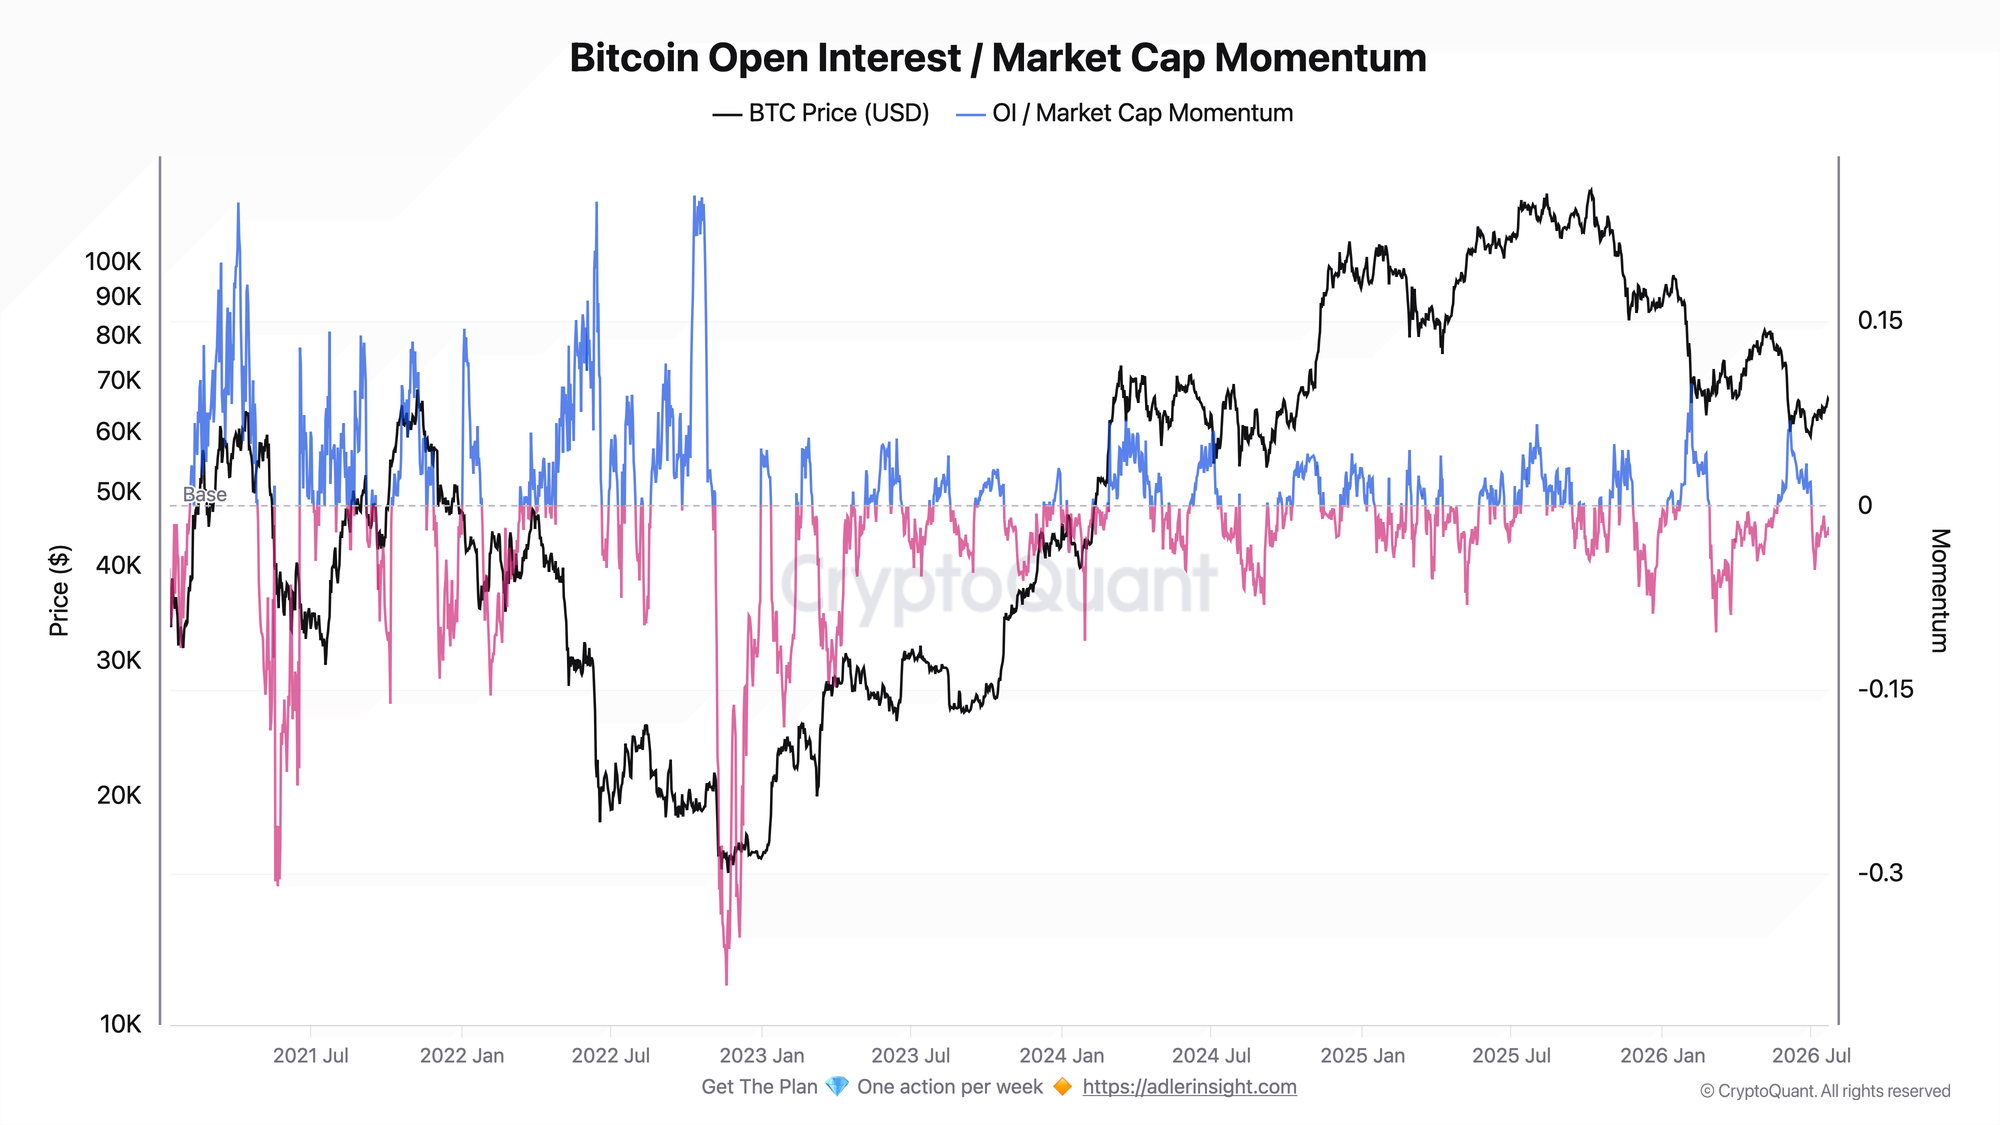
The 30-day momentum of the Open Interest to market capitalization ratio, measured in percentage points. The metric shows whether the share of derivatives leverage is rising or falling relative to the size of the market.
The indicator remained positive throughout June without a single negative day, with an average reading of +0.032 pp. It reversed on July 2 and has remained negative for 21 consecutive days. The average reading over this period is -0.025 pp, while the current value is -0.017 pp.
The shift into negative territory coincided with the start of the volatility compression, and the two regimes have remained aligned ever since.
This supports the second scenario: low volatility is accompanied not by leverage accumulation, but by leverage reduction. The risk of a liquidation cascade is now lower because the relative amount of open positions has declined compared with last month.
The connection between the two charts is straightforward: the first captures the volatility compression, while the second shows that it is taking place against a backdrop of declining leverage. The 11.4% price increase from the June low has not been accompanied by an expansion in derivatives positioning, making the current recovery more resilient than the June move from the perspective of forced liquidation risk.
Reading the signal is not enough - you need to act on it. Weekly Engine turns on-chain data into one clear decision per week, with risk caps and invalidation built in. Start free.
FAQ
Why does low realized volatility say nothing about direction on its own? Volatility measures the magnitude of price movement, not its direction. The same low reading can precede either an upward move or a decline. Positioning must therefore be considered when interpreting it, with normalized OI serving as the second filter.
What would make the current setup dangerous? The first signal would be a return of OI-to-market-cap momentum into positive territory while realized volatility remains below 30. This would mean that leverage is building again in a thin market.
The second signal would be a rise in realized volatility above 35 without the price reclaiming the 200DMA. In that case, volatility would expand while the long-term structure remained weak.
CONCLUSIONS
In July, the price rose 11.4% from the low, realized volatility fell 31% and entered the bottom 10% of its historical distribution, while normalized leverage declined for 21 consecutive days.
The market is in a low-activity phase in which the price recovery is not accompanied by an expansion in derivatives leverage. The main confirmation signal is a sustained move above $65,000 alongside further leverage reduction, followed by an advance toward the 200DMA at $72,666.
The main risk is that the current period of low volatility will inevitably end with a new expansion in price movement. As long as the price remains below the long-term average, the risk of downside volatility expansion remains the primary concern.
Live Charts
Explore the metrics behind this brief with live, auto-updating charts:
Open Interest (BTC) - Total futures positioning and 7-day BTC-denominated change.
Funding Rates - Perpetual futures funding to track long-side or short-side leverage pressure.
Fear & Greed Index - Composite market sentiment for risk appetite and sentiment extremes.
Bitcoin Analysis Framework - Multi-layer decision stack for cycle position, participant behavior, and momentum timing.
Derivatives - All funding, open-interest, and leverage charts in one view.