


🎧 Morning Brief #217 - audio debate
Bitcoin is holding around $65K, but two flow indicators point to weak buying power in the market. BTC flows remain neutral, while stablecoins continue to leave exchanges, depriving the market of the fuel needed for further growth.
TL;DR
This brief examines the balance between supply and demand through exchange flows. As long as stablecoins continue to leave exchanges and Bitcoin does not enter an accumulation phase, the price lacks the fuel needed for a sustained move higher.
Bitcoin Net Flow
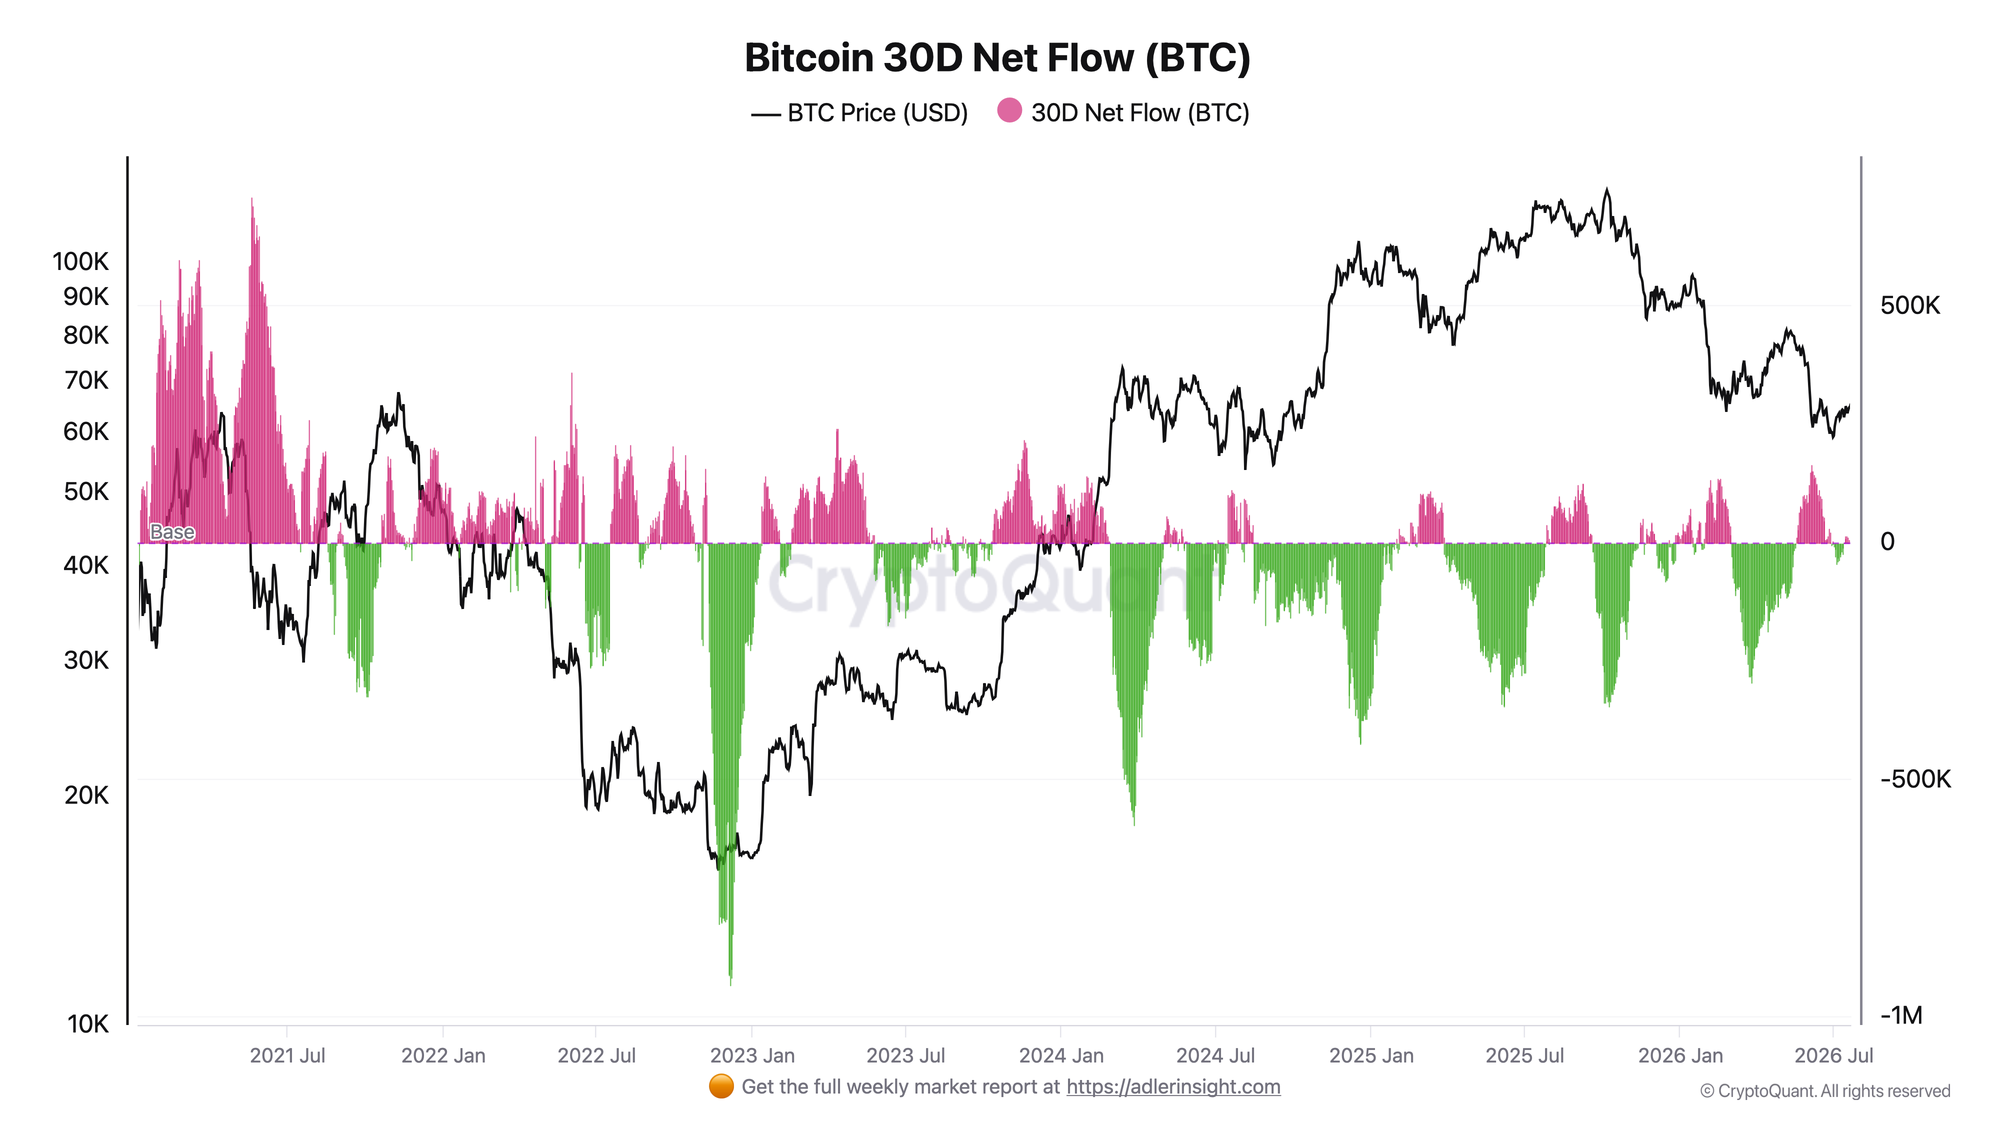
The metric reflects the 30-day net flow of Bitcoin to and from exchanges: the red zone represents inflows and potential selling pressure, while the green zone represents outflows and accumulation.
The net flow is currently fluctuating around the baseline with a slight bias toward inflows, as recent readings remain moderately positive. The deep green outflows that coincided with price bottoms and accumulation phases in 2023 and 2024 are absent from the right side of the chart. The market is not moving coins off exchanges aggressively.
The absence of strong outflows means that large-scale accumulation is not taking place. A shift into a sustained green zone would confirm an improvement. As long as readings remain near or above the baseline, the supply held on exchanges remains available for sale.
Stablecoin Net Flow
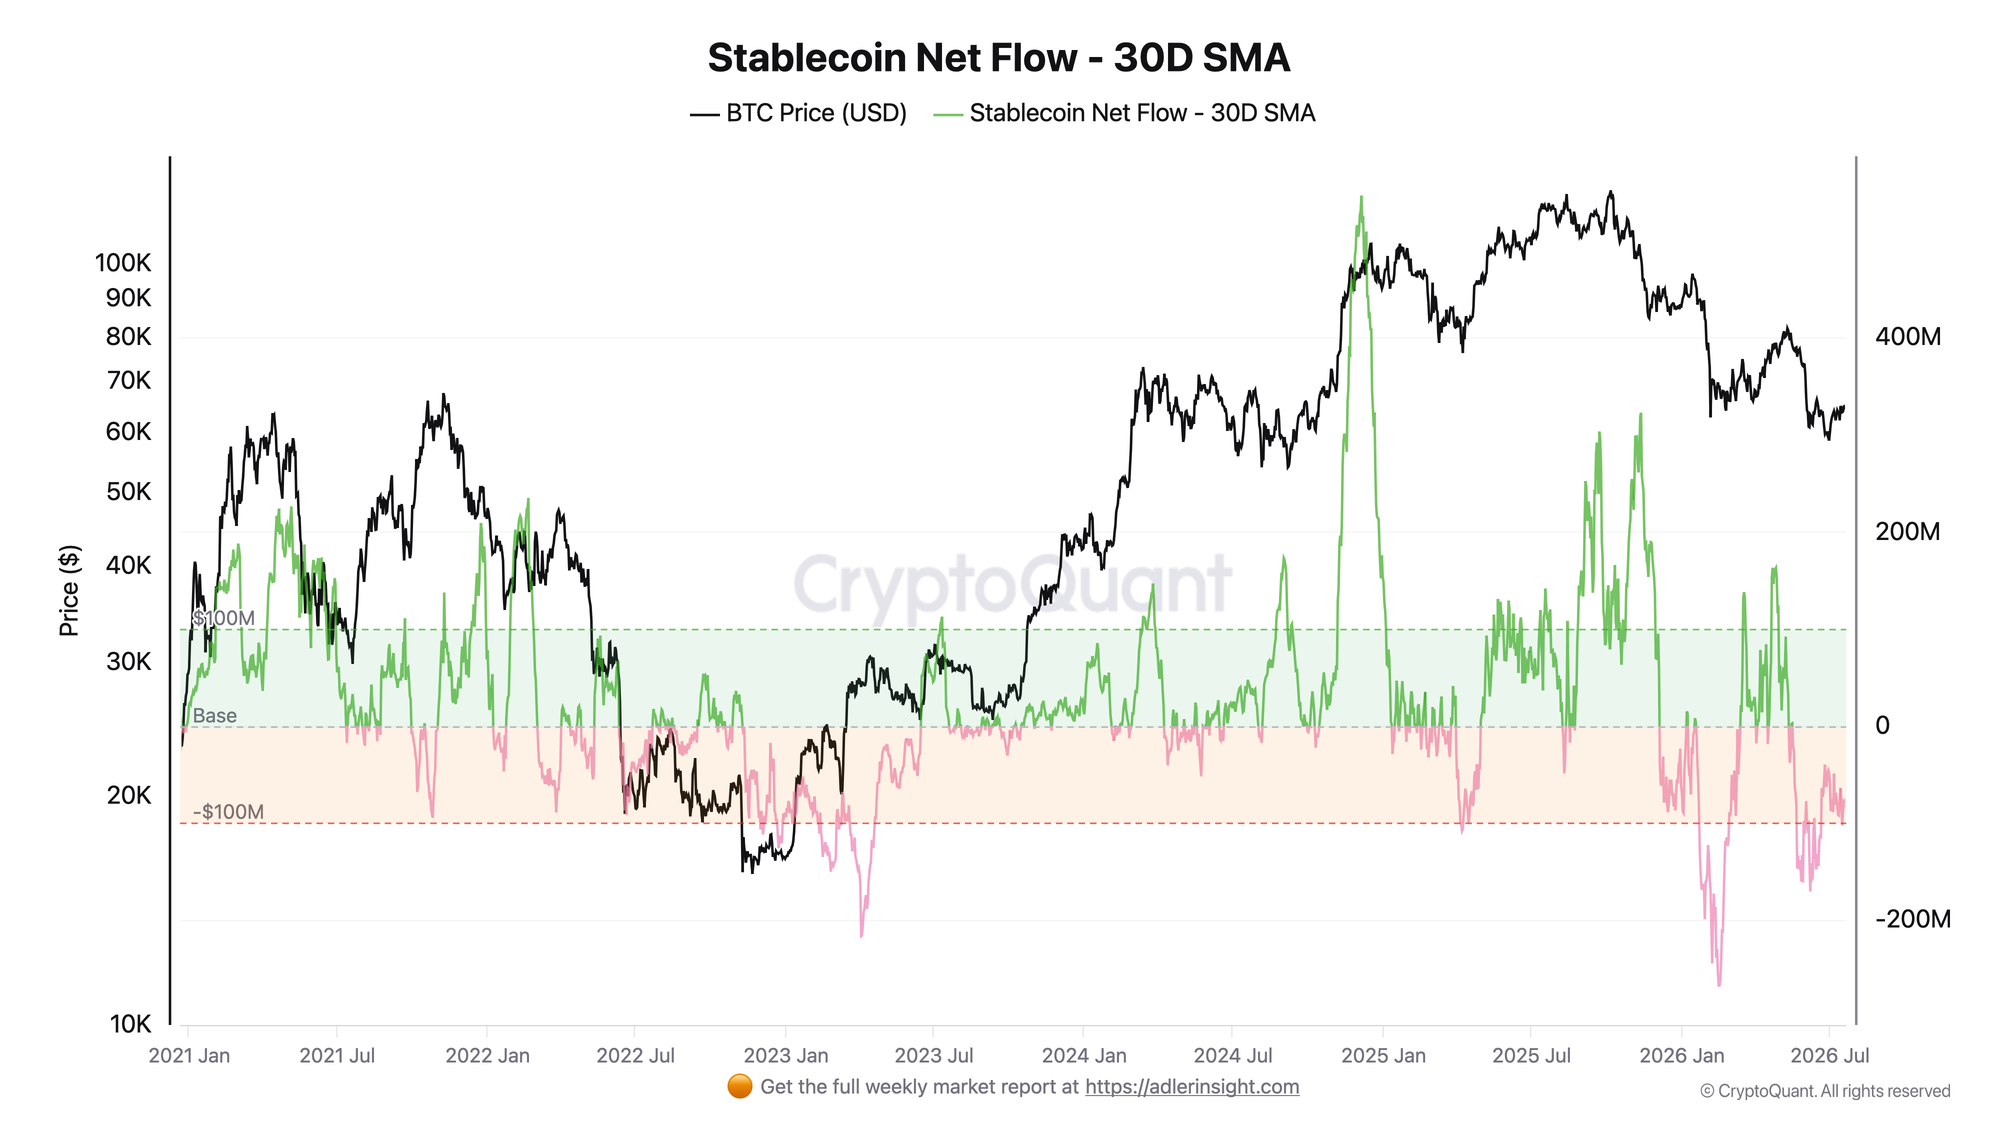
The metric reflects the 30-day moving average of net stablecoin flows to exchanges: above zero, in the green zone, indicates an inflow of buyers, while below zero indicates an outflow.
The indicator has remained in negative territory for an extended period and recently fell into the orange area below -$100M. The line is colored pink, confirming a sustained withdrawal of stablecoins from exchanges. The dry powder needed for exchange-based buying continues to leave the market.
For risk and positioning, this is a key negative factor: without stablecoin inflows, the market does not receive the liquidity needed to support demand for Bitcoin. Until the metric returns above zero into the green zone, attempts to move higher will continue to face a shortage of buying power.
The second chart clarifies the signal from the first: neutral BTC flows can be interpreted in different ways, but stablecoin outflows shift the conclusion toward weak demand. The main point today is that exchanges lack the fuel needed for sustained growth.
Stop holding through every crash - start your 7-day free trial. Weekly Engine tells you when to stay in, when to step aside, and when risk is rising.
FAQ
Why is neutral Bitcoin flow not a bullish signal? Neutral flow means that coins are not being moved into cold storage on a large scale. Deep outflows into the green zone accompanied accumulation phases and preceded reversals. Their absence indicates that strong hands are not yet removing supply from the market.
What would shift the regime from weak to strong? A return of net stablecoin flows above zero into the green zone, together with sustained Bitcoin outflows from exchanges. This would show that buying liquidity is returning while supply is moving into accumulation.
CONCLUSIONS
Both indicators point to the same conclusion: demand is weak. Bitcoin is not entering an accumulation phase, while stablecoins continue to leave exchanges. This deprives the price of the fuel needed for sustained growth, despite holding around $65K.
The main trigger for improvement is a reversal in stablecoin flows above zero. The main risk is a deeper outflow below -$100M, which would increase pressure on the price.
Live Charts
Explore the metrics behind this brief with live, auto-updating charts:
Exchange Netflow - Net BTC moving to and from exchanges across positive and negative flow regimes.
BTC US ETF Flow Monitor - US spot Bitcoin ETF daily flow, BTC-denominated accumulation, and fund leadership.
Coinbase Premium Index - Coinbase vs global market premium as a proxy for US spot demand pressure.
LTH vs STH Supply - Supply split between long- and short-term holders to track accumulation and distribution.