


🎧 Morning Brief #216 - audio debate
Two indicators of demand and market sentiment are near key lower boundaries, but both have started turning upward: the share of realized capitalization held in coins younger than one month remains near its yearly lows, while short-term holders continue selling at a loss on average.
TL;DR
This brief examines how weak inflows of new capital coincide with short-term holders realizing losses. Young coins account for a minimal share of realized capitalization, STH SOPR remains below 1.0, and both indicators have only just started recovering from their local lows.
Bitcoin New Investors
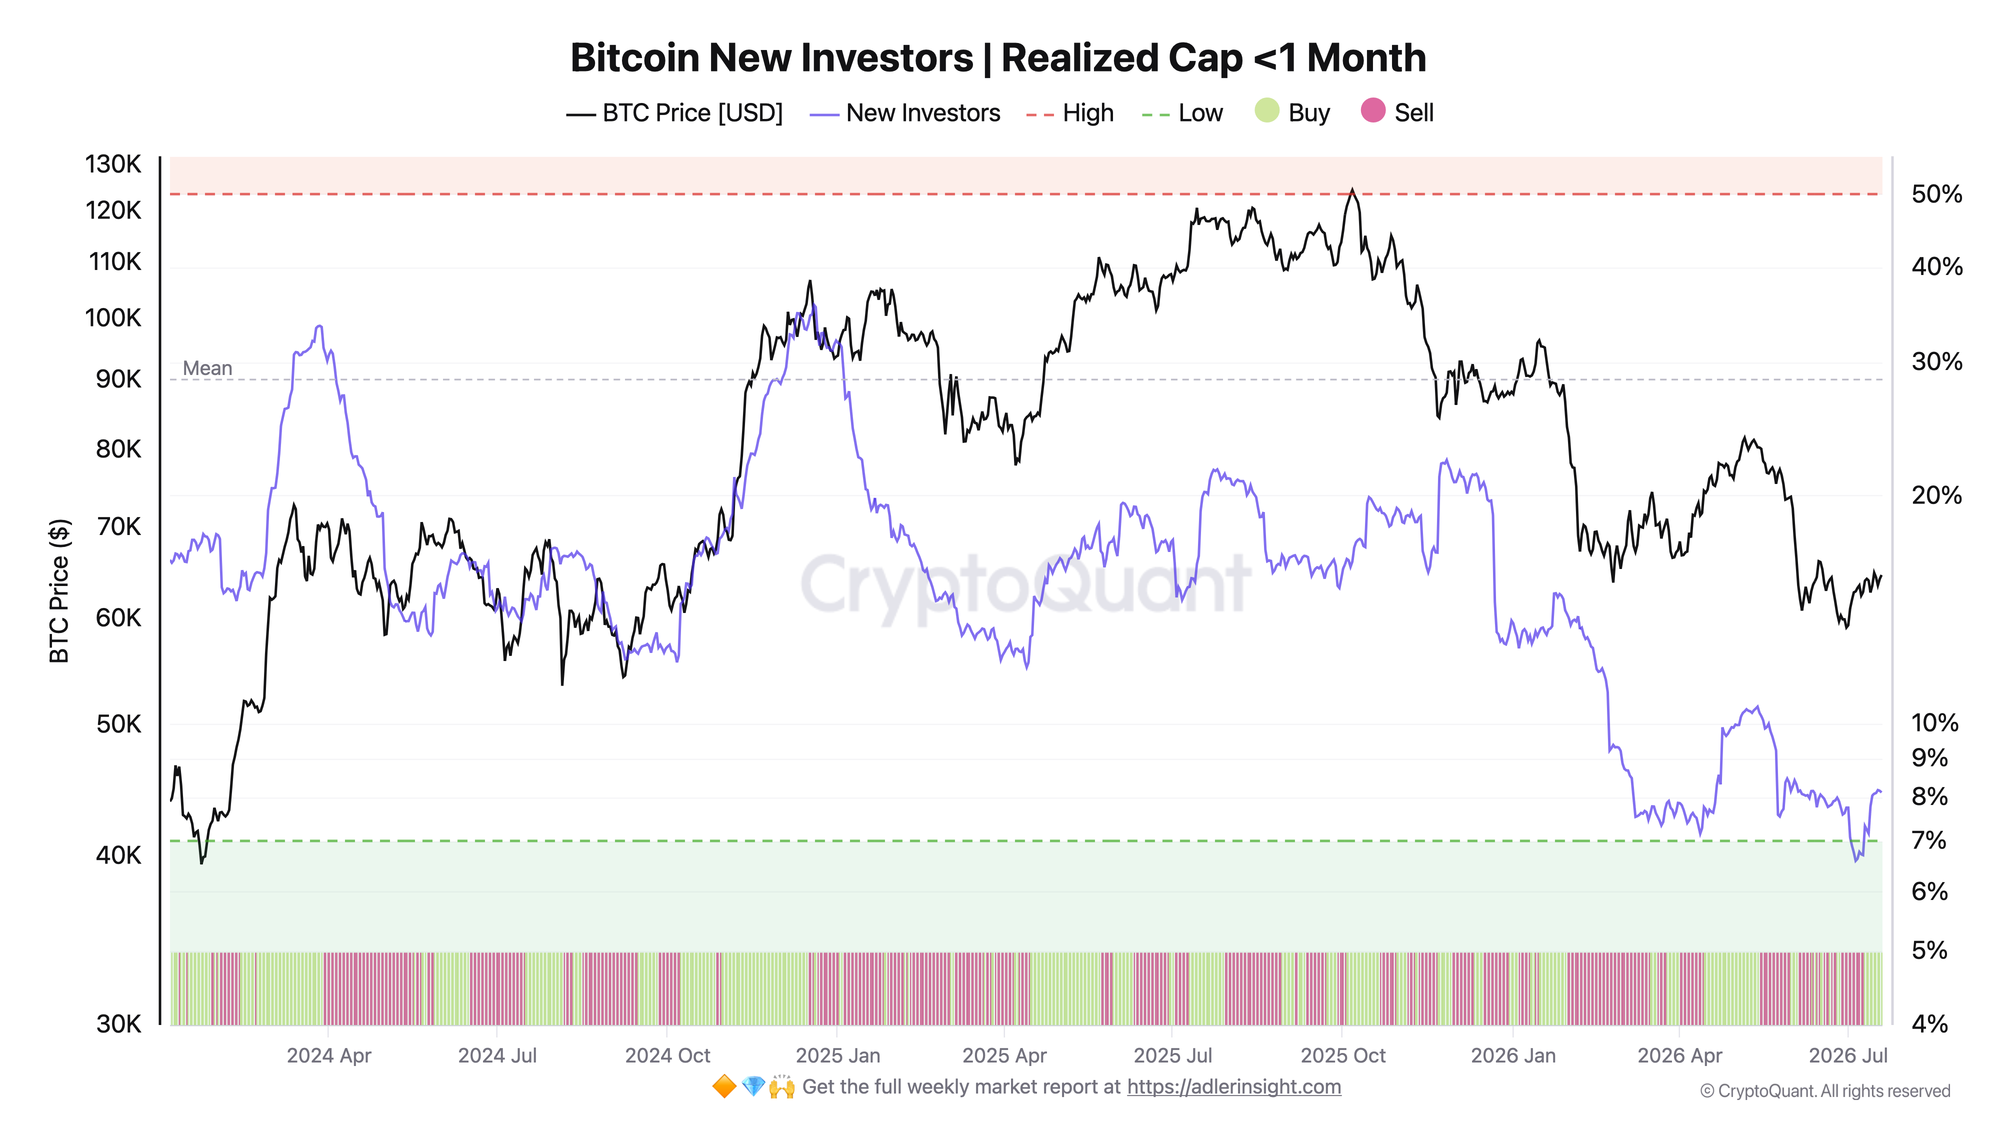
The metric measures the share of realized capitalization concentrated in coins younger than one month and is used as an indicator of new capital activity and short-term demand. The higher the reading, the more capital has recently entered the market and the more actively coins are being redistributed among new participants. Lower readings, by contrast, point to weak inflows of fresh capital and limited speculative activity.
The indicator currently stands at 8.1, with the lower boundary at 7 and the upper boundary at 50. It remains in the lower part of its yearly range, indicating limited participation from new investors and no meaningful inflow of capital. Over the past ten days, the metric has started rising from a local low of 7.2 and has gained 13% over the past week. This shows that activity among new participants has stopped declining and that the first signs of a recovery in short-term demand have emerged.
However, the current increase is not yet enough to suggest a full return of new capital. The indicator remains close to the lower zone and well below the levels associated with periods of sustained demand. The move higher should therefore be viewed as early stabilization following a local low, rather than a confirmed reversal.
Short-Term Holder SOPR (7D SMA)
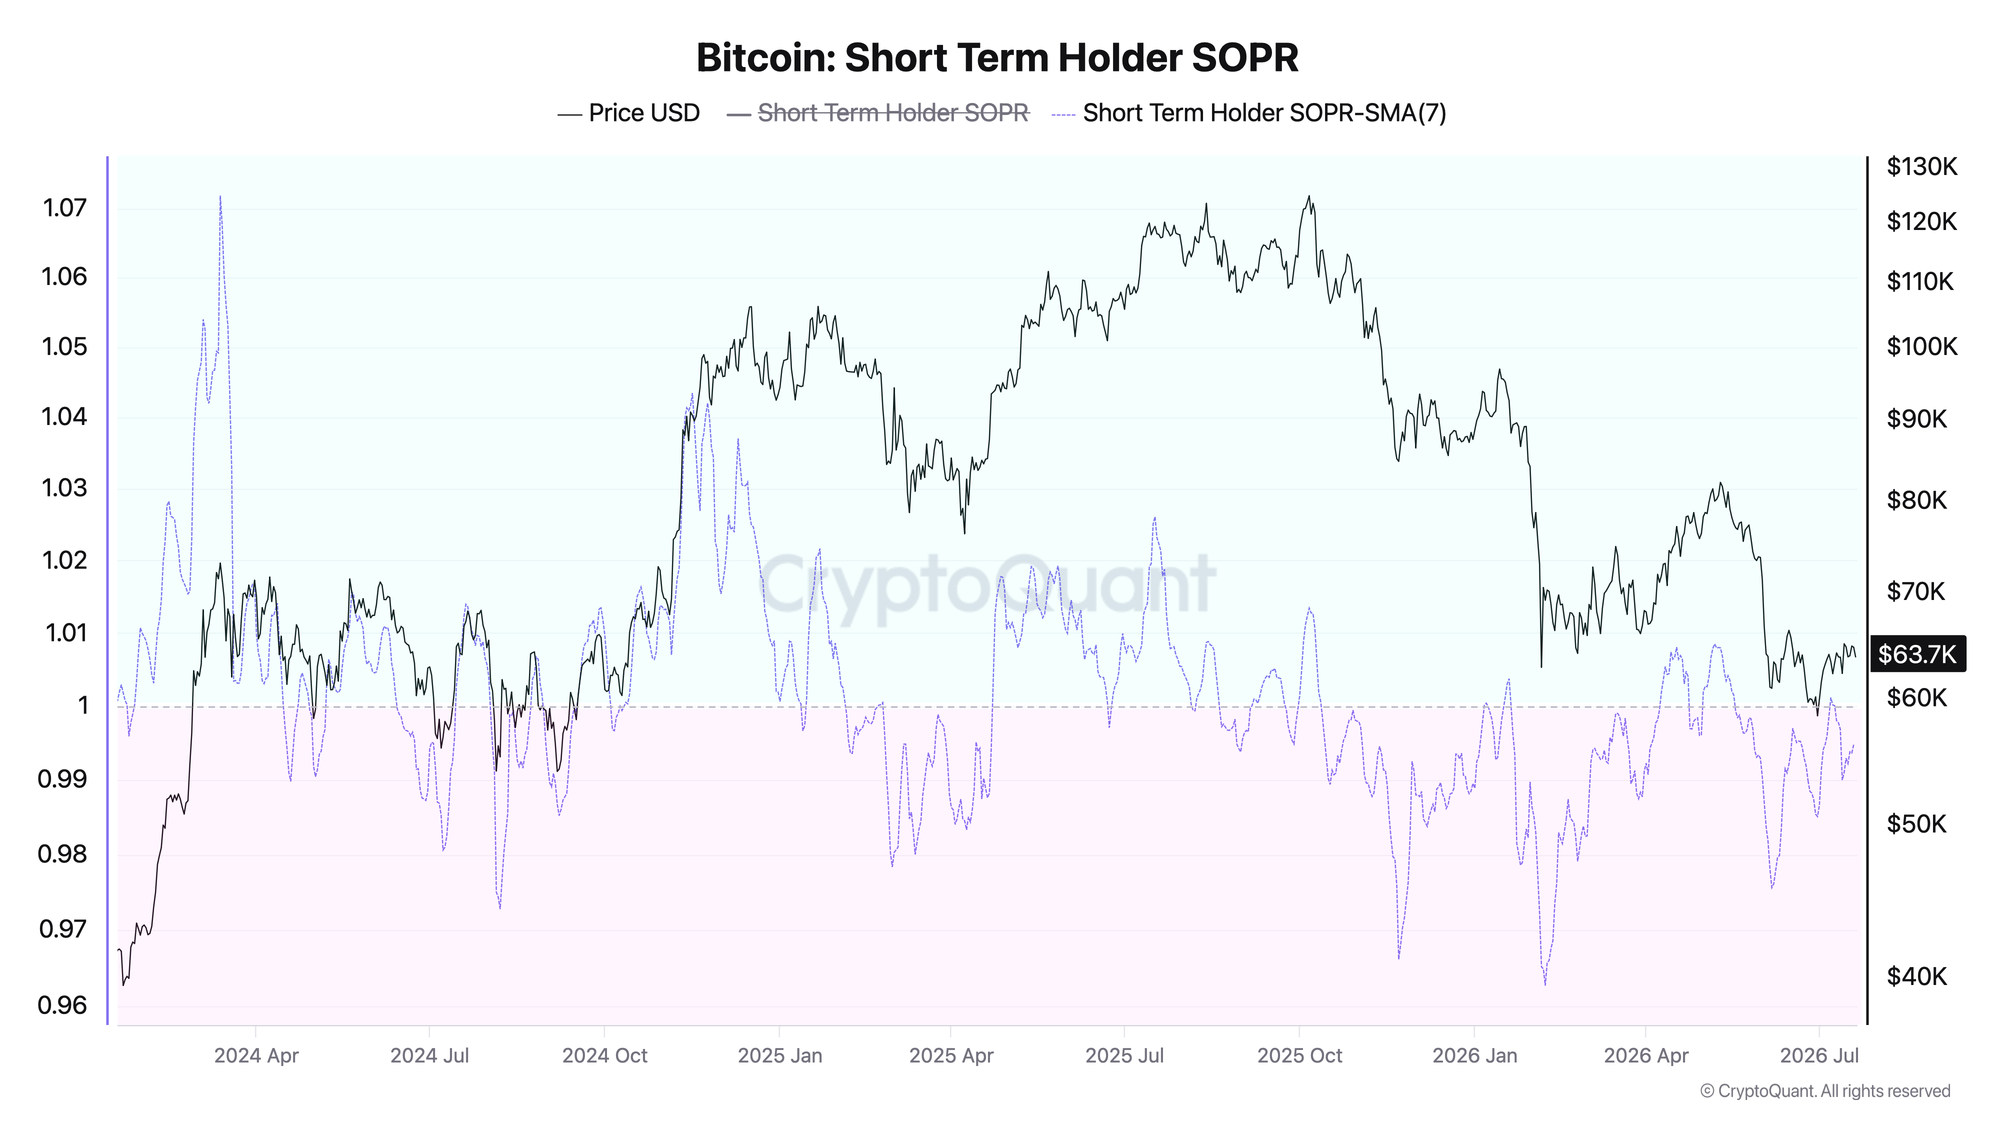
The metric shows the average profitability of sales by short-term holders, smoothed using a 7-day SMA. The 1.0 level separates realized profits from realized losses.
The indicator currently stands at 0.99 and has remained below the break-even level for 27 of the past 30 days. The sustained move below 1.0 began on July 10. Over the past week, the indicator has started recovering moderately from its local low without falling toward its 60-day low of 0.976.
SOPR below 1.0 means that short-term holders are selling at a loss on average. This is a regime of loss realization and weak-hand flushing. A recovery toward 1.0 points to a gradual reduction in realized losses. A sustained return above the break-even level, followed by continued holding above it, would confirm a shift in sentiment.
The two charts complement each other. The share of realized capitalization held in young coins is compressed near its lows, pointing to weak participation from new capital. At the same time, STH SOPR remains below 1.0, showing that recent buyers continue to realize losses.
The key signal today is not the weakness itself, but the first signs that it is beginning to fade.
FAQ
What does the simultaneous compression in New Investors and STH SOPR below 1.0 actually signal? It points to weak inflows of new capital combined with recent buyers realizing losses. This combination is consistent with a cleansing phase and the formation of a local bottom, but it does not confirm a reversal on its own.
Where is the boundary for a regime shift? A reversal would be confirmed by Bitcoin New Investors moving sustainably above the lower zone while STH SOPR returns above 1.0. Until then, any recovery remains stabilization within a weak structure rather than a full trend reversal.
Stop holding through every crash - start your 7-day free trial. Weekly Engine tells you when to stay in, when to step aside, and when risk is rising.
CONCLUSIONS
The combination of these two metrics points to a market reset: the share of new capital remains near its yearly lows, short-term holders have been selling at a loss for almost a month, and both indicators have started turning upward from their local lows.
The main trigger for improvement: Bitcoin New Investors holds sustainably above the lower zone, while STH SOPR returns above 1.0.
The main risk: STH SOPR falls back toward its 60-day lows and Bitcoin New Investors returns to the lower boundary.
Live Charts
Explore the metrics behind this brief with live, auto-updating charts:
STH-SOPR - Short-term holder profit/loss behavior around the 1.0 breakeven threshold.
RHODL Ratio - Ratio of younger to older HODL bands to flag cycle tops and overheated demand.
SOPR - Spent Output Profit Ratio shows whether moved coins realize profit or loss.
Supply in Loss - Share of supply held at a loss to flag stress and capitulation zones.
Holder Behavior - All holder profitability and supply-cohort charts in one view.