


🎧 Morning Brief #215 - audio debate
Long-term holders are actively increasing their positions and keeping their coins dormant, but the market has yet to respond: LTH supply has reached an all-time high. Both charts point to the same side of the equation - liquid supply is shrinking, but there is still not enough demand to turn that scarcity into higher prices.
TL;DR
This brief explains why record supply held by long-term holders has not translated into price growth. A reduction in available supply creates a foundation for a future move, but without an influx of demand, that foundation remains just a base rather than a confirmed reversal.
Bitcoin LTH Accumulation / Distribution Supply
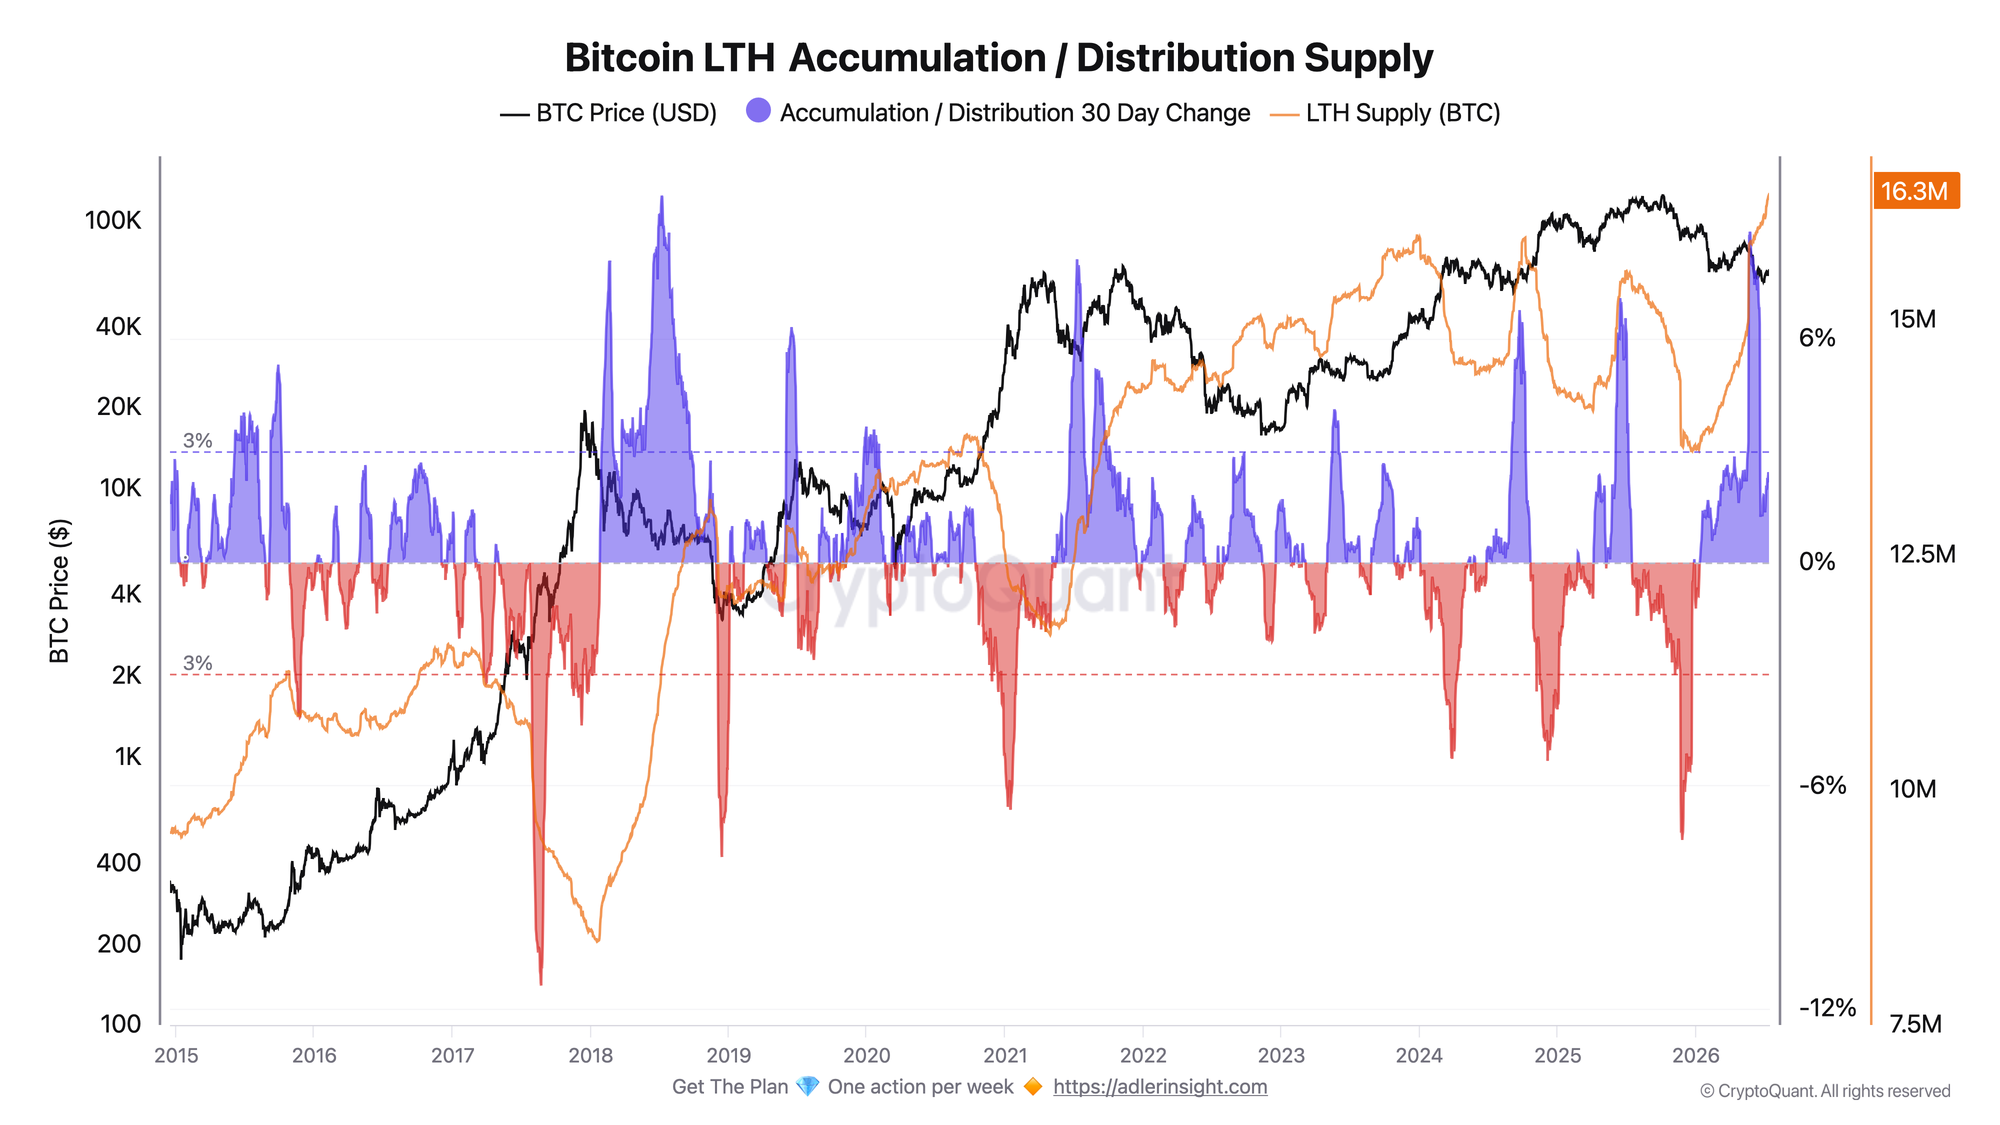
Metric: the total supply held by long-term holders and its 30-day change relative to the BTC price.
Total LTH supply has reached 16.34 million BTC - an all-time high. The 30-day change stands at +2.32%, which means roughly 371,000 BTC moved into the long-term holder category over the past month. The accumulation streak has remained positive for 186 consecutive days, since mid-January. Over the same month, the price fell from $65.7K to $63.8K, and over the past year from $118.6K to $63.8K.
This is a classic transfer of coins from weak hands to strong hands in a falling market: the supply available for trading is shrinking, but that alone is not enough to push the price higher. Confirmation of the constructive scenario would come from the 30-day change remaining positive while the price stabilizes. A move into negative territory would mark deterioration, signaling the start of distribution from a record level.
Bitcoin Long-Term Holder Activity Levels
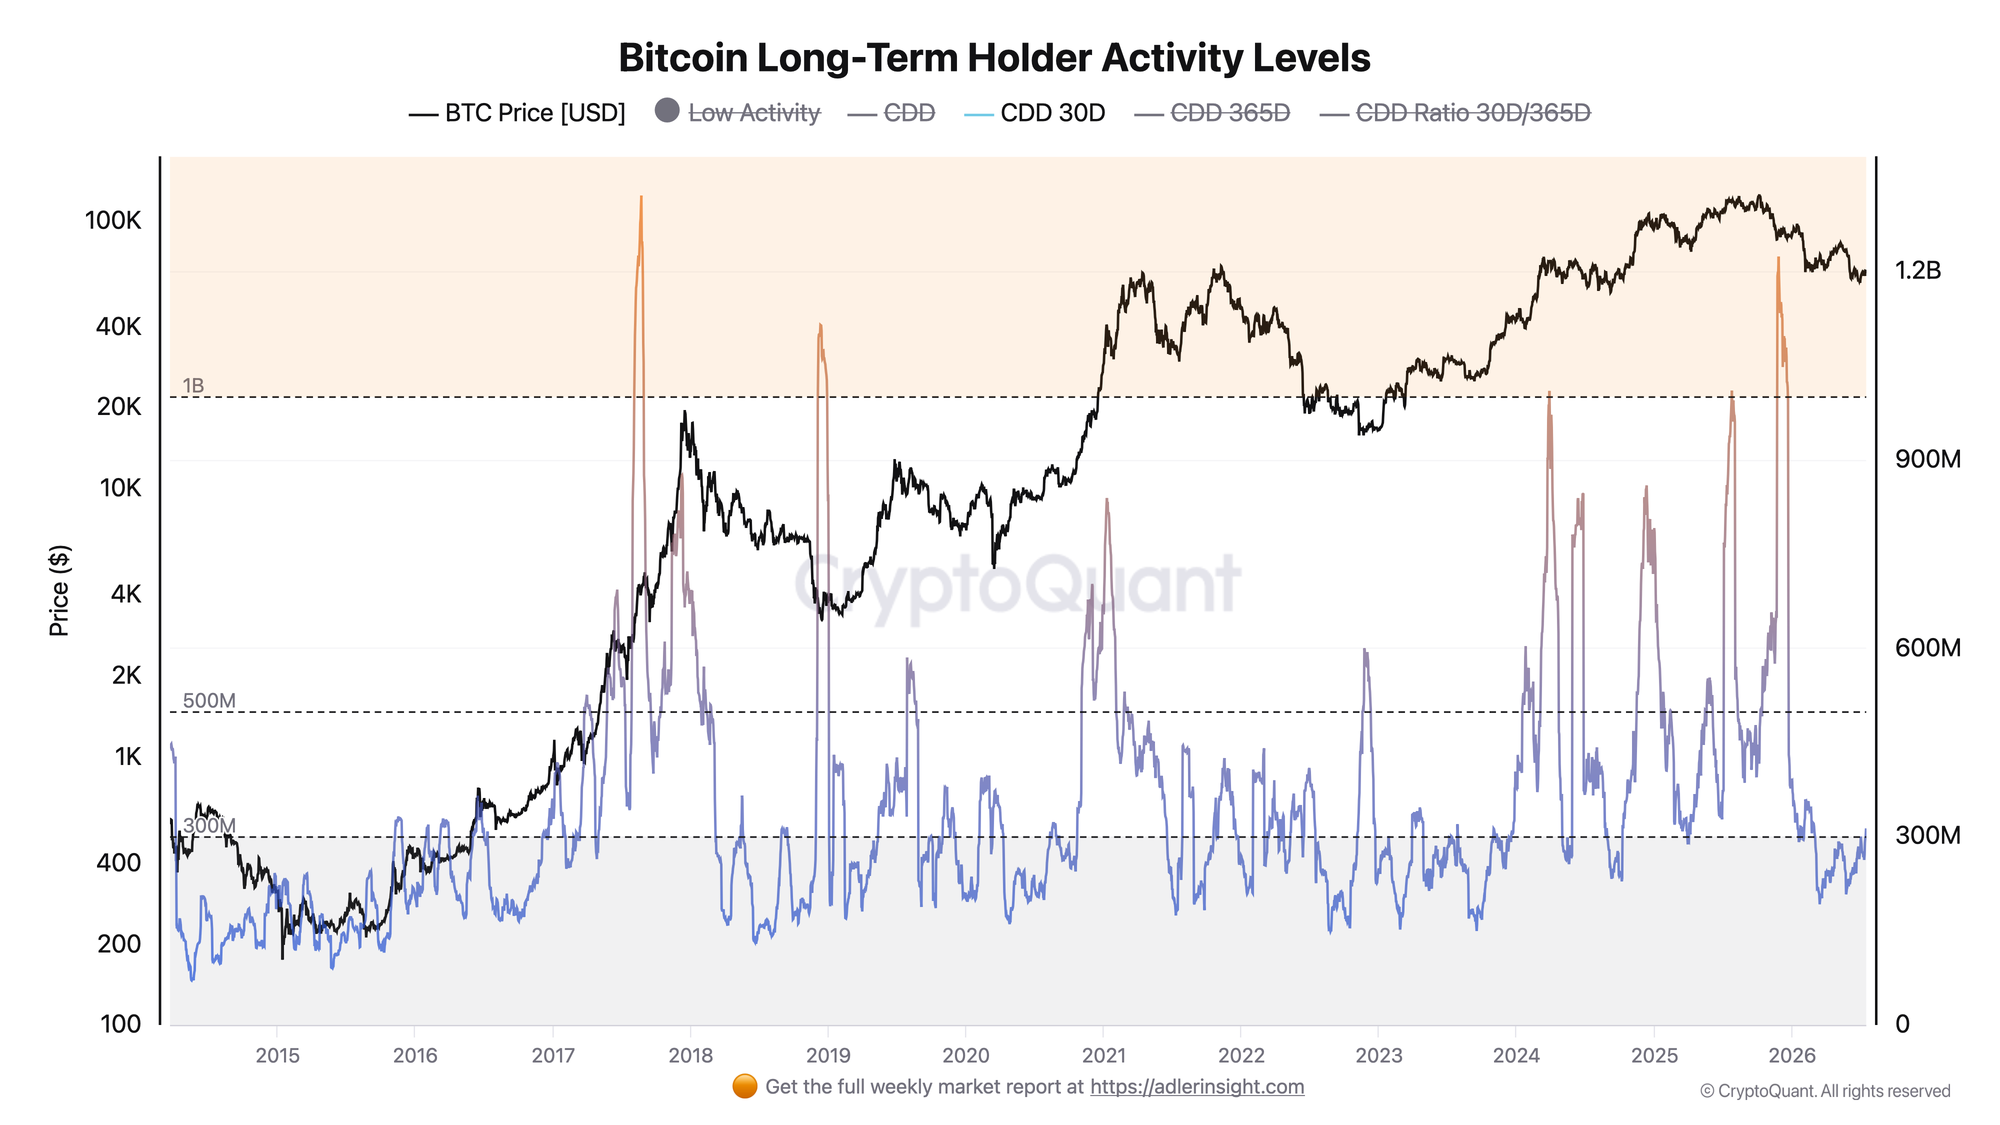
Metric: the total Coin Days Destroyed over 30 days - the volume of "coin days" destroyed when coins move, measuring how actively older holdings are being spent.
CDD 30D currently stands at 313 million coin days, compared with 899 million a year ago. The current reading also remains below the annual average of 450 million. Within the distribution of the past 12 months, the metric sits in the 42nd percentile, placing it in the lower half of the range. At the same time, it has risen 63% from the March low of 192 million and gained roughly 21% over the past month, from 259 million. The average daily CDD over the 30-day period has increased to 10.4 million, compared with 8.6 million a month earlier.
The absolute level remains low, so the baseline regime is still holding. Older coins are largely staying dormant, and there is currently no meaningful selling pressure from them. However, the trajectory has turned upward from the low. The regime-change trigger will be a sustained move in CDD 30D above the annual average near 450 million. Until then, the increase remains local noise. A sustained break above that level would point to older supply genuinely returning to the market.
The connection: both charts tell the same story - supply continues to leave circulation and has yet to return to the market. This confirms an accumulation phase, but not yet a reversal. The key point today is that the price is falling despite a record contraction in available supply, which means the main problem is not on the seller side, but in the lack of sufficient demand.
Reading the signal is not enough - you need to act on it. Weekly Engine turns on-chain data into one clear decision per week, with risk caps and invalidation built in. Start free.
FAQ
Why is record LTH supply not supporting the price? Because accumulation reduces available supply but does not create new demand. The price is determined by who is willing to buy now, while long-term holders, by definition, rarely participate in current market turnover.
What would count as a regime change? A move in the 30-day change in LTH supply into negative territory or a break in the CDD 30D/365D ratio above its annual average. Either signal would mean that older supply is beginning to return to the market.
CONCLUSIONS
Over the past month, long-term holders accumulated 371,000 BTC and pushed their total supply to an all-time high of 16.34 million BTC. At the same time, older coins remain dormant, while the low-activity regime has now lasted for 206 days.
The supply side looks strong, but the price has lost nearly half its value over the past year. This shows that structural supply scarcity is still unable to offset the absence of sustained demand.
The current regime is neutral with a constructive fundamental bias. The main trigger for improvement is price stabilization while the 30-day increase in LTH supply remains positive. The main risk is a move in the accumulation metric into negative territory alongside a continued rise in CDD. Distribution from a record level would place more pressure on the market than usual.
Live Charts
Explore the metrics behind this brief with live, auto-updating charts:
LTH vs STH Supply - Supply split between long- and short-term holders to track accumulation and distribution.
Reserve Risk - Long-term holder conviction relative to price to gauge risk/reward at cycle extremes.
LTH-SOPR - Long-term holder profit/loss realization around the 1.0 breakeven threshold.
BTC US ETF Flow Monitor - US spot Bitcoin ETF daily flow, BTC-denominated accumulation, and fund leadership.
Coinbase Premium Index - Coinbase vs global market premium as a proxy for US spot demand pressure.