


🎧 Morning Brief #225 - audio debate
The share of realized cap associated with short-term holders has fallen to 23%, while the long-term holder share has risen to 52%. Coins are aging and remaining dormant, while speculative activity continues to weaken.
TL;DR
The short-term holder share is near multi-year lows, while the long-term holder share has approached historical highs. This points to lower coin turnover and resilience among long-term holders, but it does not yet confirm a return of demand.
Bitcoin STH HODL Waves
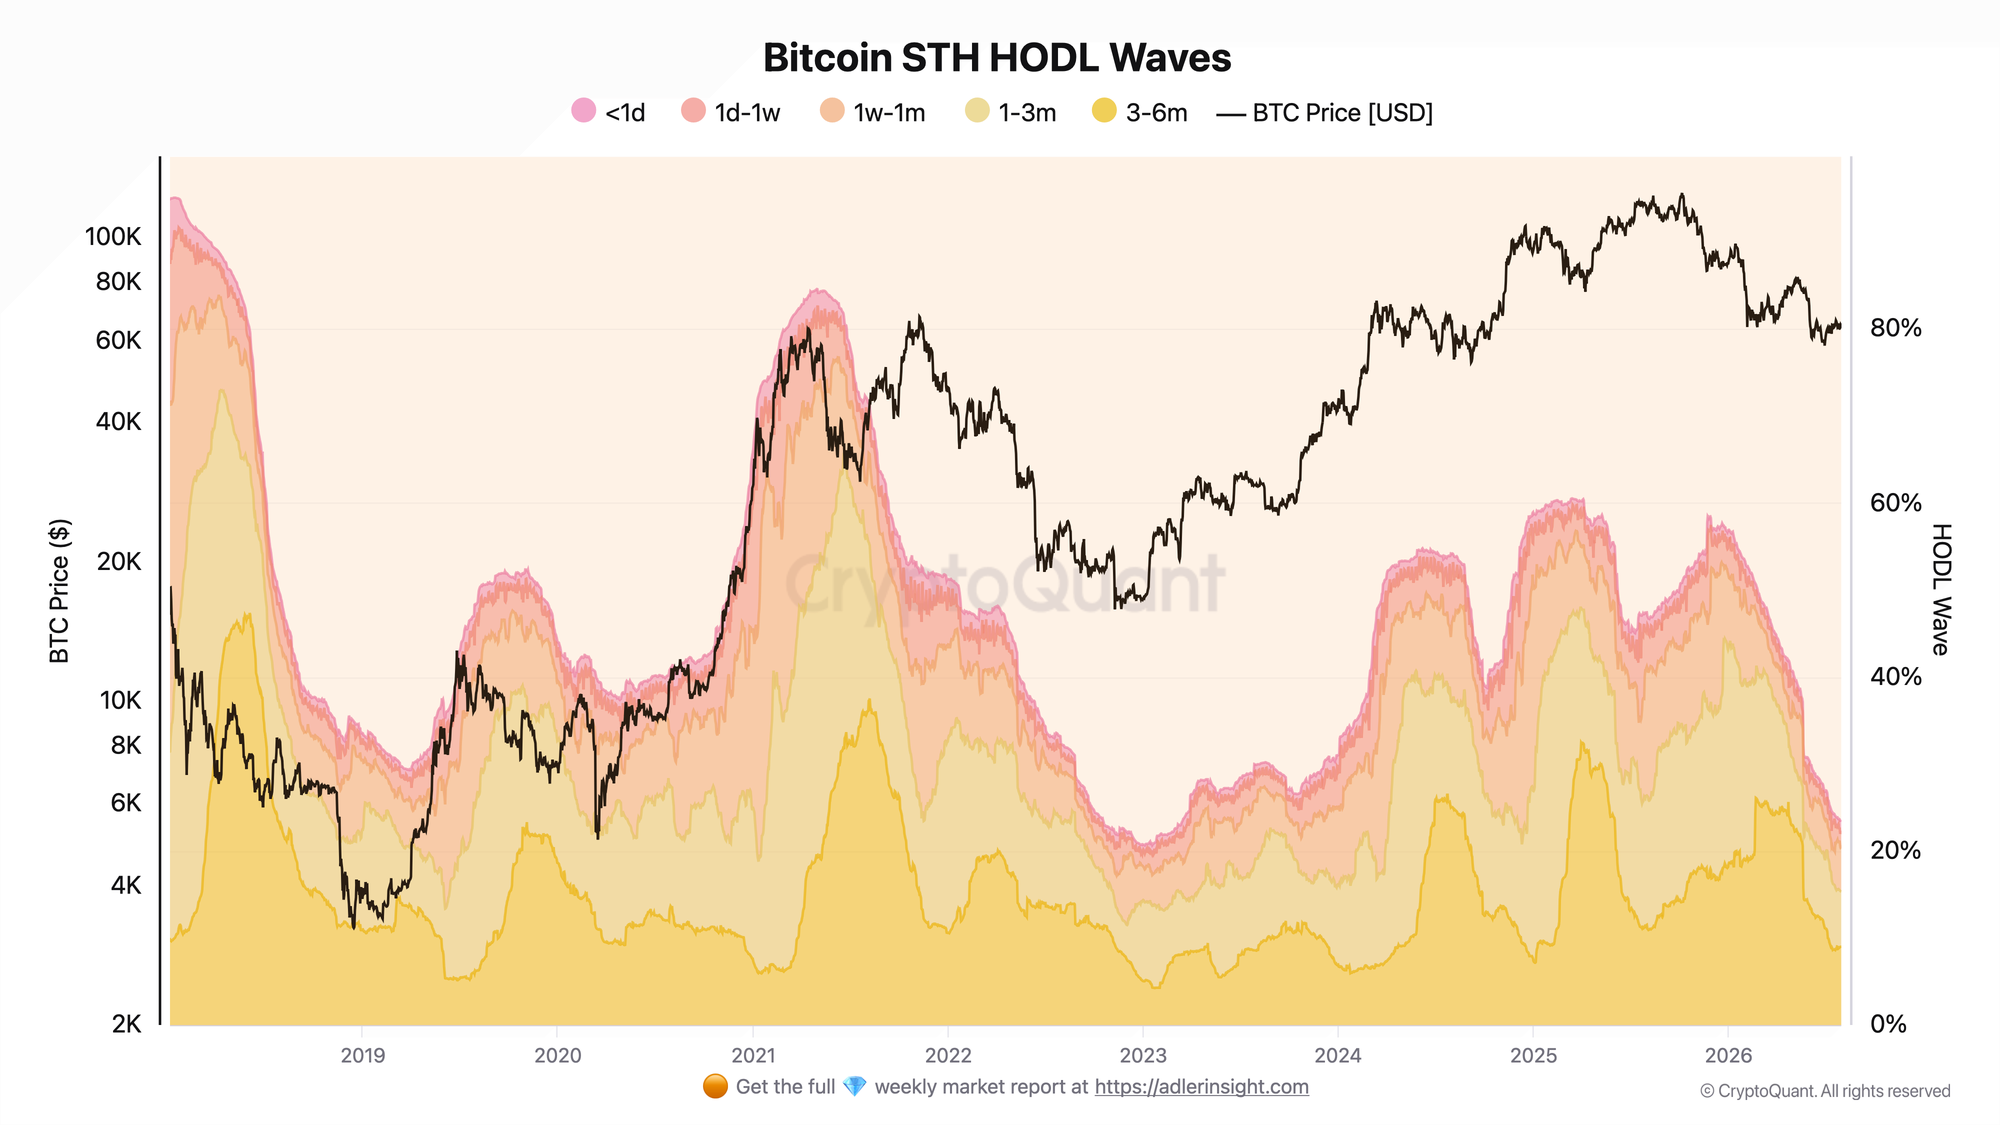
Bitcoin STH HODL Waves - the share of realized capitalization attributed to age cohorts ranging from <1 day to 6 months.
The combined share of short-term holders in realized cap has fallen to 23.5%, from 27% one month ago and 40% three months ago. The reading is near multi-year lows: it has been lower only 4% of the time. Comparable levels were last seen at the bear market bottom in December 2022 - January 2023.
The main contribution came from the 3-6m band, whose share fell from 23% to 9% over three months. A large portion of these coins remained unspent and moved into the next age cohort.
This compression shows that an increasingly smaller share of realized cap is concentrated in recently moved coins. It points to weaker speculative turnover and limited inflows of new capital, but it does not prove that selling pressure has been fully exhausted.
A recovery would be confirmed by an upward reversal in the short-term holder share alongside rising prices and renewed demand. Further compression without stronger demand would remain a sign of a weak and inactive market.
Bitcoin LTH HODL Waves
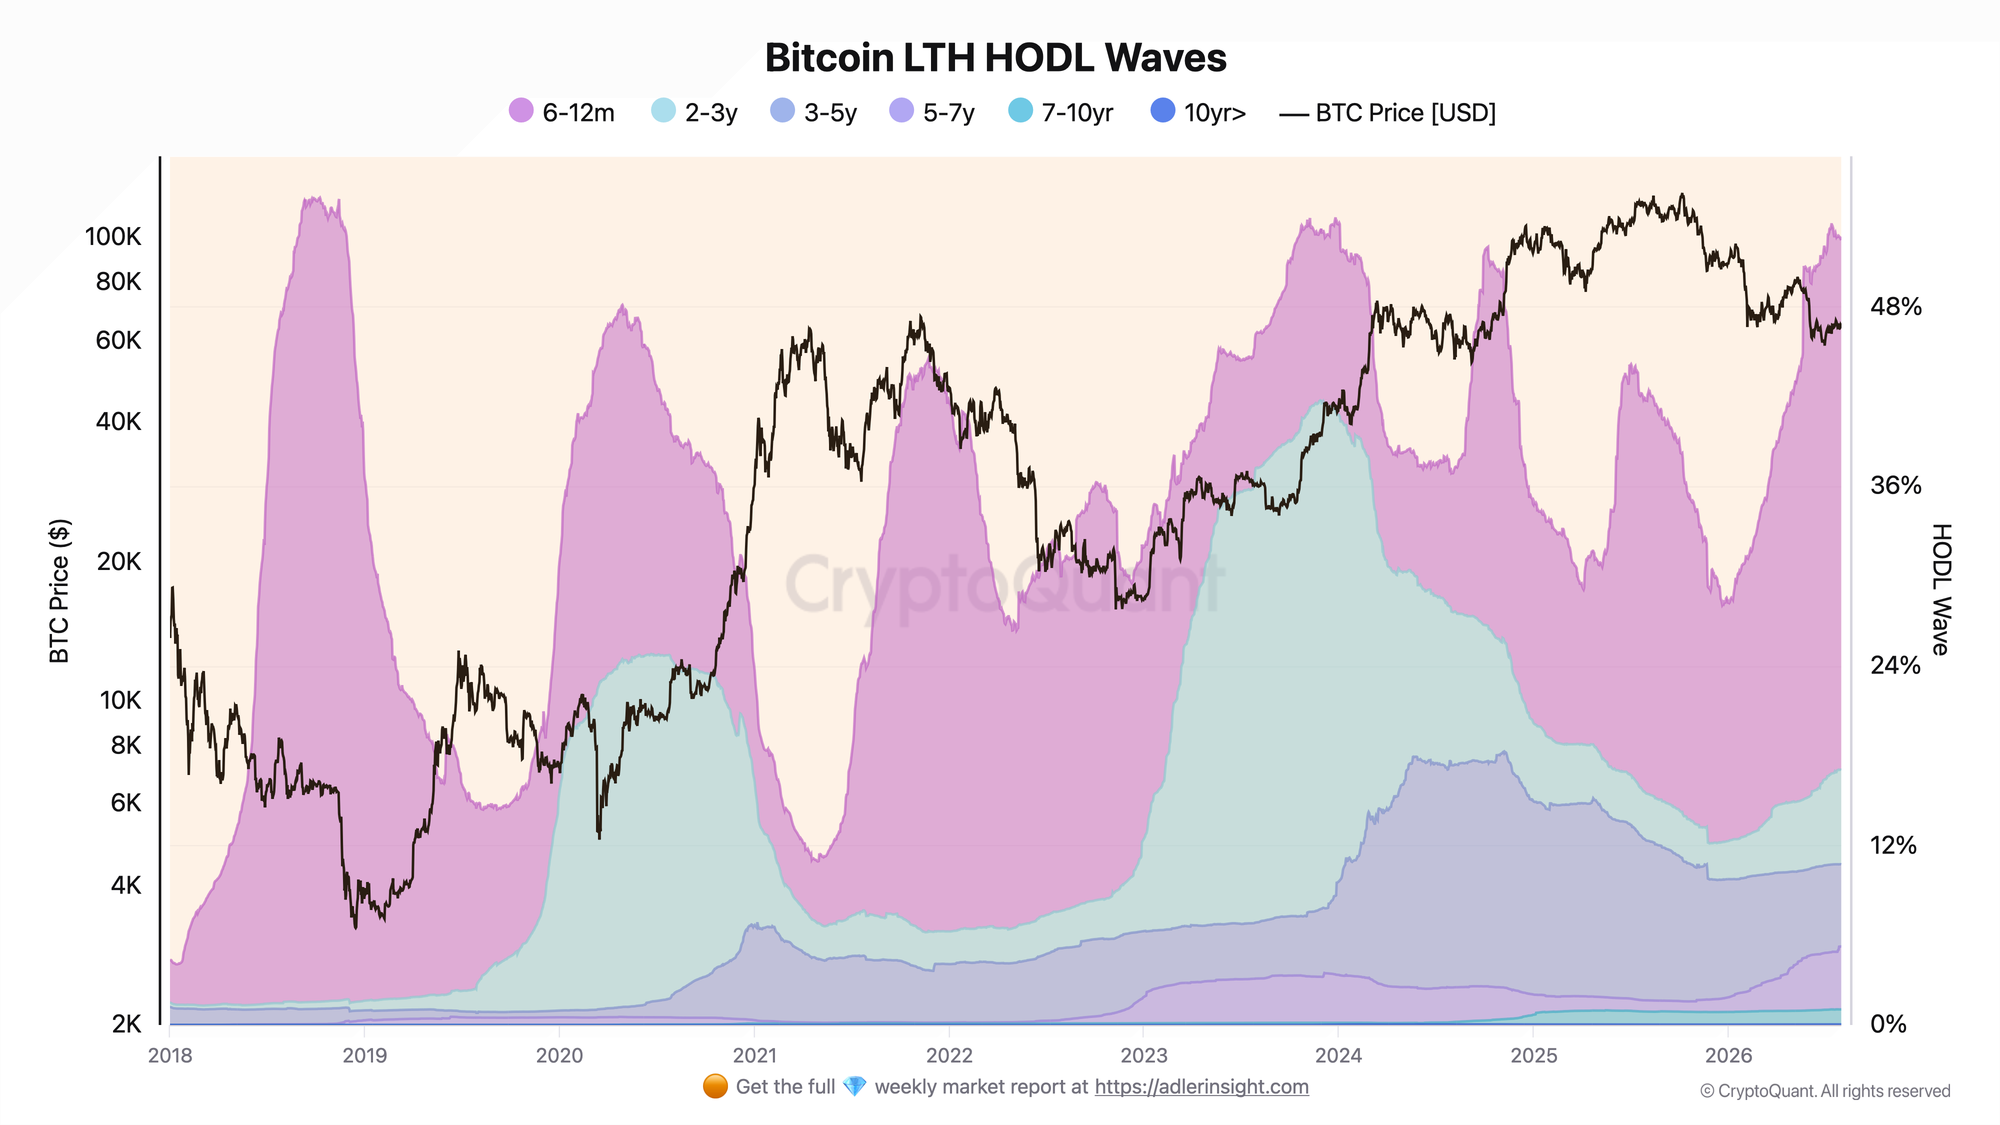
Bitcoin LTH HODL Waves - the share of Bitcoin's realized capitalization attributed to age cohorts ranging from 6-12 months to 10+ years.
The combined share of long-term holders in realized cap has risen to 52.5%, from around 52% one month ago and 42% three months ago. The reading is close to historical highs. It was higher only at the 2018 peak, when it reached 55%.
The main driver was the 6-12m cohort, whose share rose from 27% to 35%. These are the coins that previously sat in the 3-6m cohort.
The rising long-term holder share during a price decline means that the owners of these coins are not moving them and are holding through the drawdown. However, the metric itself does not prove that they are actively buying the dip.
Lower turnover among older coins reduces the amount of liquid supply. If demand returns, this structure could amplify the price response. Without new demand, a high long-term holder share can persist for an extended period without producing an immediate rally.
The two charts reflect the same process: the share of realized cap in younger coins is falling, while the share in older coins is rising. Supply is becoming less mobile, but demand is not yet showing signs of a full recovery.
The market is near a bottom - the best entry comes once per cycle. One step a week, clear triggers, and invalidation levels. Start free.
FAQ
Why does a low short-term holder share matter? It shows that only a small portion of realized cap is concentrated in recently moved coins. This means speculative turnover is weak and new capital inflows are limited. The metric may reduce the risk of sharp sell-offs by recent buyers, but on its own it does not create the conditions for price growth.
What would signal a regime change? A rising short-term holder share alongside higher prices, volumes, and capital inflows. This would indicate that new participants are returning to the market and beginning to absorb supply. A decline in the long-term holder share should be assessed together with demand indicators, since it may reflect both coin distribution and a rise in the value of recently moved UTXOs.
CONCLUSIONS
Both charts show realized cap shifting from younger coins to older ones. The short-term holder share has fallen to a multi-year low of 23%, while the long-term holder share has approached a historical high of 52%.
This points to lower coin turnover and resilience among long-term holders during the price decline.
The main risk: without a return of demand, low activity may persist and the price may continue to drift lower, as it did near the 2022-2023 market bottom. Limited supply does not have to translate into rapid price growth.
Live Charts
Explore the metrics behind this brief with live, auto-updating charts:
LTH vs STH Supply - Supply split between long- and short-term holders to track accumulation and distribution.
RHODL Ratio - Ratio of younger to older HODL bands to flag cycle tops and overheated demand.
Reserve Risk - Long-term holder conviction relative to price to gauge risk/reward at cycle extremes.
NUPL - Net unrealized profit/loss across holders, mapped into cycle sentiment phases.
Supply in Profit - Share of circulating supply in profit as a cycle-phase and euphoria gauge.