


🎧 Morning Brief #226 - audio debate
The Bitcoin Unified Sentiment Index has turned lower over the past week and a half, fallen below zero, and moved closer to the Fear zone. The second chart shows BTC's return 30 days after dates when the index was in similar zones.
TL;DR
The market is still in the Neutral zone, but sentiment continues to deteriorate and is approaching the Fear threshold.
Bitcoin Unified Sentiment
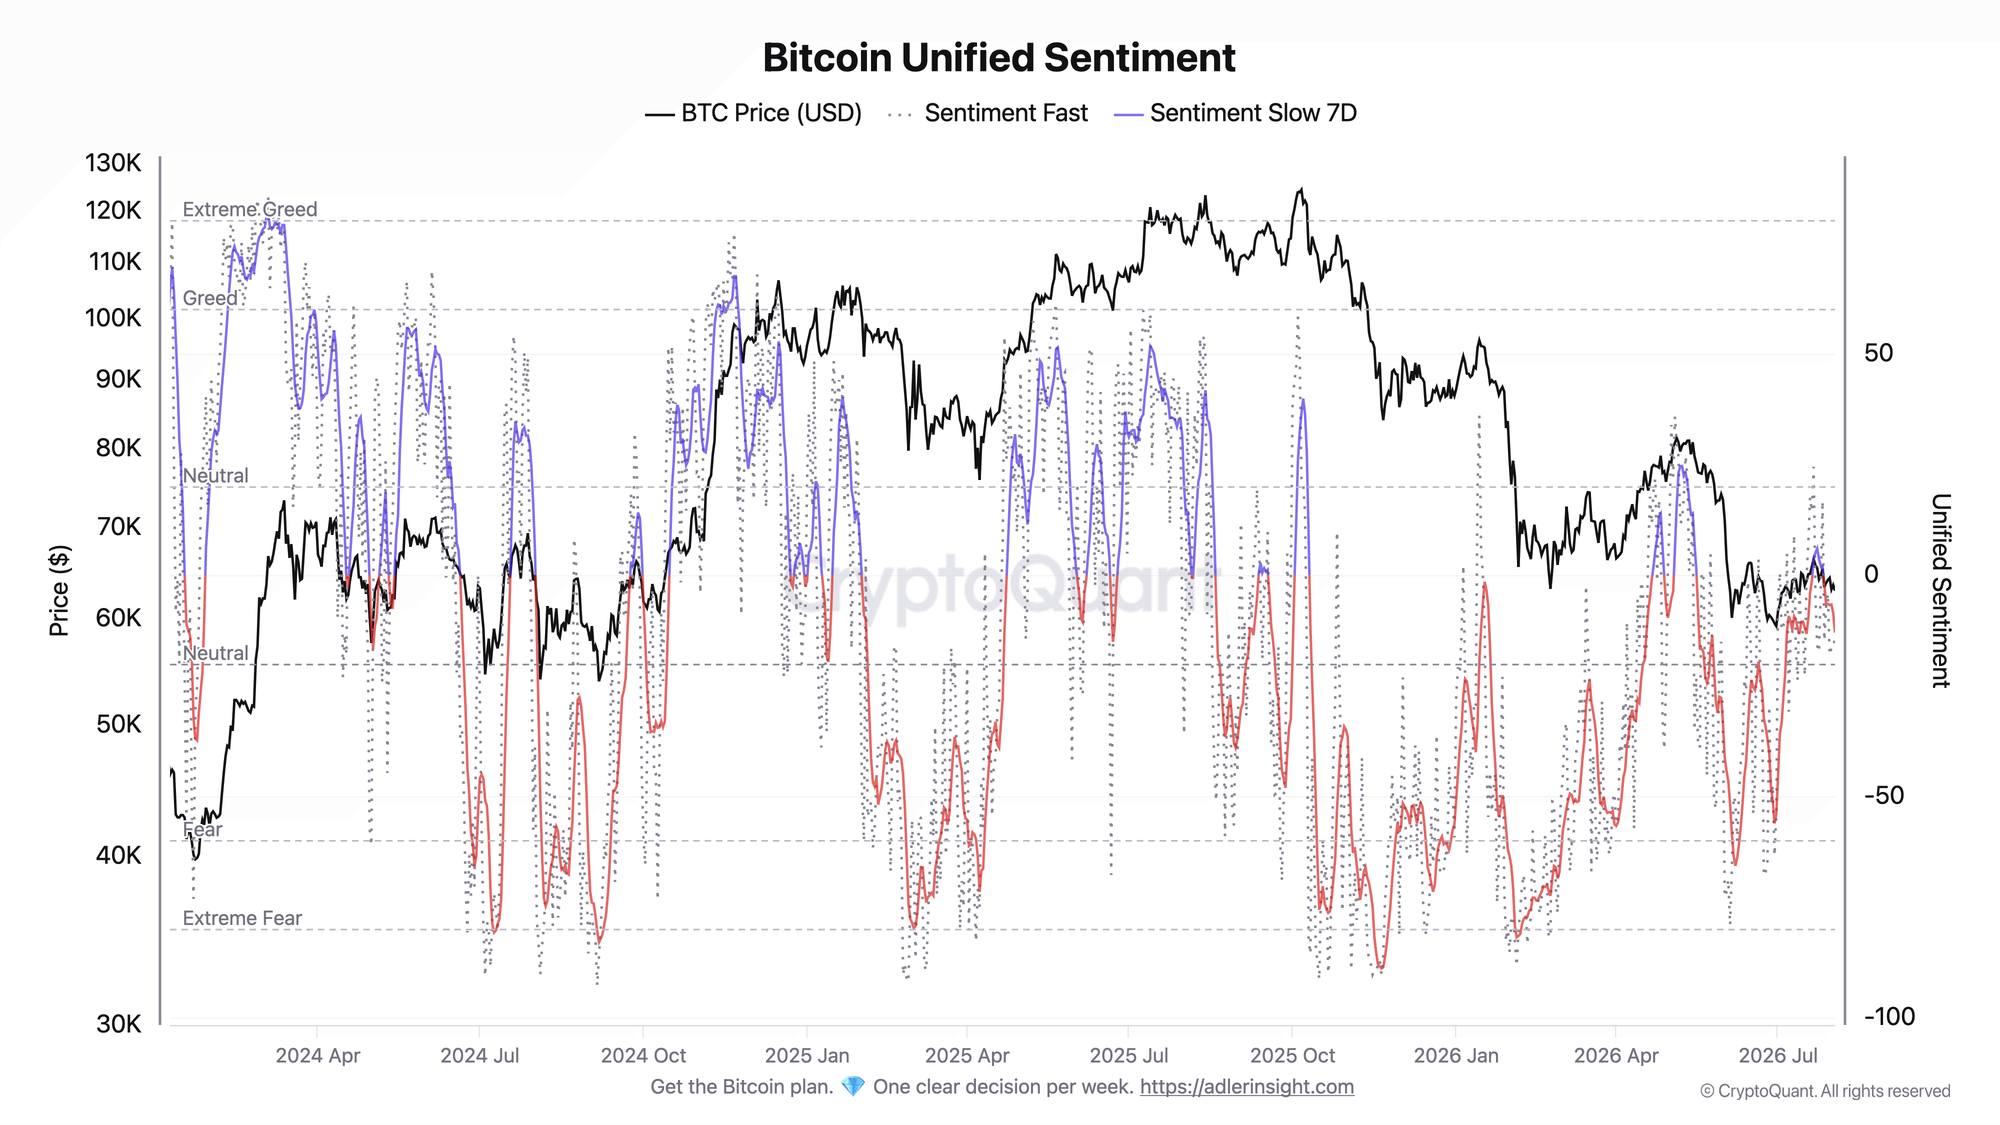
The slow line has fallen to -13 and continues to decline. In the second half of July, the index briefly moved above zero before turning lower again. The fast line is at -14 and continues to pull the smoothed reading down.
The market formally remains in the Neutral zone between -20 and +20, but it has already moved close to the lower boundary. Over the same period, BTC fell 5% from its local high, coinciding with the deterioration in sentiment.
The key signal of further deterioration is a sustained move in the slow line below -20 and a transition into the Fear zone. The first sign of recovery would be a turn higher in the index and a move back above zero.
Bitcoin 30-Day Forward Returns by Sentiment Zone
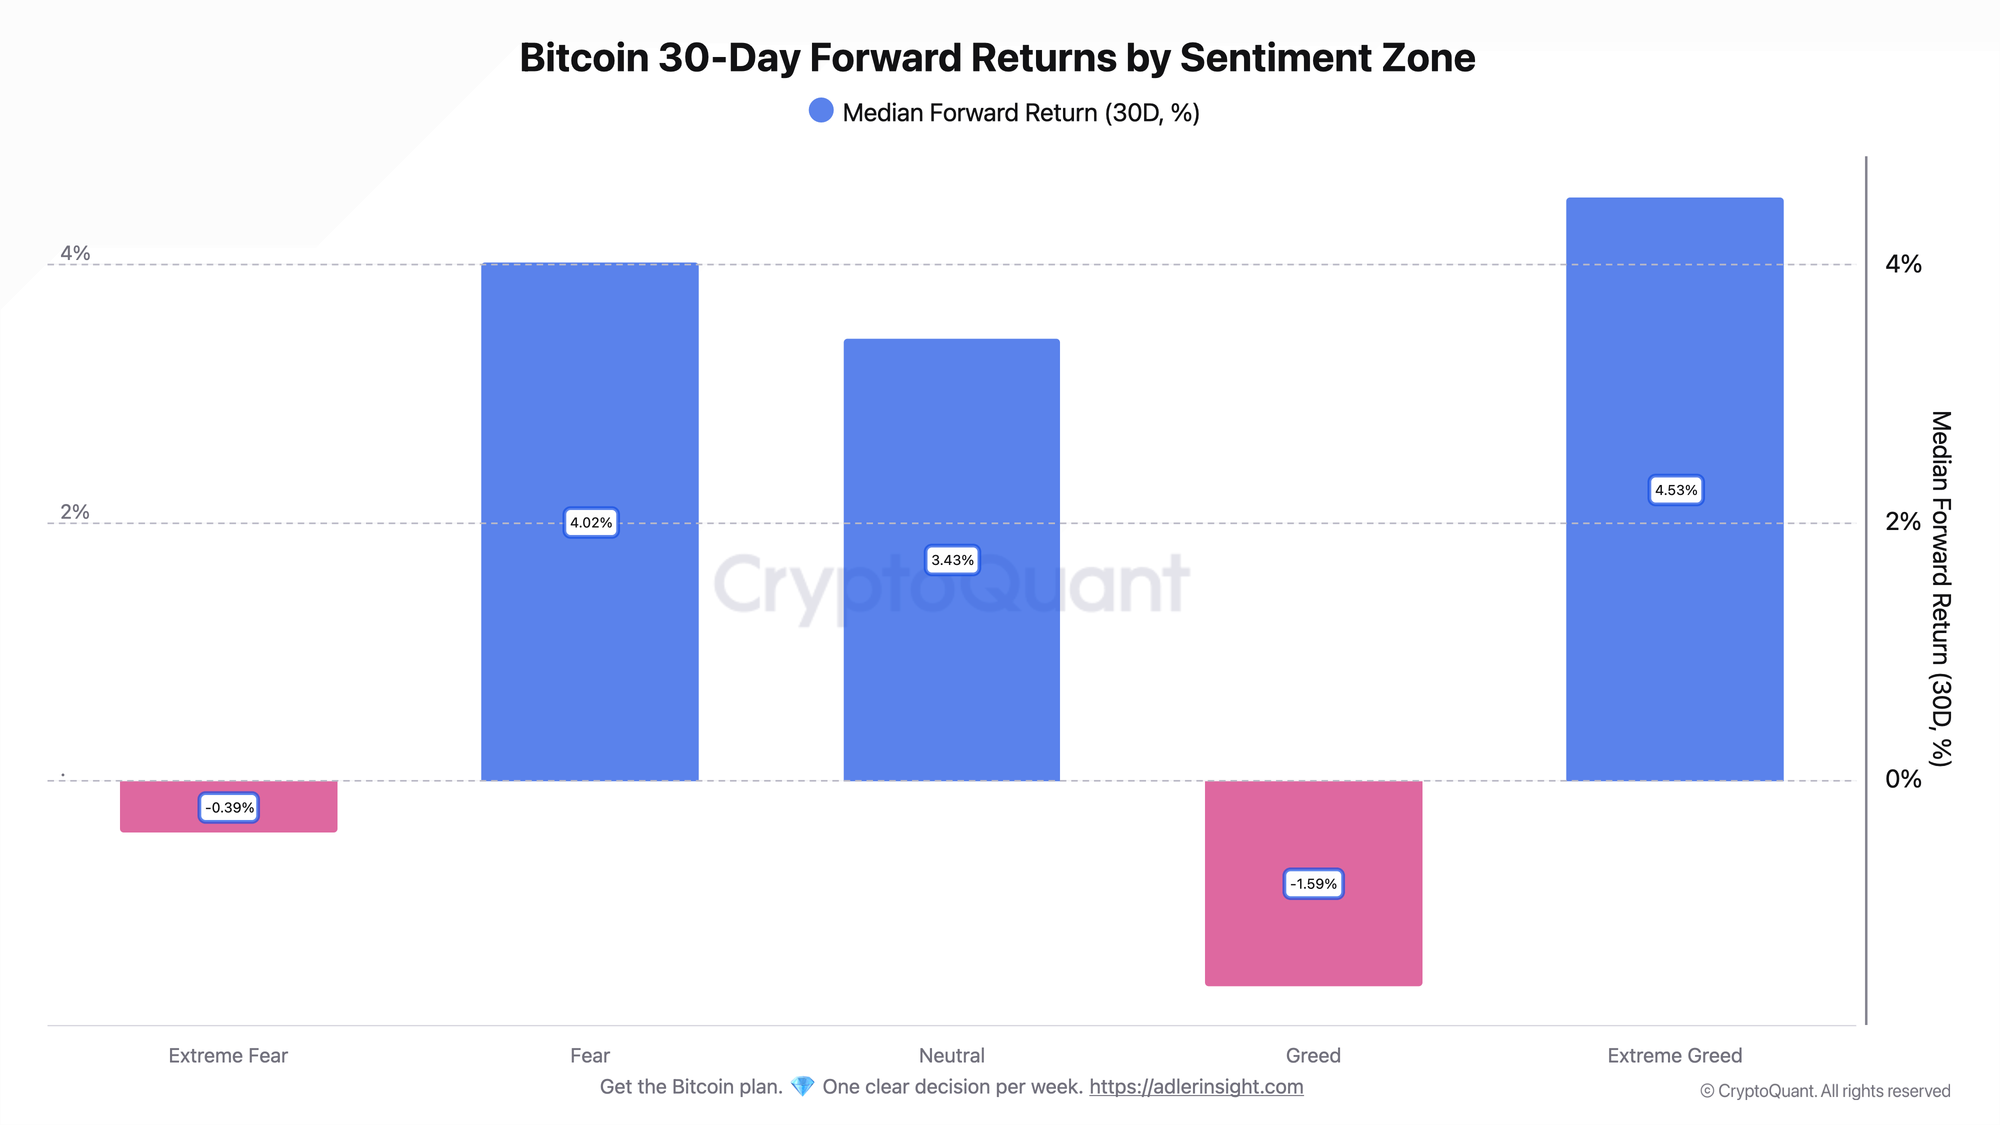
The highest median returns were recorded in Extreme Greed (+4.53%), Fear (+4.02%), and Neutral (+3.43%). Negative results were recorded in Greed (-1.59%) and Extreme Fear (-0.39%).
When the smoothed index was in the current Neutral zone, BTC's median 30-day return was +3.4%. For observations in the Fear zone, the median was slightly higher at +4.0%. In Extreme Fear, the result was negative at -0.4%.
Metric calculation: every Sunday, we record the zone the index is in and then measure how BTC's price changed over the next 30 days. Changes in sentiment during those 30 days are not included in the calculation.
The market is forming a bottom, but the best entry only comes after confirmation. Weekly Engine highlights early triggers, key levels, and scenario invalidation conditions. Try it free for 7 days.
FAQ
Which zone is the market in now, and what did that mean historically? The smoothed index is at -13. This is the Neutral zone with a tilt toward Fear. In the available weekly sample, BTC's median return 30 days after observations in this zone was +3.4%.
What counts as a regime change? A sustained move in the slow line below -20 would mark a transition into Fear. A move above +20 would mark a transition into Greed. Short-term fluctuations in the fast line do not change the regime on their own.
CONCLUSIONS
Bitcoin sentiment is deteriorating again, but the market remains in the Neutral zone. The index has moved closer to the Fear threshold, while BTC has fallen 5% from its local high.
In the weekly sample, BTC's median 30-day return after observations in the Neutral and Fear zones was +3.4% and +4.0%, respectively. However, the relationship between sentiment levels and subsequent returns is not linear.
The current situation remains neutral. Confirmation of a recovery would be a turn higher in the slow line and a move back above zero. A move below -20 would signal a deterioration in the regime.
Live Charts
Explore the metrics behind this brief with live, auto-updating charts:
Fear & Greed Index - Composite market sentiment for risk appetite and sentiment extremes.
NUPL - Net unrealized profit/loss across holders, mapped into cycle sentiment phases.
Supply in Profit - Share of circulating supply in profit as a cycle-phase and euphoria gauge.
STH-SOPR - Short-term holder profit/loss behavior around the 1.0 breakeven threshold.
Holder Behavior - All holder profitability and supply-cohort charts in one view.