
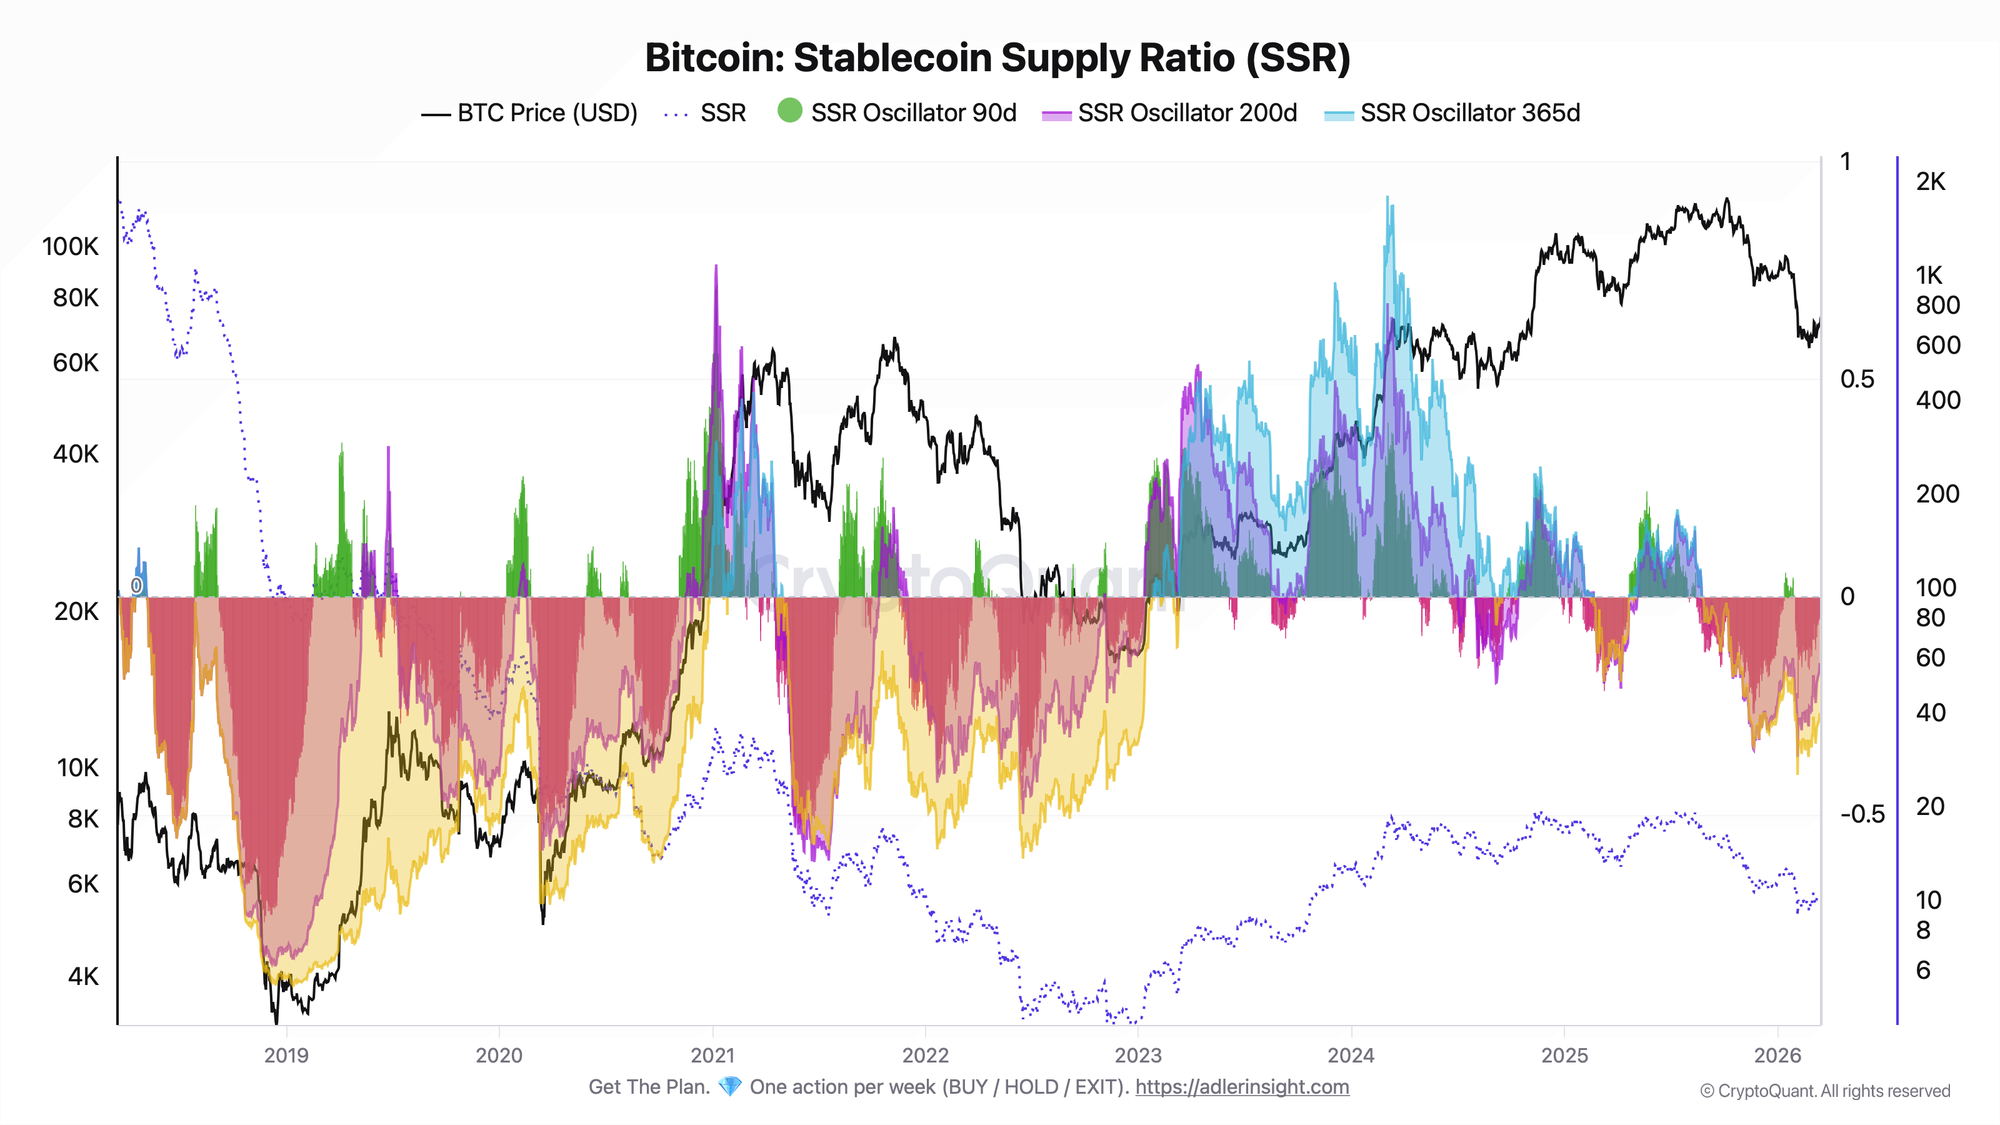
The Stablecoin Supply Ratio measures Bitcoin's market cap against the total stablecoin market cap - in a single number, it answers how much dry powder is sitting on the sidelines waiting to buy BTC. When SSR is low, stablecoins have strong buying power relative to Bitcoin. When SSR is high, that buying power is exhausted.
This guide covers the SSR formula, the three oscillator timeframes (90d / 200d / 365d), historical cycle evidence from 2018 to 2026, and a practical trading playbook built from 2,919 days of real CryptoQuant data.
TL;DR
- What it measures: The ratio of Bitcoin's market cap to the combined market cap of all major stablecoins (USDT, USDC, DAI, BUSD, and others)
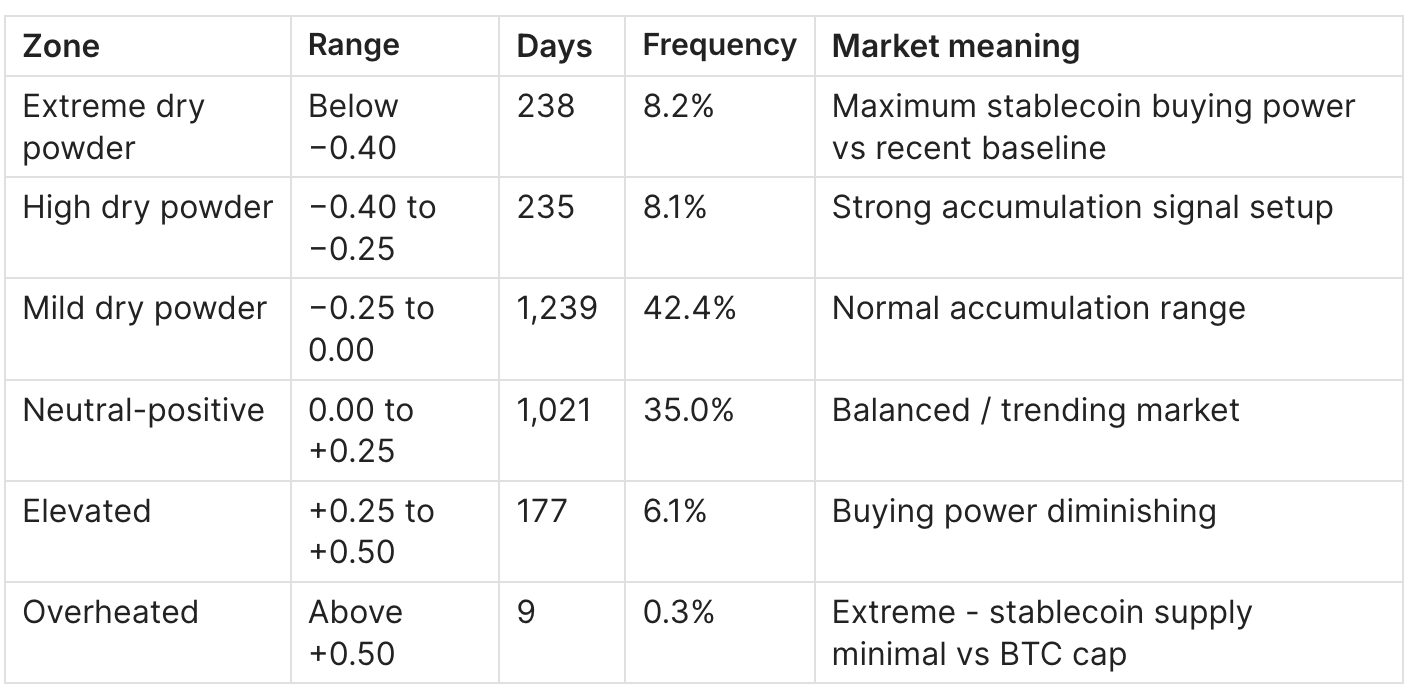
- Key thresholds: SSR Oscillator 90d below −0.25 = meaningful dry powder accumulation; below −0.40 = historically extreme (8.2% of all days)
- Best use case: Identifying accumulation phases and measuring stablecoin-driven buying pressure ahead of price moves
- Main limitation: Post-2022 structural collapse in SSR absolute values makes raw SSR useless without an oscillator; the metric also misses OTC and DeFi capital flows
- Combine with: Exchange Netflow (stablecoin inflows to exchanges), MVRV Ratio (valuation layer), STH SOPR (demand confirmation)
Table of Contents
- What Is the Stablecoin Supply Ratio?
- Formula
- Data Sources
- How SSR Is Calculated
- SSR Oscillators: The Real Signal Layer
- How to Interpret SSR Values
- Historical Cycle Examples
- Practical Playbook
- SSR vs Related Metrics
- How SSR Relates to Other Indicators
- Limitations
- FAQ
- Conclusion
What Is the Stablecoin Supply Ratio?
The Stablecoin Supply Ratio (SSR) is the ratio between Bitcoin's market capitalization and the aggregate market capitalization of all major stablecoins, denominated in BTC. It was introduced by Glassnode as a proxy for the supply and demand mechanics between BTC and USD-denominated capital sitting on the crypto sidelines.
In one line: SSR = how many times larger Bitcoin's market cap is compared to the total stablecoin supply - the smaller this number, the more buying power stablecoins have relative to BTC.
The underlying logic is straightforward. Stablecoins in crypto markets function as the equivalent of cash: holders who converted BTC into USDT or USDC are not out of the market - they are waiting. When the total stablecoin supply grows relative to Bitcoin's market cap, there is more potential demand sitting ready to re-enter. When stablecoin supply shrinks relative to Bitcoin (or Bitcoin's market cap grows faster), that dry powder has already been deployed.
The metric treats the crypto ecosystem as a partially closed system. Capital that leaves BTC either exits crypto entirely or parks in stablecoins. SSR captures the second category - the latent demand that has not yet converted back to Bitcoin.
There is one critical structural fact about SSR that most explanations miss: the absolute value of SSR is almost meaningless without context. From 2018 to 2021, SSR ranged from roughly 10 to over 1,700, as stablecoin supply was tiny relative to Bitcoin's market cap. After 2022, the stablecoin market grew to $150B+ while Bitcoin's market cap came down from its 2021 peak - collapsing SSR from the hundreds into the single digits permanently. The 2018 bottom had an SSR of 87.73. The 2022 bottom had an SSR of 4.12. These numbers are not comparable. This is why the oscillator versions of SSR - measuring deviation from moving averages - are the only reliable signal tools.
Formula
SSR = Bitcoin Market Cap / Total Stablecoin Market Cap
Where:
- Bitcoin Market Cap = current BTC supply × current BTC price (USD)
- Total Stablecoin Market Cap = sum of market caps for USDT, USDC, DAI, BUSD, TUSD, USDP, GUSD, SAI (and any other tracked stablecoins)
The three oscillator variants used in this guide:
SSR Oscillator 90d  = (SSR / SMA_90(SSR))  − 1
SSR Oscillator 200d = (SSR / SMA_200(SSR)) − 1
SSR Oscillator 365d = (SSR / SMA_365(SSR)) − 1
Where SMA_N is the N-day simple moving average of SSR. A positive oscillator value means the current SSR is above its moving average - Bitcoin's market cap is large relative to stablecoins (buying power is relatively low). A negative oscillator value means the current SSR is below its moving average - stablecoin supply is large relative to Bitcoin (dry powder is accumulating).
Data Sources
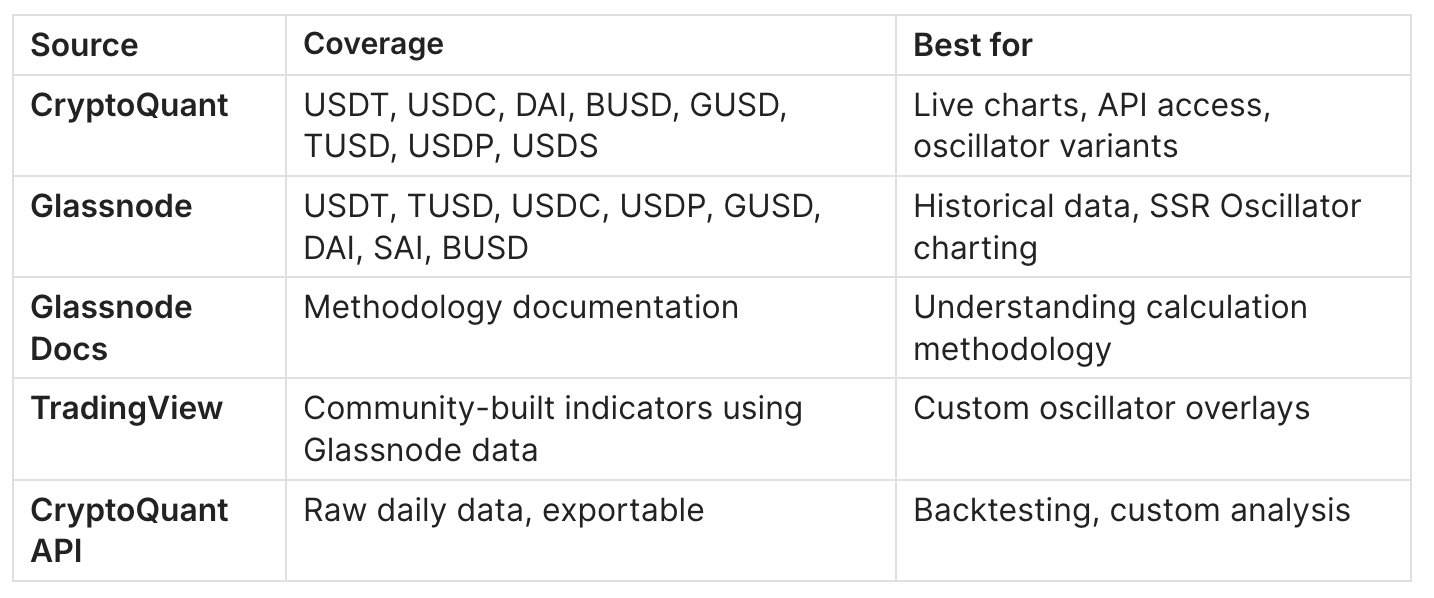
Note: Different providers include different stablecoin sets, which can create minor divergences in SSR readings. CryptoQuant and Glassnode are the primary institutional sources.
How SSR Is Calculated
Step 1: Calculate Bitcoin's Market Cap
Multiply the current circulating supply of BTC by its current price in USD.
Example (March 2026):
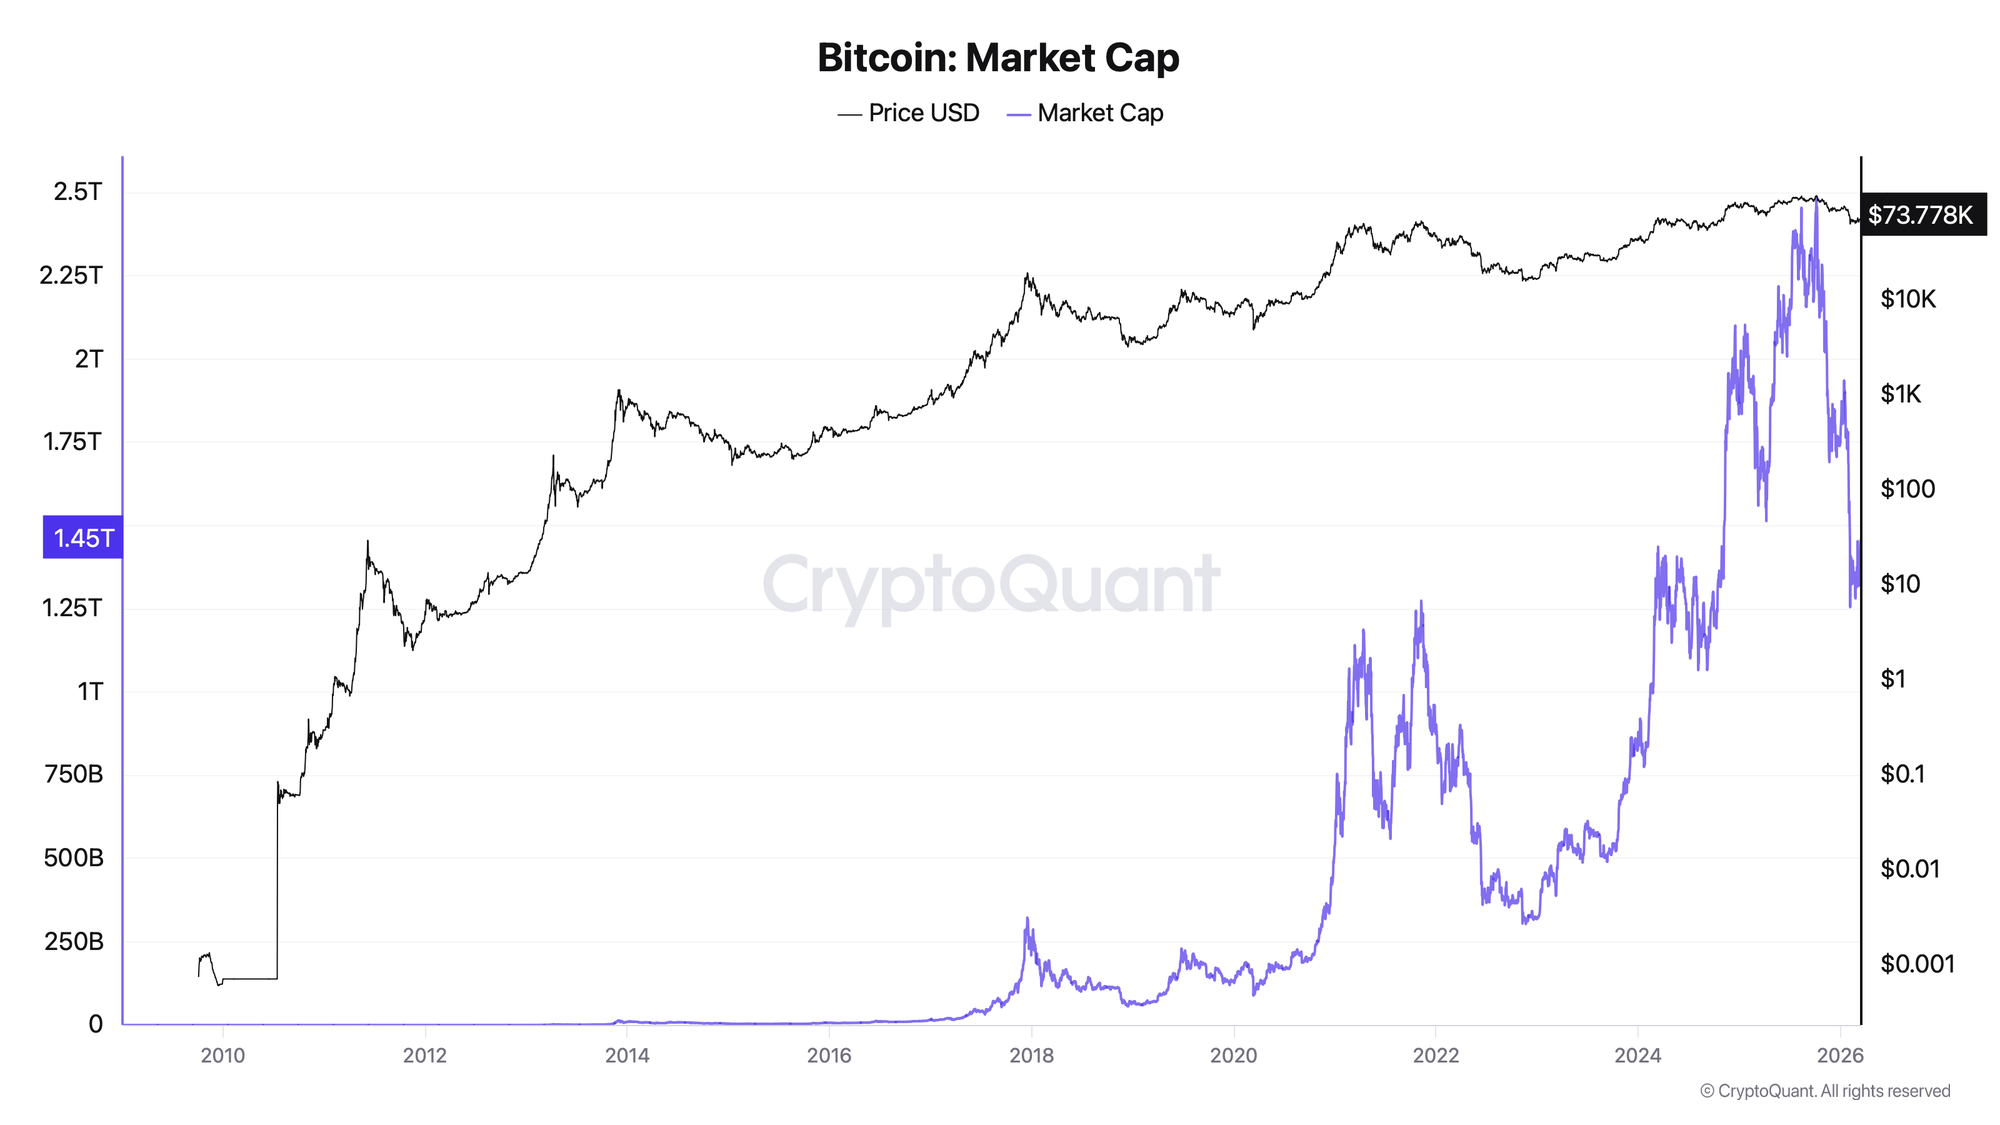
BTC supply ≈ 19.84 million BTC
BTC price ≈ $70,857
BTC Market Cap ≈ $1.406 trillion
Step 2: Sum the Total Stablecoin Market Cap
Aggregate the market capitalizations of all tracked stablecoins. As of early 2026, the combined supply of USDT, USDC, DAI, BUSD, and other tracked stablecoins totals approximately $130–140 billion.
Example (March 2026):
USDT market cap ≈ $130B (dominant)
USDC market cap ≈ $30B
DAI + others ≈ ~$5B
Total Stablecoin Market Cap ≈ $131B
Step 3: Compute SSR
SSR = $1,406B / $131B ≈ 10.73
Step 4: Compute the Oscillators
For each oscillator, divide the current SSR by its N-day moving average and subtract 1:
SSR_90d_MA = average of last 90 days of SSR values
SSR Oscillator 90d = (10.73 / 10.98) − 1 ≈ −0.023
A value of −0.023 means the current SSR is approximately 2.3% below its 90-day average - a mild signal that stablecoin buying power is slightly elevated relative to the short-term baseline.
Process visualization:
[BTC Price] × [BTC Supply]
        ↓
   BTC Market Cap
        ÷
[USDT + USDC + DAI + BUSD + others]
        ↓
   Raw SSR Value
        ÷
   SMA(SSR, N days)
        − 1
        ↓
   SSR Oscillator (90d / 200d / 365d)
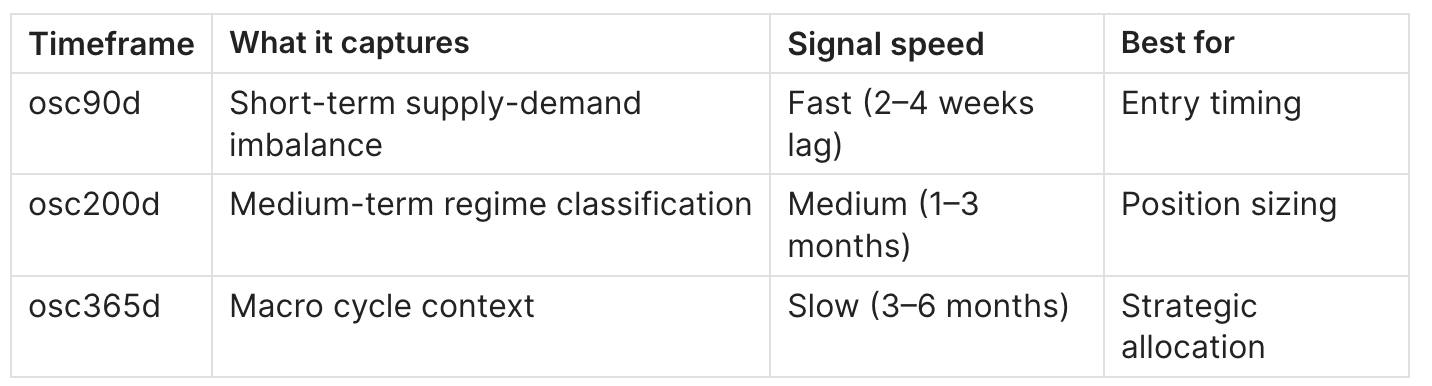
SSR Oscillators: The Real Signal Layer
The three oscillator timeframes serve different analytical purposes. Understanding which to use in which context is the core skill for applying SSR in practice.
SSR Oscillator 90d - Tactical Signal (Short-term dry powder)
The 90-day oscillator measures how much stablecoin buying power deviates from the recent short-term baseline. It responds quickly to sudden changes in stablecoin supply or Bitcoin price and is best used for identifying near-term accumulation setups.
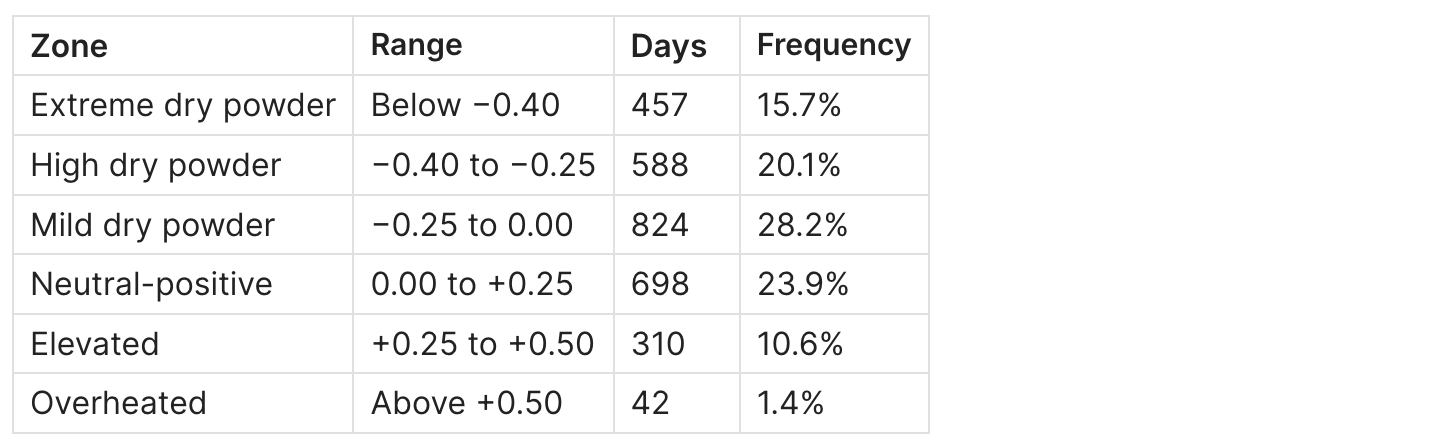
Distribution from 2,919 days of data:
Key data point: When SSR Oscillator 90d dropped below −0.25, BTC was higher 90 days later in 58% of cases with an average 90-day return of +17.7% across 473 historical occurrences. Not a trading signal in isolation, but meaningful context.
Historical extreme reading: January 7, 2021 - osc90 peaked at +0.720 as Bitcoin surged to $38,433 and stablecoin buying power was stretched thin relative to the short-term baseline.
All-time low: November 23, 2018 - osc90 hit −0.745 during the 2018 bear market collapse, with BTC at $4,331.
SSR Oscillator 200d - Cyclical Signal (Medium-term regime)
The 200-day oscillator filters out short-term noise and identifies the medium-term regime. It is slower to respond but produces fewer false signals. This is the most useful oscillator for determining whether the market is in an accumulation phase or a distribution phase relative to the 200-day baseline.
Distribution from historical data:
Notable reading: March 13, 2024 - SSR Oscillator 200d hit +0.597 as Bitcoin reached $73,010 during the ETF-driven rally. This was one of the highest 200d oscillator readings in the post-2022 era, indicating that stablecoin buying power was significantly stretched relative to the 200-day baseline at that peak.
All-time low: December 13, 2018 - osc200 hit −0.845 with BTC at $3,372 and SSR at 86.79.
SSR Oscillator 365d - Macro Signal (Cycle-level regime)
The 365-day oscillator is the slowest and most stable of the three. It filters almost all short-term noise and identifies where the market sits in the context of the full annual cycle. Extreme readings on the 365d oscillator are rare and historically significant.
All-time high: March 3, 2024 - osc365 reached +0.923 as Bitcoin approached its ATH at $62,682. This reading reflected that the entire year of stablecoin supply growth had been absorbed by rising BTC market cap - the stablecoin reservoir was depleted relative to the annual baseline.
All-time low: January 12, 2019 - osc365 hit −0.892 with BTC at $3,651. This extreme reading marked the depth of the 2018 bear market from an annual perspective.
Current reading (March 14, 2026): osc365 = −0.265, indicating that stablecoin supply remains meaningfully elevated relative to the 12-month average - a macro environment where dry powder is present, though not at extreme historical levels.
How to Interpret SSR Values
Primary Interpretation Framework
The three oscillators should be read together as a layered system:
Dry Powder Accumulation (Negative oscillators)
When all three oscillators are simultaneously negative - meaning SSR is below all three moving averages - it signals that stablecoin supply is elevated relative to Bitcoin's market cap across all timeframes. This is the strongest accumulation configuration.
What it typically means:
- Capital has rotated out of BTC into stablecoins (or new stablecoins have been minted) faster than Bitcoin's market cap has grown
- The market is building a larger reserve of potential demand
- Historically associated with accumulation phases, bear market recoveries, and mid-cycle corrections
Typical mistakes:
- Treating any negative reading as an immediate buy signal - negative oscillators can persist for months during bear markets
- Ignoring the absolute level: osc90d at −0.05 is barely negative; osc90d at −0.55 is an extreme historical reading
- Forgetting that stablecoins can leave crypto entirely (going to TradFi money markets), which inflates the apparent dry powder reading without representing actual crypto-denominated demand
Elevated Stablecoin Depletion (Positive oscillators)
When oscillators are positive - SSR above its moving averages - stablecoin supply is low relative to Bitcoin's market cap. This means available buying power has been partially or fully deployed.
What it typically means:
- Capital has been converting stablecoins into BTC (bullish deployment)
- The stablecoin reservoir is shrinking relative to Bitcoin's total value
- At extremes, this signals that the marginal buyer pool is thin - new demand must come from fresh capital entering crypto, not from sidelined stablecoin holders
March 2024 example: osc200d hit +0.597 at the $73,010 ATH - a reading that in retrospect confirmed that the stablecoin dry powder had been substantially deployed into Bitcoin during the ETF-driven rally.
Key Signal Levels
osc90d below −0.25: 473 historical occurrences (16.3% of days). Average 90-day forward return: +17.7%. Not a directional guarantee, but a meaningful statistical tilt.
osc90d below −0.40: 238 historical occurrences (8.2% of days). Clusters around major cycle bottoms and severe corrections.
osc200d above +0.50: 42 historical occurrences (1.4% of days). Historically associated with cycle tops and overheated bull markets.
osc365d reading of −0.265 (current, March 2026): Places the current market in the mild-to-moderate dry powder zone from a macro perspective - stablecoin supply is about 26.5% above the annual average SSR, meaning Bitcoin's market cap is relatively smaller vs stablecoins than the 12-month trend. Similar historical periods include mid-2021 corrections and the 2023 recovery phase.
Historical Cycle Examples
Example 1: The 2018 Bear Market Bottom
Situation: Bitcoin declined from $19,800 in December 2017 to a cycle low of $3,231 on December 15, 2018. The bear market lasted approximately 12 months.
SSR behavior:
- SSR reached 87.73 at the December 15 bottom (BTC = $3,231)
- Earlier in November 2018 (BTC at $6,451), SSR spiked to 227.35 as Bitcoin's market cap was still relatively large vs stablecoins
- By the bottom, osc90d had collapsed to −0.697, osc200d to −0.841, and osc365d to −0.887
- These three readings - all deeply negative simultaneously - reflected that stablecoin supply had grown substantially while BTC market cap cratered
Price behavior: BTC bottomed at $3,231. Recovery to $13,800 occurred over the following 7 months.
Conclusion: The simultaneous extreme negative readings across all three oscillators confirmed the magnitude of the capitulation. The signal was not "buy immediately" - the market stayed in this extreme zone for several weeks - but it correctly identified a historically significant accumulation window.
Example 2: COVID Crash Bottom (March 2020)
Situation: Bitcoin fell from $10,500 to $5,025 on March 16, 2020 in a 48-hour crash driven by macro panic selling.
SSR behavior:
- SSR at the bottom: 22.06 (dramatically lower than 2018 in absolute terms, but this reflects the structural stablecoin market growth)
- osc90d: −0.531 - extreme reading, indicating stablecoin supply had surged relative to the short-term SSR baseline
- osc200d: −0.567 - also extreme
Price behavior: Bitcoin recovered from $5,025 to over $63,000 in approximately 13 months.
Conclusion: The March 2020 extreme osc90d reading (−0.531) correctly flagged the maximum fear event and subsequent accumulation opportunity. The rapid recovery in stablecoin flows to exchanges confirmed demand re-entry.
Example 3: 2021 Cycle Peak
Situation: Bitcoin reached two major peaks in 2021 - $63,567 on April 14 and $67,351 on November 9.
SSR behavior at April 2021 peak ($63,567):
- SSR: 30.07
- osc90d: +0.031 (barely positive - dry powder not yet fully depleted)
- osc200d: +0.217
- osc365d: +0.271
SSR behavior at November 2021 ATH ($67,351):
- SSR: 15.60 (dramatically lower - stablecoin supply had grown substantially since April)
- osc90d: +0.105
- osc200d: +0.129
- osc365d: −0.213 (still negative at the annual level - the macro dry powder had not been fully depleted)
Conclusion: The divergence between the April and November 2021 peaks is informative. By November, the growing stablecoin supply (USDC and USDT both expanded massively through 2021) kept the 365d oscillator negative even at ATH prices - a false comfort signal. This illustrates the metric's key limitation: structural stablecoin supply growth can mask SSR signals during major bull markets.
Example 4: FTX Collapse Bottom (November 2022)
Situation: Bitcoin fell from $20,000 to $15,987 on November 21, 2022 following the FTX bankruptcy.
SSR behavior:
- SSR at bottom: 4.12 - this is where the post-2022 structural shift becomes stark. An SSR of 4.12 vs 87.73 in 2018 reflects the massive growth in stablecoin supply, not a different market condition
- osc90d: −0.126 - relatively mild negative, not at historic extremes
- osc200d: −0.196
- osc365d: −0.404
Price behavior: Bitcoin recovered from $15,987 to over $73,000 by March 2024.
Conclusion: The 2022 FTX bottom did not produce the same extreme oscillator readings as 2018 or March 2020. This is because the stablecoin market had grown proportionally alongside crypto - the relative buying power signal was less extreme even though the absolute price crash was severe. The osc365d reading of −0.404 was the most meaningful signal, indicating genuine macro-level dry powder accumulation.
Example 5: 2024 ETF Era - March Peak
Situation: Bitcoin reached $73,010 on March 13, 2024, driven by spot ETF approval flows and halving anticipation.
SSR behavior:
- SSR: 18.21
- osc90d: +0.339 - elevated, indicating dry powder was being deployed
- osc200d: +0.597 - near the highest post-2022 reading, suggesting stablecoin buying power was substantially below the 200-day baseline
- osc365d: +0.854 - the highest 365d oscillator reading in the entire dataset
Price behavior: Bitcoin corrected to approximately $57,000 before recovering to a new ATH of $106,427 in December 2024.
Conclusion: The triple-positive oscillator configuration at the March 2024 peak - especially osc365d at +0.854 - was the strongest overheated SSR signal since 2021. It correctly identified a period of depleted stablecoin buying power that preceded a meaningful correction, though not the end of the bull market.
Example 6: 2025 Cycle Peak
Situation: Bitcoin reached $124,612 on October 6, 2025.
SSR behavior:
- SSR: 16.04
- osc90d: −0.065 - mildly negative even at the peak
- osc365d: −0.042 - also mildly negative
Conclusion: The 2025 peak showed a different SSR profile than March 2024. The oscillators remained mildly negative through the top, reflecting that the stablecoin market had continued to grow through 2025. This illustrates the ongoing challenge of interpreting SSR in a structurally expanding stablecoin market - the macro dry powder signal persisted even as prices reached new all-time highs.
Practical Playbook
Accumulation Setup (Potential buy zone)
Signal conditions:
- SSR Oscillator 90d below −0.25
- SSR Oscillator 200d also negative (ideally below −0.20)
- Trend: oscillators moving more negative over the previous 2–4 weeks
Confirmation conditions (2–3 required):
- Stablecoin Exchange Netflow turning positive (USDT/USDC flowing onto exchanges = preparation to buy BTC)
- STH SOPR below 1.0 (short-term holders realizing losses - capitulation)
- MVRV Ratio below 1.5 (BTC market-wide at or near realized value)
- Exchange Netflow for BTC turning negative (BTC leaving exchanges = accumulation)
Invalidation signals:
- Oscillators moving back toward zero rapidly without a price recovery (capital rotating to DeFi or leaving crypto rather than buying BTC)
- Stablecoin inflows to exchanges not confirmed within 10–14 days
- Continued negative funding rates (market net short - stablecoin dry powder is hedged, not accumulating)
Risk guidance: This configuration identifies potential accumulation windows, not price bottoms. It is a risk-reduction filter, not an entry trigger. Position sizing should account for the possibility that oscillators remain negative for weeks to months during prolonged bear markets.
Distribution Watch (Risk-off zone)
Signal conditions:
- SSR Oscillator 200d above +0.30
- SSR Oscillator 365d above +0.20
- Both oscillators trending more positive over the previous 4–8 weeks
Confirmation conditions:
- MVRV Ratio above 3.0 (market-wide profit-taking signal)
- Exchange Netflow for BTC turning positive (BTC moving to exchanges = selling intent)
- Funding Rate elevated (above +0.3%/day aggregate) - leveraged longs dominant
- Stablecoin Exchange Netflow turning negative (USDT/USDC leaving exchanges)
Invalidation signals:
- Major new stablecoin minting event (Tether or Circle issues large USDT/USDC batch) can mechanically reset SSR oscillators without reflecting actual demand change
- ETF inflows driving spot demand without touching the perpetual market - SSR may stay elevated even as genuine demand continues
Risk guidance: Elevated and overheated oscillator readings indicate thin stablecoin buying power as a backstop. They do not guarantee imminent price declines - bull markets can persist with depleted stablecoin dry powder if fresh fiat capital continues entering through ETFs or spot markets.
Neutral / Wait Zone
Configuration: osc90d between −0.10 and +0.10, osc200d between −0.20 and +0.20
This range accounts for approximately 60–65% of all historical trading days. In this zone, SSR provides no directional edge on its own. Switch to other metrics - MVRV, funding rates, exchange flows - as primary signals.
SSR vs Related Metrics
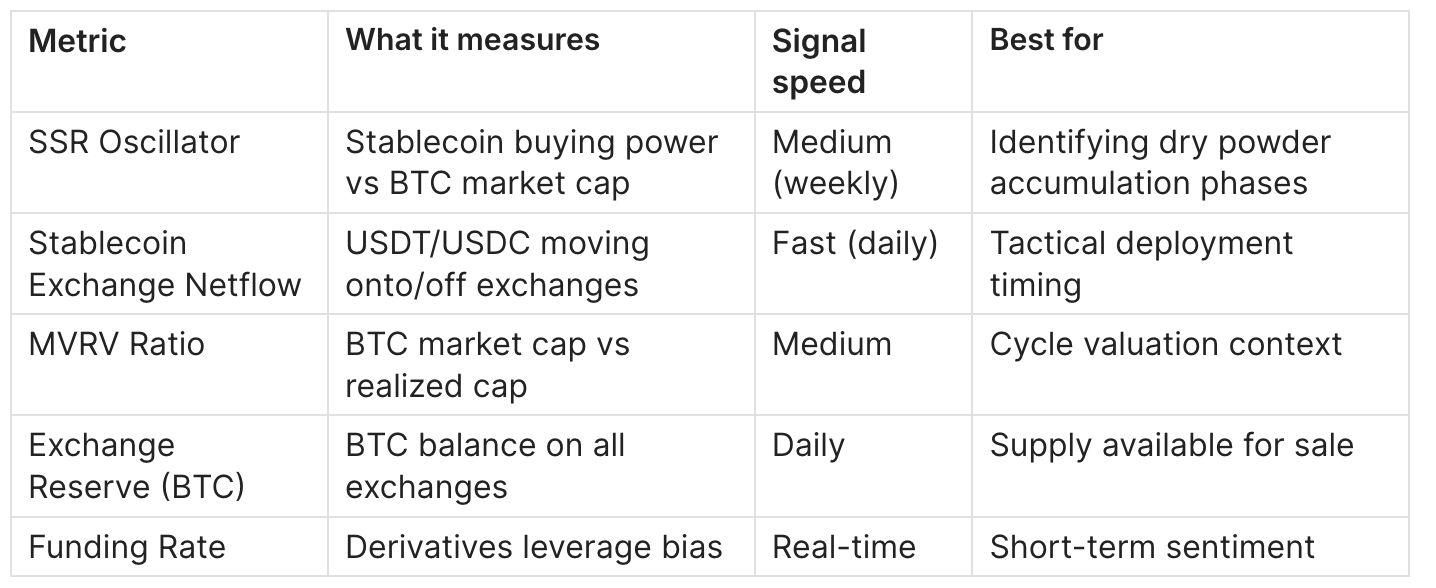
When to use SSR over alternatives
Use SSR when you want to understand structural dry powder - the macro-level reserve of stablecoin capital that could rotate into Bitcoin. It is most valuable in two specific contexts: identifying major accumulation phases (osc90d and osc200d both deeply negative) and identifying late-cycle depletion (osc200d and osc365d both significantly positive).
Use Stablecoin Exchange Netflow instead when you want to understand tactical deployment - whether stablecoins are actively moving onto exchanges right now, signaling near-term buying intent.
Combined analysis
Recipe 1 - High-conviction accumulation:
SSR osc90d < −0.30
+ Stablecoin Exchange Netflow turning positive (USDT inflows to exchanges rising)
+ STH SOPR < 1.0 (capitulation confirmed)
= Strongest accumulation signal combination
Recipe 2 - Distribution confirmation:
SSR osc200d > +0.40
+ BTC Exchange Netflow positive (BTC entering exchanges)
+ MVRV Ratio > 3.0
= Distribution phase confirmed, reduce exposure
How SSR Relates to Other Indicators
SSR and MVRV: Both are ratio-based on-chain indicators that measure relative market conditions, but from different angles. MVRV measures whether BTC holders are in aggregate profit or loss (market cap / realized cap). SSR measures whether external capital (stablecoins) has the firepower to push prices higher. They are complementary: MVRV tells you where existing holders stand; SSR tells you whether new money is available to move price.
SSR and Exchange Netflow: Exchange Netflow measures the daily flow of BTC onto or off exchanges. SSR measures the structural pool of stablecoin capital. They operate on different timescales: SSR shows the macro backdrop; Exchange Netflow shows the tactical execution. A strong accumulation signal requires both - a large stablecoin reserve (low SSR oscillator) plus active deployment of that reserve (stablecoin inflows to exchanges).
SSR and Funding Rate: Funding rates reflect derivatives market leverage. SSR reflects spot/stablecoin market structure. When SSR oscillators are deeply negative (large dry powder) but funding rates are also negative (market net short), it creates a setup where potential buyers exist but have hedged their exposure. When SSR oscillators are negative and funding turns positive, it signals that dry powder is beginning to actively buy unhedged spot positions - a higher-conviction accumulation signal.
SSR and the 4-Year Bitcoin Cycle: SSR oscillator extremes map relatively consistently to cycle phases. Deep negative readings across all three oscillators tend to cluster at or near cycle bottoms and mid-cycle corrections. Elevated positive readings on the 200d and 365d oscillators tend to cluster at or near cycle tops. The absolute SSR value has become less useful as the stablecoin market matured, but the oscillator-based readings preserve the signal across cycles.
Limitations
1. Structural stablecoin market growth distorts raw SSR
The stablecoin market grew from approximately $10B in early 2020 to over $140B by 2026. This structural expansion means raw SSR has trended downward for six years, making cross-cycle comparison of absolute values impossible. The pre-2022 mean SSR was 188; the post-2022 mean is 11. Solution: always use oscillators, never raw SSR, for signal generation.
2. OTC and DeFi capital flows are invisible
SSR captures stablecoins on tracked exchange wallets. Institutional capital that enters Bitcoin through OTC desks, ETF purchases, or DeFi protocols does not appear in the stablecoin supply calculation. The March 2024 ETF-era rally saw Bitcoin approach $73,000 while SSR oscillators remained elevated - because ETF demand bypassed the stablecoin market entirely. This is the metric's most significant structural limitation in the post-ETF era.
3. Stablecoin minting events create noise
When Tether or Circle issues a large batch of new USDT or USDC (sometimes billions in a single day), SSR drops mechanically - not because demand for BTC has changed, but because the denominator increased. These minting events can temporarily make the market look more bullish than it is. Cross-reference with on-chain stablecoin deployment data before acting on sudden SSR drops.
4. Geographic concentration
The stablecoin market is heavily weighted toward USDT, which represents approximately 70%+ of total stablecoin supply. Regional events (Tether regulatory actions, USDT peg events) can distort the SSR reading without reflecting genuine market-wide changes in BTC demand.
5. The metric cannot distinguish parked vs. departing capital
When stablecoin supply grows, it could mean (a) capital rotating out of BTC into stablecoins waiting to return, or (b) capital exiting crypto entirely into TradFi money market funds, which has become more common in high-interest-rate environments. SSR cannot distinguish between these two scenarios. During the 2022–2023 period, higher interest rates attracted stablecoin holders to off-chain yield products, inflating stablecoin supply without representing genuine crypto demand.
FAQ
What is the Stablecoin Supply Ratio?
The Stablecoin Supply Ratio (SSR) is the ratio of Bitcoin's market cap divided by the combined market cap of all major stablecoins. It measures how much buying power stablecoins have relative to Bitcoin's total value. A lower SSR means stablecoins can buy a larger portion of Bitcoin's market cap - indicating more dry powder available to drive price higher.
Where can I find SSR data?
The primary sources are CryptoQuant (which provides SSR with oscillator variants) and Glassnode Studio. Both require an account; basic SSR charts are available on free tiers while oscillator data and historical exports typically require paid access. CryptoQuant's API provides daily data going back to 2017 for custom analysis.
Why did SSR collapse from 200+ to under 20 after 2022?
This reflects the structural growth of the stablecoin market. In 2018, total stablecoin supply was approximately $2–3B. By 2026, it exceeds $140B. Even though Bitcoin's market cap also grew substantially, the rate of stablecoin supply expansion was faster - particularly during the 2021–2023 period when USDT and USDC expanded dramatically. This is why raw SSR values before and after 2022 are not directly comparable and why oscillators are essential.
What does an SSR Oscillator 90d value of −0.024 mean (current March 2026)?
It means the current SSR is approximately 2.4% below its 90-day moving average - a mildly negative reading indicating that stablecoin buying power is slightly elevated relative to the recent short-term baseline. This is not an extreme signal; historically, this range (−0.10 to 0.00) represents the most common market state (part of the 42.4% of days in the mild dry powder zone). The more informative current readings are osc200d at −0.150 and osc365d at −0.265, which indicate moderate dry powder accumulation at medium and macro timeframes.
Can SSR be used for altcoins?
The metric was designed specifically for Bitcoin and its relationship to the stablecoin market. While a similar ratio could theoretically be constructed for Ethereum (ETH market cap / stablecoin supply), the dynamics differ because ETH competes with BTC for stablecoin capital in a more complex ecosystem. The SSR framework works best for Bitcoin because stablecoins in crypto primarily serve as a proxy for USD demand for BTC.
What is the SSR Oscillator 365d and why does it matter?
The 365d oscillator measures whether the current SSR is above or below its 12-month moving average. It filters out all short and medium-term noise and identifies the macro cycle regime. The all-time high (March 2024 at +0.923) and all-time low (January 2019 at −0.892) of this oscillator have historically aligned closely with major cycle tops and bottoms. It is the slowest-moving but most cycle-relevant version of the signal.
How reliable is SSR as a standalone indicator?
Not reliable enough to use in isolation. In a backtest across 2,919 days, an osc90d reading below −0.25 was followed by higher prices 90 days later in 58% of cases - better than a coin flip, but not sufficient for position management without confirmation. SSR is best used as a background condition filter: it tells you whether the structural environment supports accumulation or distribution. Entry and exit decisions require additional confirmation from on-chain flow data, MVRV, and derivatives metrics.
What is the difference between SSR and Stablecoin Dominance?
Stablecoin Dominance measures stablecoins as a percentage of total crypto market capitalization (including all altcoins). SSR measures only the Bitcoin vs. stablecoin relationship. SSR is more precise for Bitcoin-specific analysis; Stablecoin Dominance is more relevant for broad crypto market rotation analysis.
What is the best combination for using SSR in practice?
Based on the historical signal analysis, the highest-conviction configurations are:
- Accumulation: SSR osc90d < −0.30 + Stablecoin Exchange Netflow (positive, USDT entering exchanges) + STH SOPR < 1.0
- Distribution: SSR osc200d > +0.40 + osc365d > +0.20 + MVRV Ratio > 3.0
Both configurations should be confirmed by at least two additional indicators before acting. Neither should be treated as a standalone trading signal.
Conclusion
The Stablecoin Supply Ratio is one of the few on-chain indicators that directly measures the pool of capital waiting outside Bitcoin rather than the behavior of existing Bitcoin holders. Used through its oscillator variants, it provides a reliable structural signal of whether dry powder is accumulating (potential support for a rally) or depleting (approaching exhaustion of stablecoin-driven demand).
Five key takeaways from 2,919 days of data:
- Raw SSR is not useful for cross-cycle analysis - the absolute value collapsed from 188 (pre-2022 mean) to 11 (post-2022 mean) due to stablecoin market growth. Always use oscillators.
- The 200d oscillator is the most practical cycle signal - it correctly identified the March 2024 peak (+0.597) and the 2018/2020 bottoms (−0.567 to −0.841) without the noise of the 90d or the lag of the 365d.
- Triple-negative readings are rare and significant - when osc90d, osc200d, and osc365d are simultaneously negative and all below −0.20, it historically marks major accumulation opportunities (238 total days at extreme levels).
- The post-ETF era has changed SSR dynamics - institutional spot buying through ETFs bypasses the stablecoin market entirely, meaning SSR oscillators can remain elevated even during genuine bull markets. It is a necessary but no longer sufficient liquidity signal.
- SSR works best in combination - pair with Stablecoin Exchange Netflow for deployment confirmation, MVRV for valuation context, and STH SOPR for demand validation.
Current reading (March 14, 2026): osc90d = −0.024, osc200d = −0.150, osc365d = −0.265. The market sits in moderate dry powder territory at medium and macro timeframes - structural conditions are supportive, but not at historic accumulation extremes.
Combine With
- Bitcoin Exchange Netflow
Why: Confirms that stablecoin dry powder is actively deploying (moving to exchanges to buy BTC)
Guide: Bitcoin Exchange Netflow: What It Is and How to Use It - MVRV Ratio
Why: Adds valuation context - SSR tells you if buying power exists; MVRV tells you if the price is cheap or expensive relative to realized value
Guide: Bitcoin MVRV Ratio: Definition, Formula & Cycle Signals - STH SOPR
Why: Confirms demand from new buyers - when STH SOPR recovers above 1.0 while SSR oscillators are negative, it signals that dry powder is converting into realized demand
Guide: Bitcoin STH SOPR: What It Is and How to Use It - Track SSR and 30+ on-chain metrics every morning: Adler AM - Free Daily Brief
- Get the weekly signal (BUY / HOLD / EXIT) built on SSR, MVRV, SOPR and more: Adler Insight - Weekly Engine