
🎧 Morning Brief #142 - audio debate on today’s market setup
Bitcoin is trading at $68,699 - down 44.8% from the October peak of $124.5K. Realized Price stands at $54,140, and the 1.25x Realized Price zone ($67,675) remains the primary structural reference for the weeks ahead.
TL;DR
The current correction remains noticeably milder than the more severe bear phases of 2017-18 and 2021-22 at a comparable stage of the cycle, but does not in itself confirm that the bottom has already formed. Price is sitting just above 1.25x Realized Price, placing the market right at a key valuation zone. As long as this zone holds - or price quickly reclaims it after brief dips below - the structural context remains neutral. A sustained break below raises the probability of a deeper test toward Realized Price.
Bitcoin Realized Pricing Bands
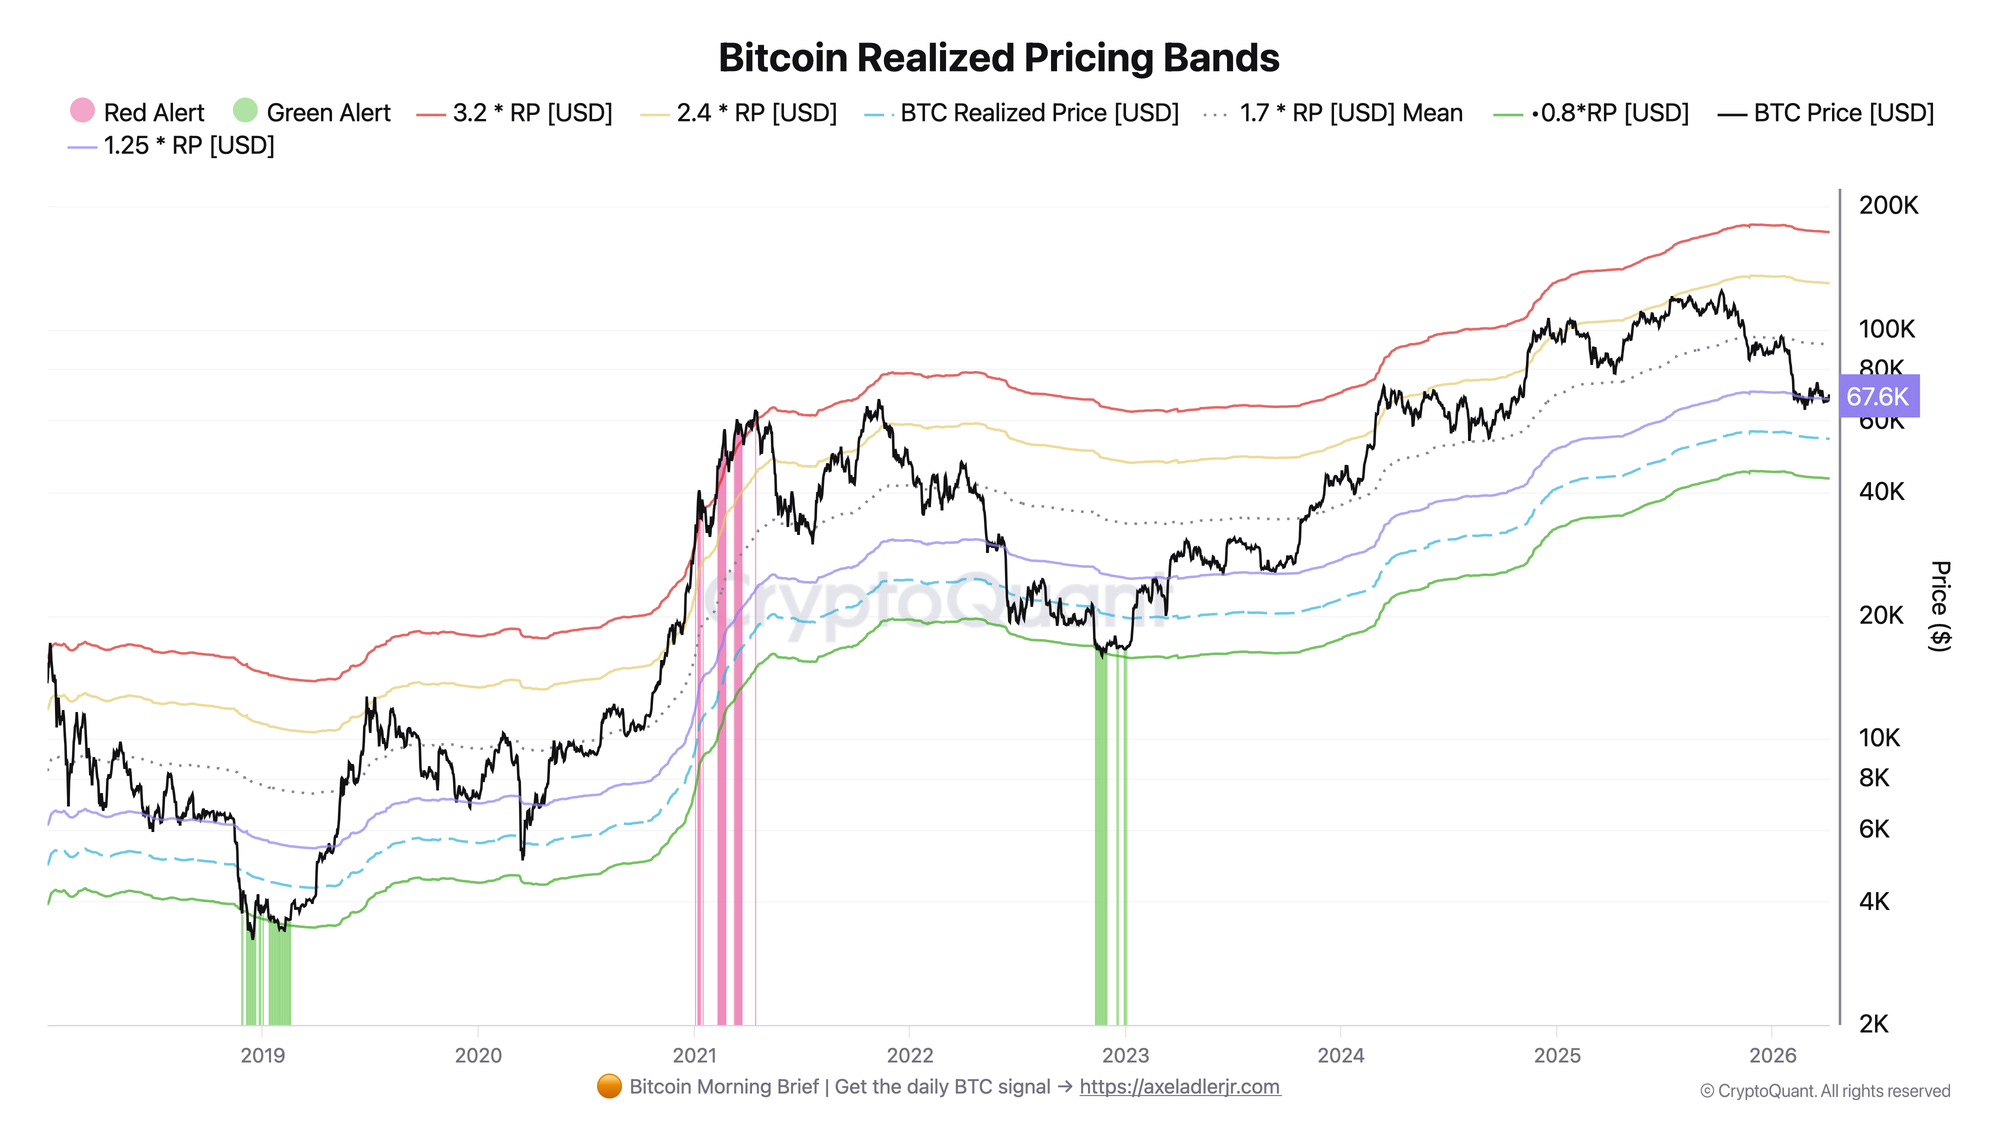
Realized price bands divide the market into regimes - from the stress zone and fair value to late-stage bull expansion zones. As of April 7, 2026, the Realized Price is $54,140, the 1.25x RP level is $67,675, and Bitcoin is trading at $68,699. That is only approximately $1,000 above the key boundary, meaning the market is not sitting comfortably above a strong support - it is right in the middle of testing it.
The model's mid-band at 1.7x RP sits at $92,038. That is approximately $23.3K above the current price and reflects the scale of the shortfall relative to the neutral valuation zone following the pullback from the October peak. The upper bull band at 2.4x RP is currently at $129,936, but it is more appropriate to treat it as the upper range of a strong bull scenario rather than a direct target for any given date.
The key takeaway here is straightforward: 1.25x RP is better treated as a support zone, not a precise line. Price has already dipped below it and returned several times, so what matters is not the breach itself, but the market's ability to quickly reclaim the level and close above it. As long as that condition holds, the scenario of a gradual recovery toward 1.7x RP remains open. If the market instead accepts prices below this zone as the new norm, the risk of a move toward Realized Price and the $54-58K range increases meaningfully.
Bitcoin Bear Market Correction Drawdowns
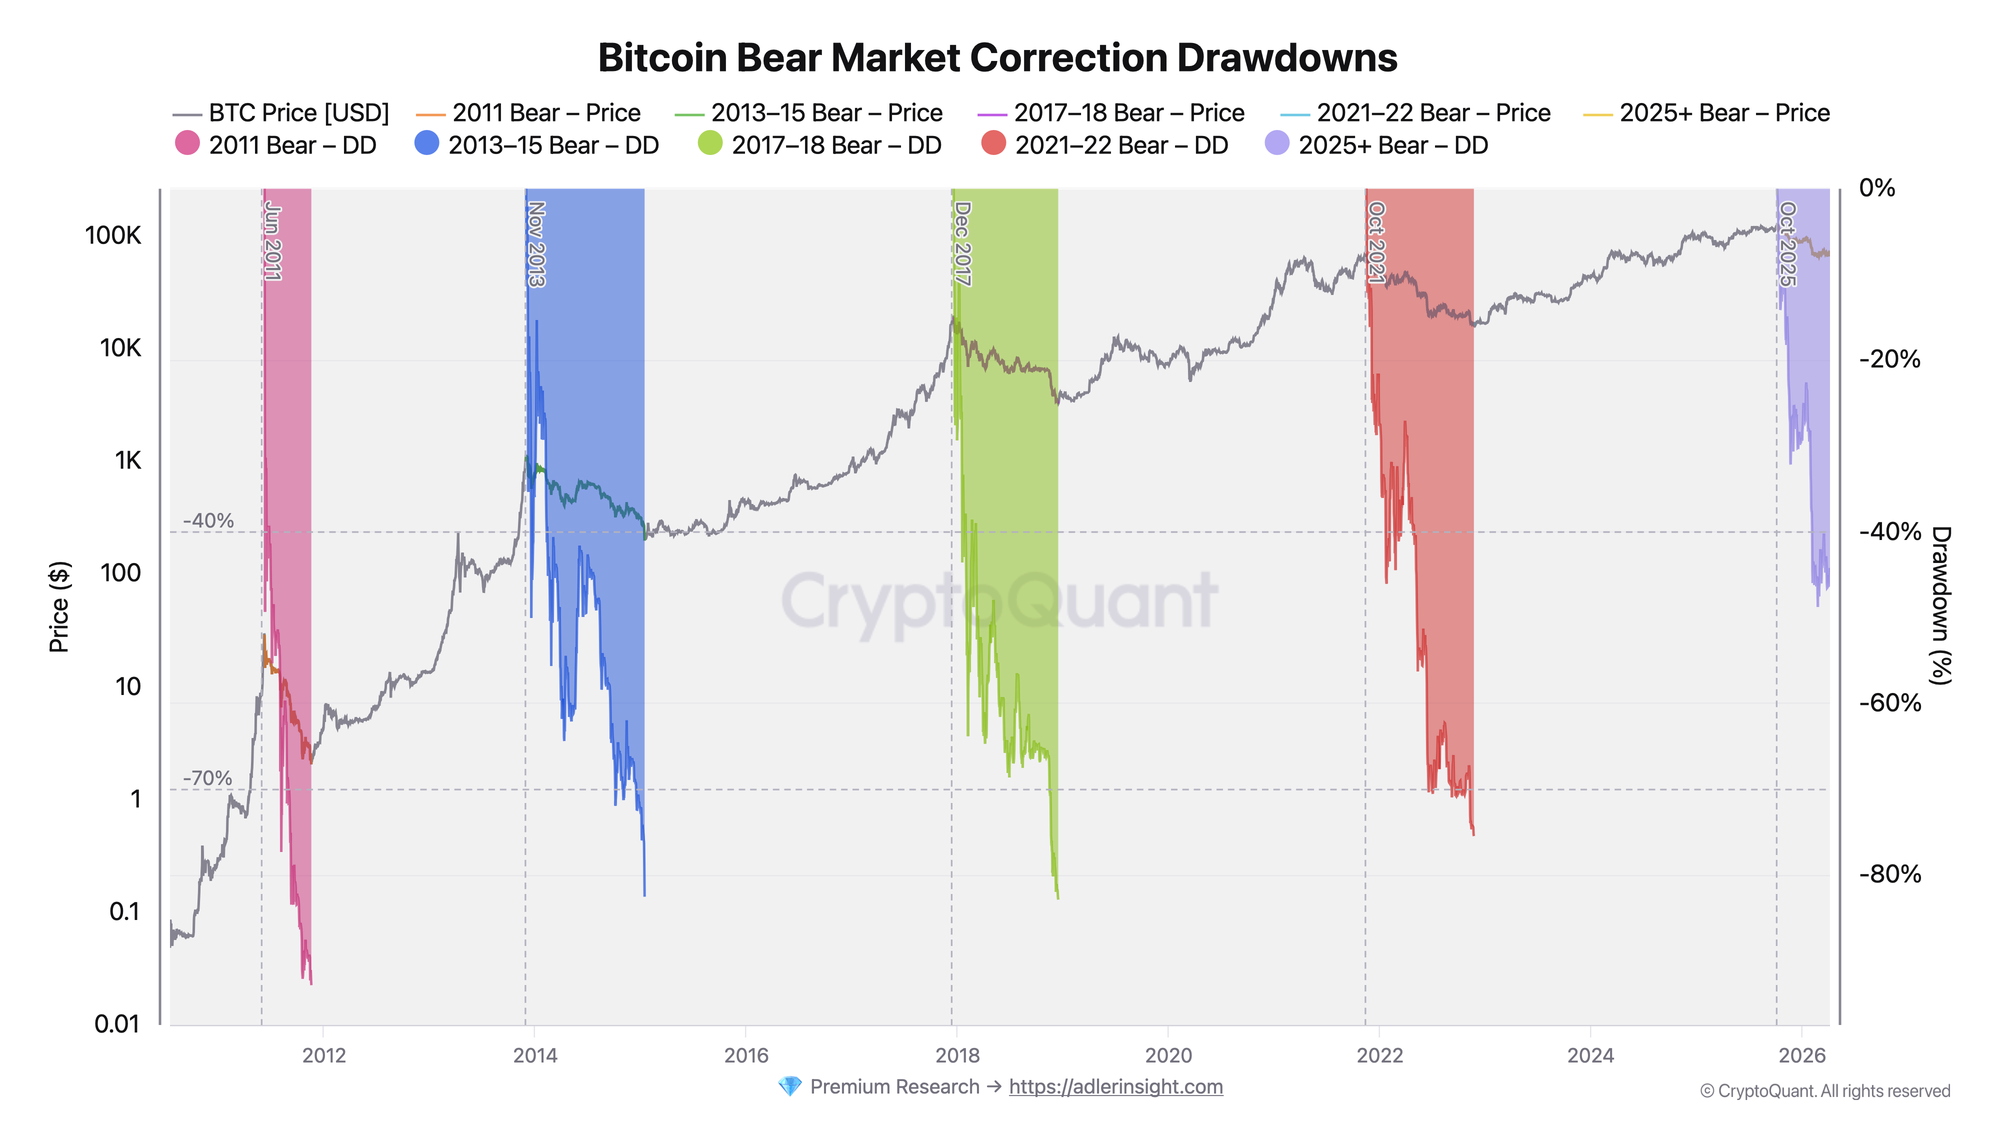
The metric tracks the depth of decline from the cycle peak. In the current cycle, the peak drawdown was recorded on February 24, 2026 at -48.8%, when price fell to $63,756. As of April 7, 2026, the drawdown has narrowed to -44.8%.
At a comparable stage following the peak, the current cycle does not resemble the most severe stretches of 2021-22 or 2017-18. Based on the data, at a similar point in time the drawdown was approximately -54.0% in the 2021-22 cycle and approximately -64.3% in the 2017-18 cycle. For the 2013-15 cycle the comparable figure was approximately -43.2%, meaning the current dynamic is closer to the more moderate scenario rather than to a deep capitulation.
This is an important distinction. It suggests that the current decline cannot honestly be described as a full replay of the severe bear phases seen in past cycles. But the inverse conclusion cannot be drawn either: history does not confirm that the low has already been definitively formed. For now, it is more accurate to speak of a stabilization phase and an attempt to build a base following the February low.
Price behavior over recent weeks does indeed look more like range construction than accelerating capitulation. After the drop to $63.8K, Bitcoin has bounced back into the $68K-$72K range several times rather than immediately continuing lower.
Both charts together read as follows: the market has already corrected enough to test the key valuation zone, but has not yet shown the depth of damage that was characteristic of more severe bear market phases. This leaves the structural picture open, but not broken.
👀 Stop holding through every crash - start your 7-day free trial. Weekly Engine tells you when to stay in, when to step aside, and when risk is rising.
FAQ
Why is the 1.25x Realized Price level so important? Because this is the zone where the price premium over the network's average cost basis compresses meaningfully. Historically, this is where the market has often transitioned from overvaluation into a fair value or stress regime. For investors, it is one of the most important points at which it becomes visible whether the cycle structure is holding or whether a deeper repricing is beginning.
What would be a stronger reversal signal in the coming quarter? Not a single daily bounce, but a sequence of signals: price returning and holding above nearby local supply zones, stabilizing above 1.25x RP, and a fading of realized-loss pressure. From a practical standpoint, a sustained close above the $78-80K zone would meaningfully strengthen the recovery scenario.
CONCLUSIONS
Bitcoin is closing this period in a structural test zone. The 44.8% drawdown from the cycle peak has brought price directly to the 1.25x Realized Price area ($67,675), which now serves as the primary dividing line between a moderate correction and a deeper repricing phase. By historical standards, the current cycle remains comparatively mild: it has already gone deeper than the moderate pullbacks seen within a bull trend, but remains noticeably less destructive than the severe stretches of 2017-18 and 2021-22 at a comparable stage. The base regime for now is neutral-to-cautious, while the market holds or quickly reclaims the 1.25x RP zone. The primary risk is a sustained close below 1.25x Realized Price. That would raise the probability of a move toward $54-58K and signal that the correction is becoming deeper.
Further Reading
Bitcoin Realized Price Bands Explained: Cycle Analysis, Signals, and Historical Examples - A deep dive into how Realized Price bands define market regimes, where the key thresholds sit, and what historical crossings have signaled at each stage of the cycle.
STH vs LTH Realized Price: Support & Resistance Guide - How the cost basis of short- and long-term holders creates dynamic support and resistance levels - directly relevant to reading the current 1.25x RP zone test.
Bitcoin Short-Term Holder Profitability: Break-Even as Bull/Bear Signal - Why the break-even level for recent buyers matters for market structure, and how to use STH profitability as a regime signal during corrections.
The 4-Year Bitcoin Cycle: Definition, Mechanics & Historical Evidence - The historical framework behind cycle drawdown comparisons - useful context for interpreting where the current -44.8% correction sits relative to past bear phases.