
🎧 Morning Brief #131 - audio debate on today’s market setup
BTC is trading near the realized price of the largest holder cohort (100-1K BTC), turning the ~$68K area into a key market decision zone. At the same time, US spot Bitcoin ETFs remain on average underwater, as their aggregate realized price holds around ~$80K. Below the market sits a deeper structural support - the realized price of the 10-100 BTC cohort near ~$47K.
TL;DR
This brief examines the map of key levels through the realized price of major cohorts and ETFs. The logic is simple: the market is testing the cost basis of the largest holders around $68K, while above hangs a potential ETF resistance zone near $80K, and notably lower lies deep structural support from the 10-100 BTC cohort.
Bitcoin US ETF Realized Price (USD)
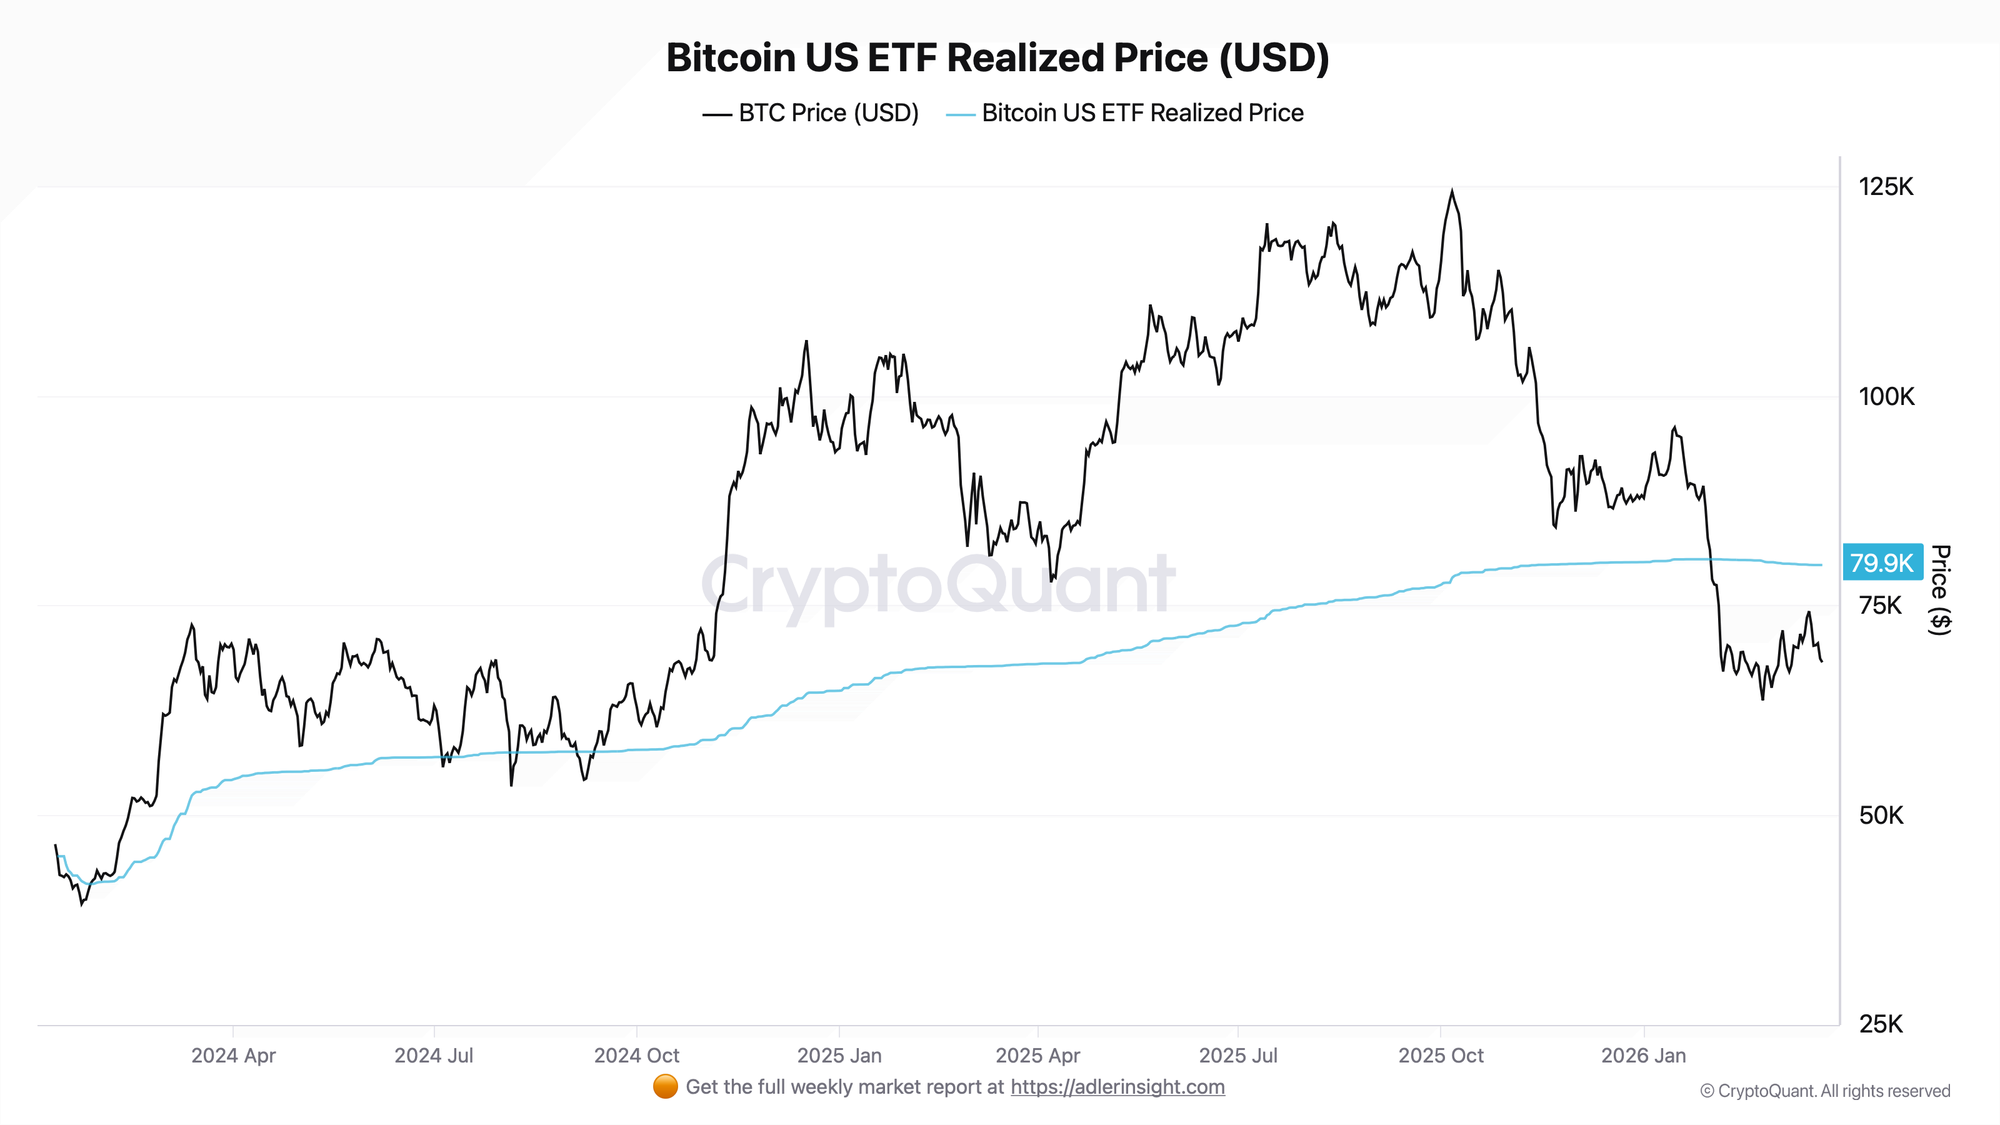
Currently, the ETF realized price stands at approximately $79.9K, while the BTC spot price is around $68.3K. This corresponds to a discount of roughly 15%. Over the past month, the ETF realized price declined only marginally - from approximately $80.5K to $79.9K. This indicates that new capital inflows have been insufficient to meaningfully shift the aggregate cost basis lower. Over the same period, BTC dropped to lows around $64K, then recovered to $68K, but remained below the average cost basis of the ETF cohort.
The level around $80K can be viewed as a potential resistance zone. As the price approaches the realized price, some ETF investors may begin reducing positions or locking in breakeven, which could increase supply. For a sustainable move above this zone, the market would likely need either new capital inflows into ETFs or sufficiently strong organic demand capable of pushing the price above the aggregate cost basis.
Bitcoin Realized Price Balance 10-100 vs 100-1K
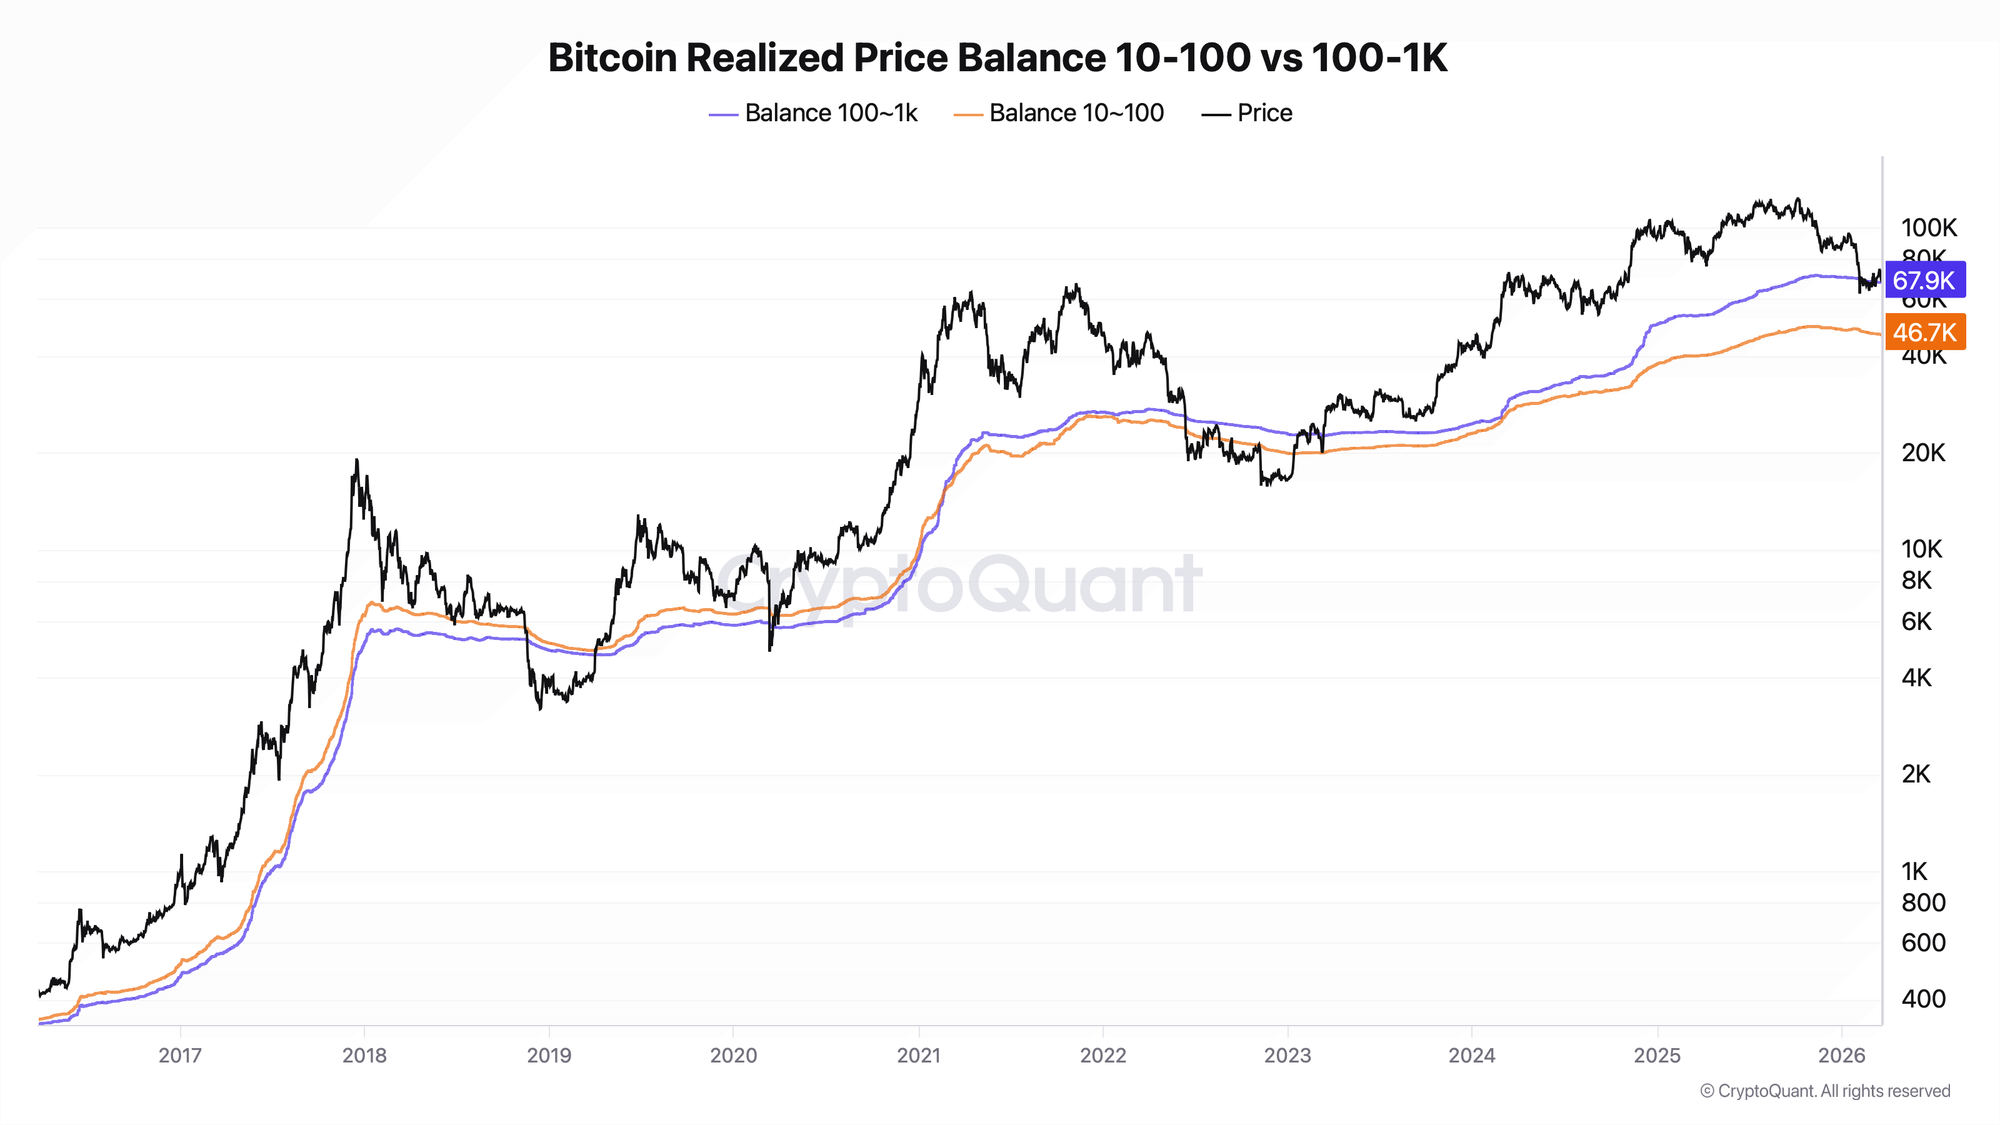
The realized price of the 100-1K BTC cohort currently stands at approximately $67.9K, virtually coinciding with the current BTC spot price. This makes the $68K area an immediate decision zone. Meanwhile, the realized price of the 10-100 BTC cohort sits notably lower - around $46.7K, forming structural support. Over the past month, the realized price of the 100-1K BTC cohort declined from $68.5K to $67.9K, pointing to gradual position averaging rather than an abrupt shift in demand regime.
As long as the price holds above $68K, the largest cohort remains near its cost basis and maintains a more resilient position. A move below this level would signal deteriorating structure and increase the likelihood of a more nervous reaction from large holders. That said, the $47K level should not be interpreted as immediate support - it is rather a deep structural threshold that would become meaningful only in the event of a full-scale deterioration in market regime.
Together, both charts form a map of levels: above sits a potential resistance zone near $80K from the ETF cohort, in the center - the current battleground at $68K based on the realized price of the largest holders, and below - a deep structural support zone around $47K. The key question now is whether BTC can hold above the realized price of the largest whale cohort.
FAQ
Why is the ETF realized price important as a resistance zone?
When the BTC spot price is below the ETF realized price, the average ETF cohort remains underwater. As the price returns toward this level, the probability of increased supply may rise, since some participants gain the opportunity to exit closer to breakeven. This is not a guaranteed "sell wall," but an important zone of potential resistance.
What does losing the $68K level mean?
If BTC sustainably breaks below the realized price of the 100-1K BTC cohort, it would mean that the largest holders are no longer holding above their cost basis. Such a shift does not guarantee capitulation in itself, but it notably worsens market structure and increases the risk of a deeper decline. In that case, attention would shift to lower structural support zones, including the area around $47K.
CONCLUSIONS
The realized price map currently forms a three-level structure: potential resistance around $80K from the ETF side, the current decision zone around $68K based on the realized price of the 100-1K BTC cohort, and a deep structural support zone around $47K based on the realized price of the 10-100 BTC cohort. The current market positioning remains neutral with a bias toward overhead pressure: the price is balancing at the cost basis of the largest holders, while the ETF cohort still sits notably above the market. Over the past month, the structure looks like sideways movement in the $64K-$75K range with a slow decline in the realized prices of major cohorts, which points more toward gradual averaging than the arrival of strong new demand. The key triggers remain the same: a return and hold above $75K would strengthen the probability of testing the ETF zone near $80K, while losing $68K would worsen the structure and increase the risk of a move toward deeper support levels.
Read More
Bitcoin Realized Price Bands Explained: Cycle Analysis, Signals, and Historical Examples - How realized price bands define support and resistance across Bitcoin cycles.
STH vs LTH Realized Price: Support & Resistance Guide - A framework for reading cost basis levels as key market boundaries.
Spot ETFs and Global M2: Thresholds for Overriding the Bitcoin Halving Cycle - How ETF flows and macro liquidity interact with traditional cycle mechanics.
Realized Price UTXO Age Bands: Definition & HODLer Signals - Reading holder behavior through realized price segmented by coin age.