
🎧 Morning Brief #204 - audio debate
Over the past two days, aggressive buyers tried to push the price higher, but the bounce did not get support from leverage. The two charts show a rare divergence: a spike in net taker volume alongside a simultaneous contraction in open interest.
TL;DR
A brief on why the current bounce looks fragile. The logic is simple: buyers are pressing the market aggressively, but without growth in open interest the move has no fuel for a sustainable breakout.
Bitcoin Net Taker Volume
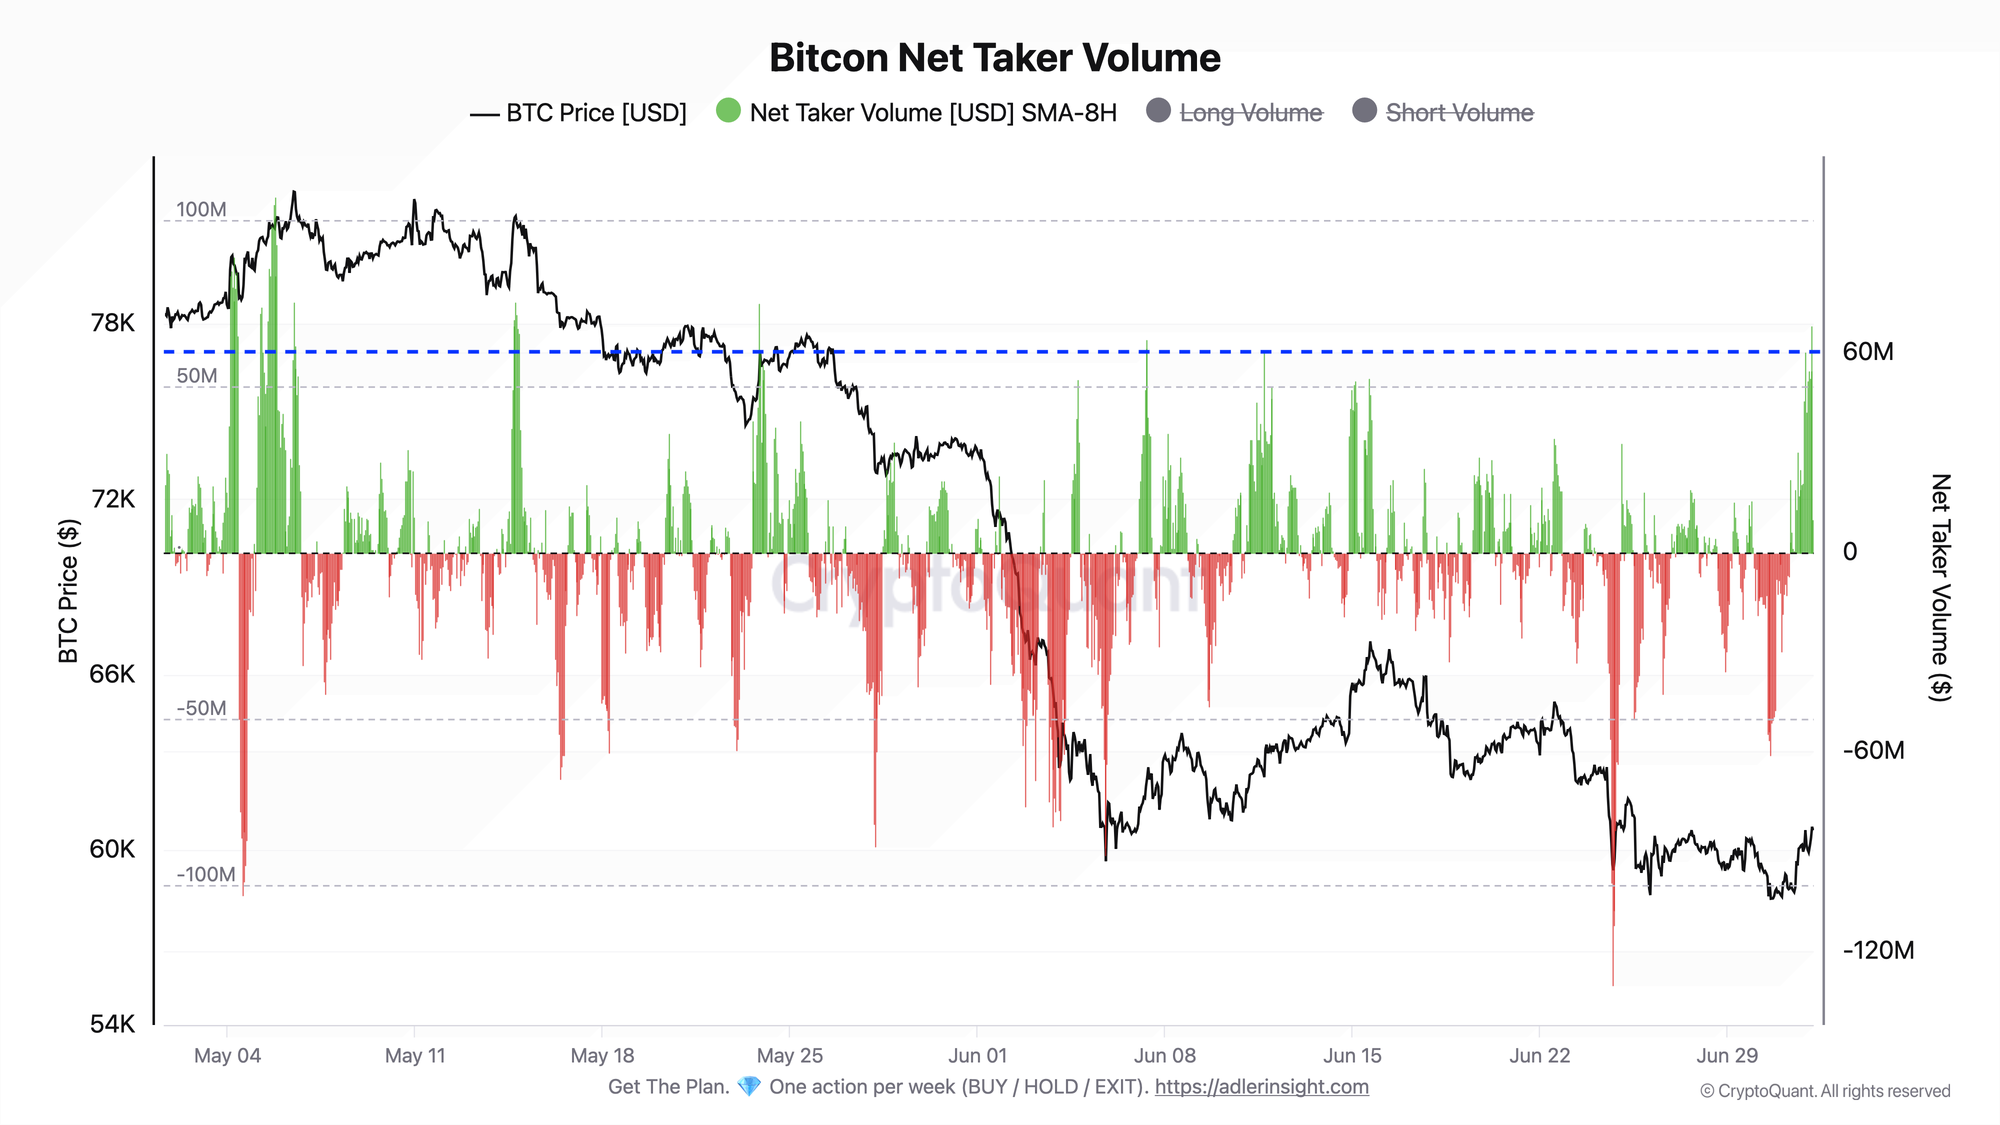
The metric reflects the balance of aggressive market orders - buys minus sells - smoothed with an 8-hour moving average.
On June 30, aggressive selling dominated: net taker volume dropped to around -61M, while the price slid toward the 58.3K area. Then, on the morning of July 1, the picture reversed - green bars clearly outweighed red ones, net volume held in the +45M...+60M range, and by the peak on July 2 it reached +68M. On that impulse, the price rose from around 58K to a local high near 64K.
This was real demand, not a cosmetic move: market buyers were genuinely stepping in. The question now is follow-through - will green volume hold above zero, or will it slip back below, as it did two days earlier.
Bitcoin Open Interest Change
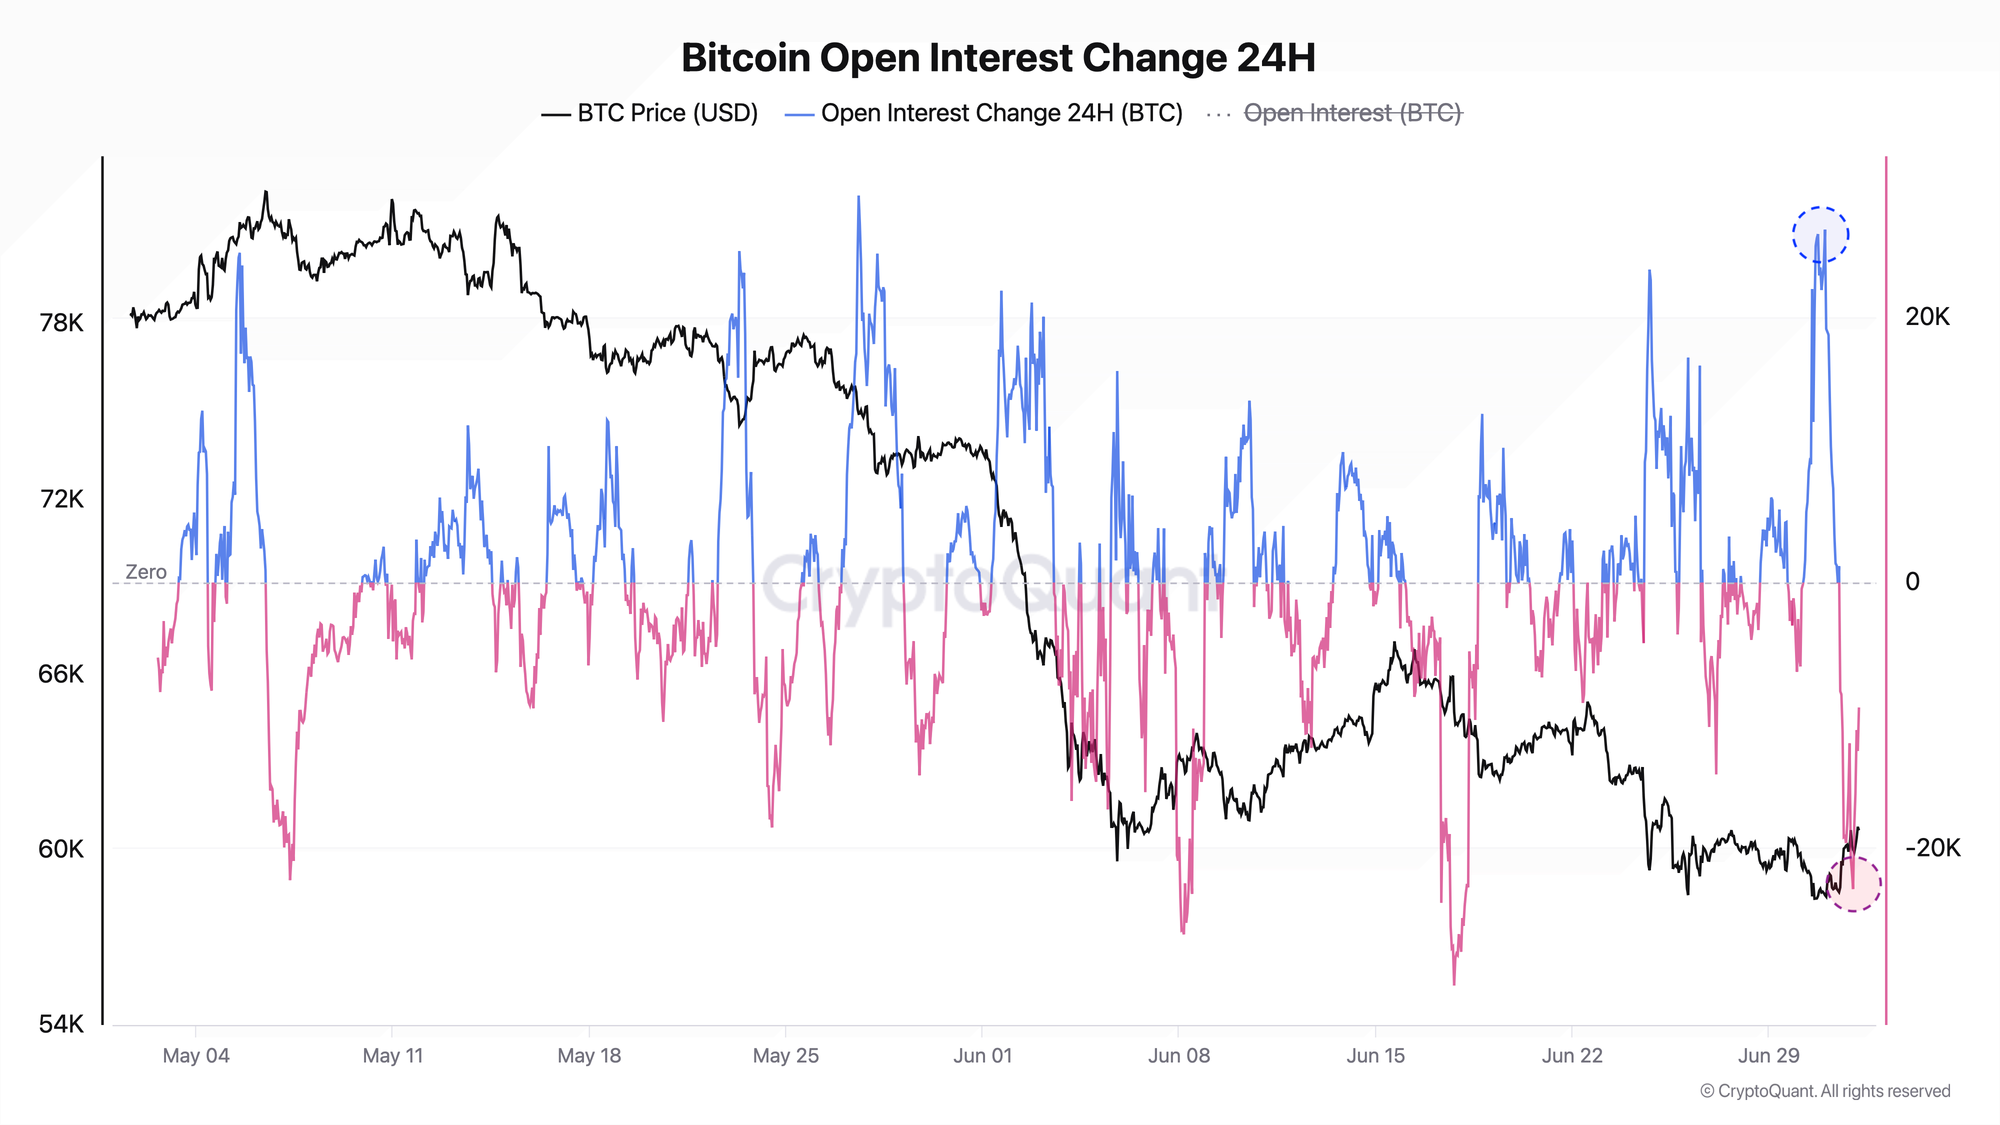
The metric shows the 24-hour change in open interest in BTC relative to price.
This is where the weakness of the bounce becomes clear. While takers were buying, the 24-hour change in open interest reversed from +26K BTC at the start of July 1 to -23K BTC by the morning of July 2, while absolute OI contracted from about 368K to 342-346K BTC. In other words, the market lost roughly 22K BTC of open interest in a single day, or about 6%. The price increase was driven not by fresh leverage coming in, but by mass position closures.
A price rise with falling OI is a classic deleveraging move and short squeeze, not fresh trend positioning. Buyers do not have leverage behind them, so there is simply no way to turn demand into a sustained move.
The link is simple: the second chart directly weakens the signal from the first. Taker aggression at +68M without growth in open interest means the buying was largely accompanied by the closing of other positions, not the building of new longs. That is exactly why the price stalled and slipped back. The key point today: demand appeared in futures, but without OI expansion it is not turning into a trend.
Bitcoin does not reward noise. DECISION TERMINAL gives you AI-powered market context, cycle phase, and execution quality in one place - so you can judge conditions before you act. Enter Terminal.
FAQ
Why did the rise in taker volume fail to hold the price higher? Because the buying happened against a backdrop of falling open interest: buyer aggression was absorbed by position closures rather than a fresh inflow of leverage. That is why the move had no fuel and stalled below 62K.
What would change the regime? A sustainable move back above 62K together with rising, not falling, open interest would confirm that buyers have started building positions. The opposite scenario - another drop in OI and net taker volume falling back below zero - would hand control back to sellers.
CONCLUSIONS
The regime is neutral: the bounce was built on real demand, but the futures structure does not confirm it. The trigger for a shift into risk-on is a move back above 64K together with expanding open interest, which would signal fresh leverage entering behind the move. The main risk is the mirror image: open interest has already been meaningfully flushed out, and if taker volume turns negative again, price will quickly retest the recent lows because there is now very little left to support it.
Live Charts
Explore the metrics behind this brief with live, auto-updating charts:
Open Interest (BTC) - Total futures positioning and 7-day BTC-denominated change.
Funding Rates - Perpetual futures funding to track long-side or short-side leverage pressure.
Coinbase Premium Index - Coinbase vs global market premium as a proxy for US spot demand pressure.
Exchange Netflow - Net BTC moving to and from exchanges across positive and negative flow regimes.
Derivatives - All funding, open-interest, and leverage charts in one view.