
🎧 Morning Brief #205 - audio debate
Net UTXO Supply Ratio has entered the buy zone for the first time in more than three years, but the second metric shows that the share of supply in loss has not yet reached the extremes seen at past reversals. We break down whether these two indicators confirm the start of a full capitulation phase, or whether the market is only approaching it.
TL;DR
This brief covers the first BUY signal in a long time from Net UTXO Supply Ratio and whether the Supply in Loss metric confirms the start of the final phase of capitulation. The logic is simple: the fast indicator has already moved into the reversal zone, while the slower one still needs more time to reach the threshold.
Bitcoin Advanced Net UTXO Supply Ratio
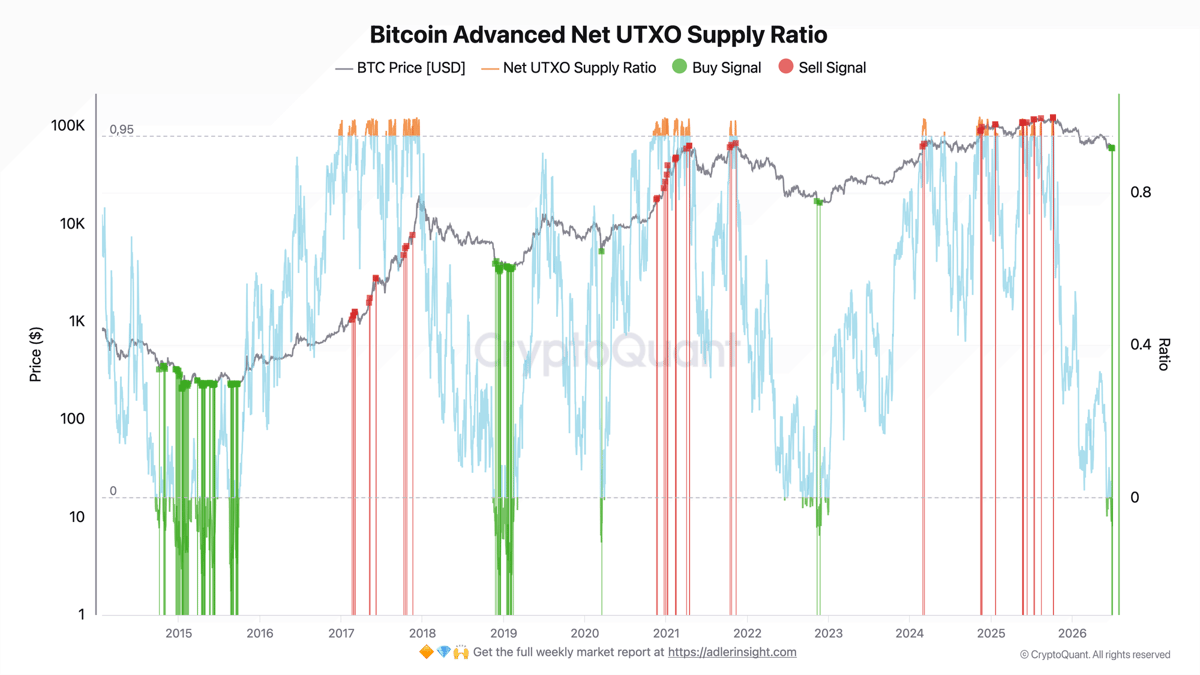
The metric measures the net balance of supply in profit and in loss. Green marks on the price show buy points, red marks show sell points.
The ratio dropped into deeply negative territory and then crossed back above the signal threshold on the rebound, which caused the model to print BUY on several sessions in late June and early July. This is the first buy trigger since November 2022, which was the bottom of the previous bear cycle. The indicator has now already returned to the zero line, while price has pulled back from the area of local highs to the 61 thousand dollar range.
Historically, these triggers have appeared near cyclical lows, so the signal itself matters. Confirmation would be the ratio holding above zero together with rising price. The negative scenario is a move back into negative territory without price support.
Bitcoin Supply in Loss (%)
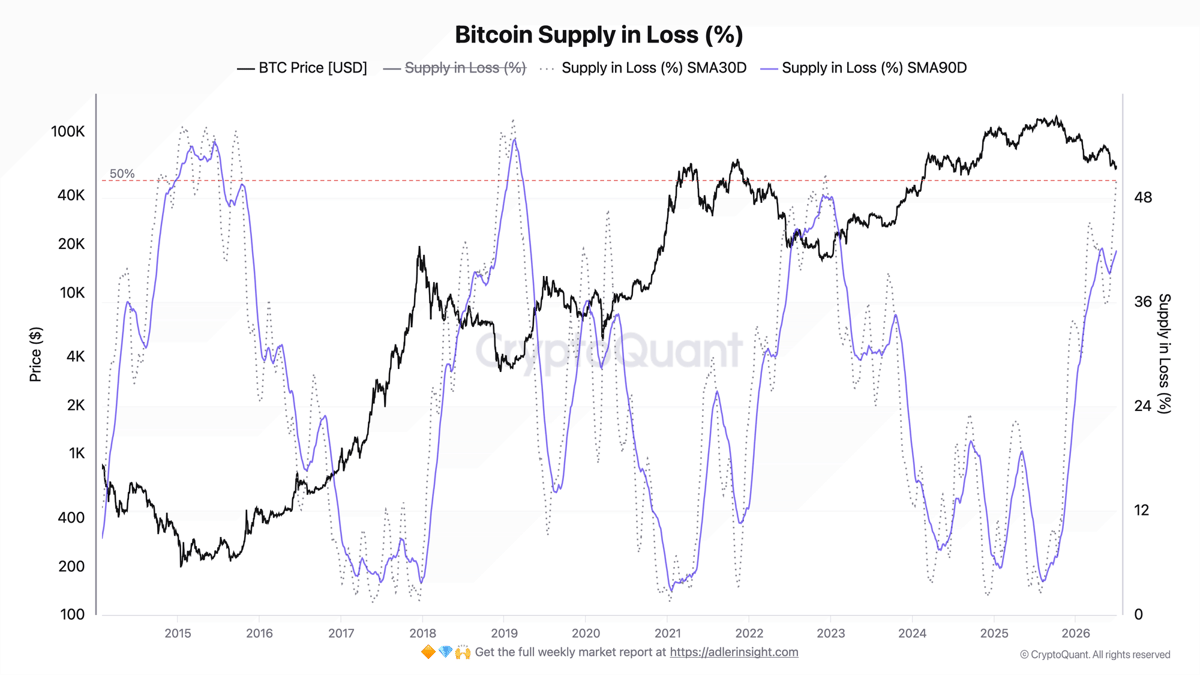
The metric reflects the share of BTC supply sitting in loss, where SMA30 is the fast response and SMA90 is the smoothed slower contour.
The fast SMA30 moved above the 50% level around the turn of June into July, meaning that more than half of all coins are currently sitting below their purchase price. The slow SMA90 is rising steadily, but still remains clearly below the threshold, in the 40% range. The gap between the fast and slow averages reflects how fresh the stress is: the market moved into loss sharply, and the smoothed contour needs time to catch up.
On the current trajectory, if the share of supply in loss stays near today's levels, SMA90 should reach the 50% threshold in roughly 7-8 weeks. Until then, it is more accurate to treat capitulation as a process rather than a completed fact.
The link is straightforward: the BUY signal from the first metric and the rise in the loss share in the second both point to the same phase, but with different degrees of maturity. The first indicator has already given a reversal point, while the second confirms stress, yet the slow average has still not reached the zone that in the past accompanied the final cycle bottom.
Invest in Bitcoin without emotional decisions - Start free. Deterministic signals built to remove fear, FOMO, and panic selling.
FAQ
How reliable is the BUY signal itself if it has not appeared since 2022? The rarity of the signal is both its strength and its weakness. These triggers really are tied to extremes, but the small number of cases means the signal should be confirmed with the second metric rather than acted on in isolation.
What exactly needs to happen to say that capitulation is complete? The key reference point is the slow SMA90 on Supply in Loss reaching the 50% threshold while the ratio stays positive and price stabilizes. As long as SMA90 remains below that threshold, it is more accurate to describe this as a developing phase rather than a completed one.
CONCLUSIONS
The two metrics describe the same reversal story at different speeds: Net UTXO Supply Ratio has printed its first BUY signal since November 2022, while Supply in Loss confirms the stress through a rising share of unprofitable supply, with the fast average already above 50% and the slow average only now approaching that level. Taken together, the regime remains cautiously constructive: the window for accumulation is opening, but confirmation of a final bottom is still not in place. The main trigger for strengthening the signal is SMA90 reaching 50% while the ratio stays above zero and price stabilizes. The main risk is another drop in the ratio back into negative territory without price support, which would turn the current trigger into a false one and extend the loss phase.
Live Charts
Explore the metrics behind this brief with live, auto-updating charts:
Supply in Loss - Share of supply held at a loss to flag stress and capitulation zones.
Supply in Profit - Share of circulating supply in profit as a cycle-phase and euphoria gauge.
NUPL - Net unrealized profit/loss across holders, mapped into cycle sentiment phases.
SOPR - Spent Output Profit Ratio shows whether moved coins realize profit or loss.
Holder Behavior - All holder profitability and supply-cohort charts in one view.