
🎧 Morning Brief #127 - audio debate on today’s market setup
Over the past month, ETF flows completed a full cycle - from capitulation to recovery. Yet despite the return of institutional demand, the ETF cohort as a whole remains in loss: the Realized Price ($79,962) defines a likely resistance zone that will determine the character of the next move.
TL;DR
ETF flows recovered after February's outflow, liquidity returned to positive territory - demand is back. But until spot closes above the Realized Price (~$80K), the ETF cohort remains underwater, and this level will likely slow any rally.
Bitcoin + US Spot ETF Flows & Liquidity Impulse
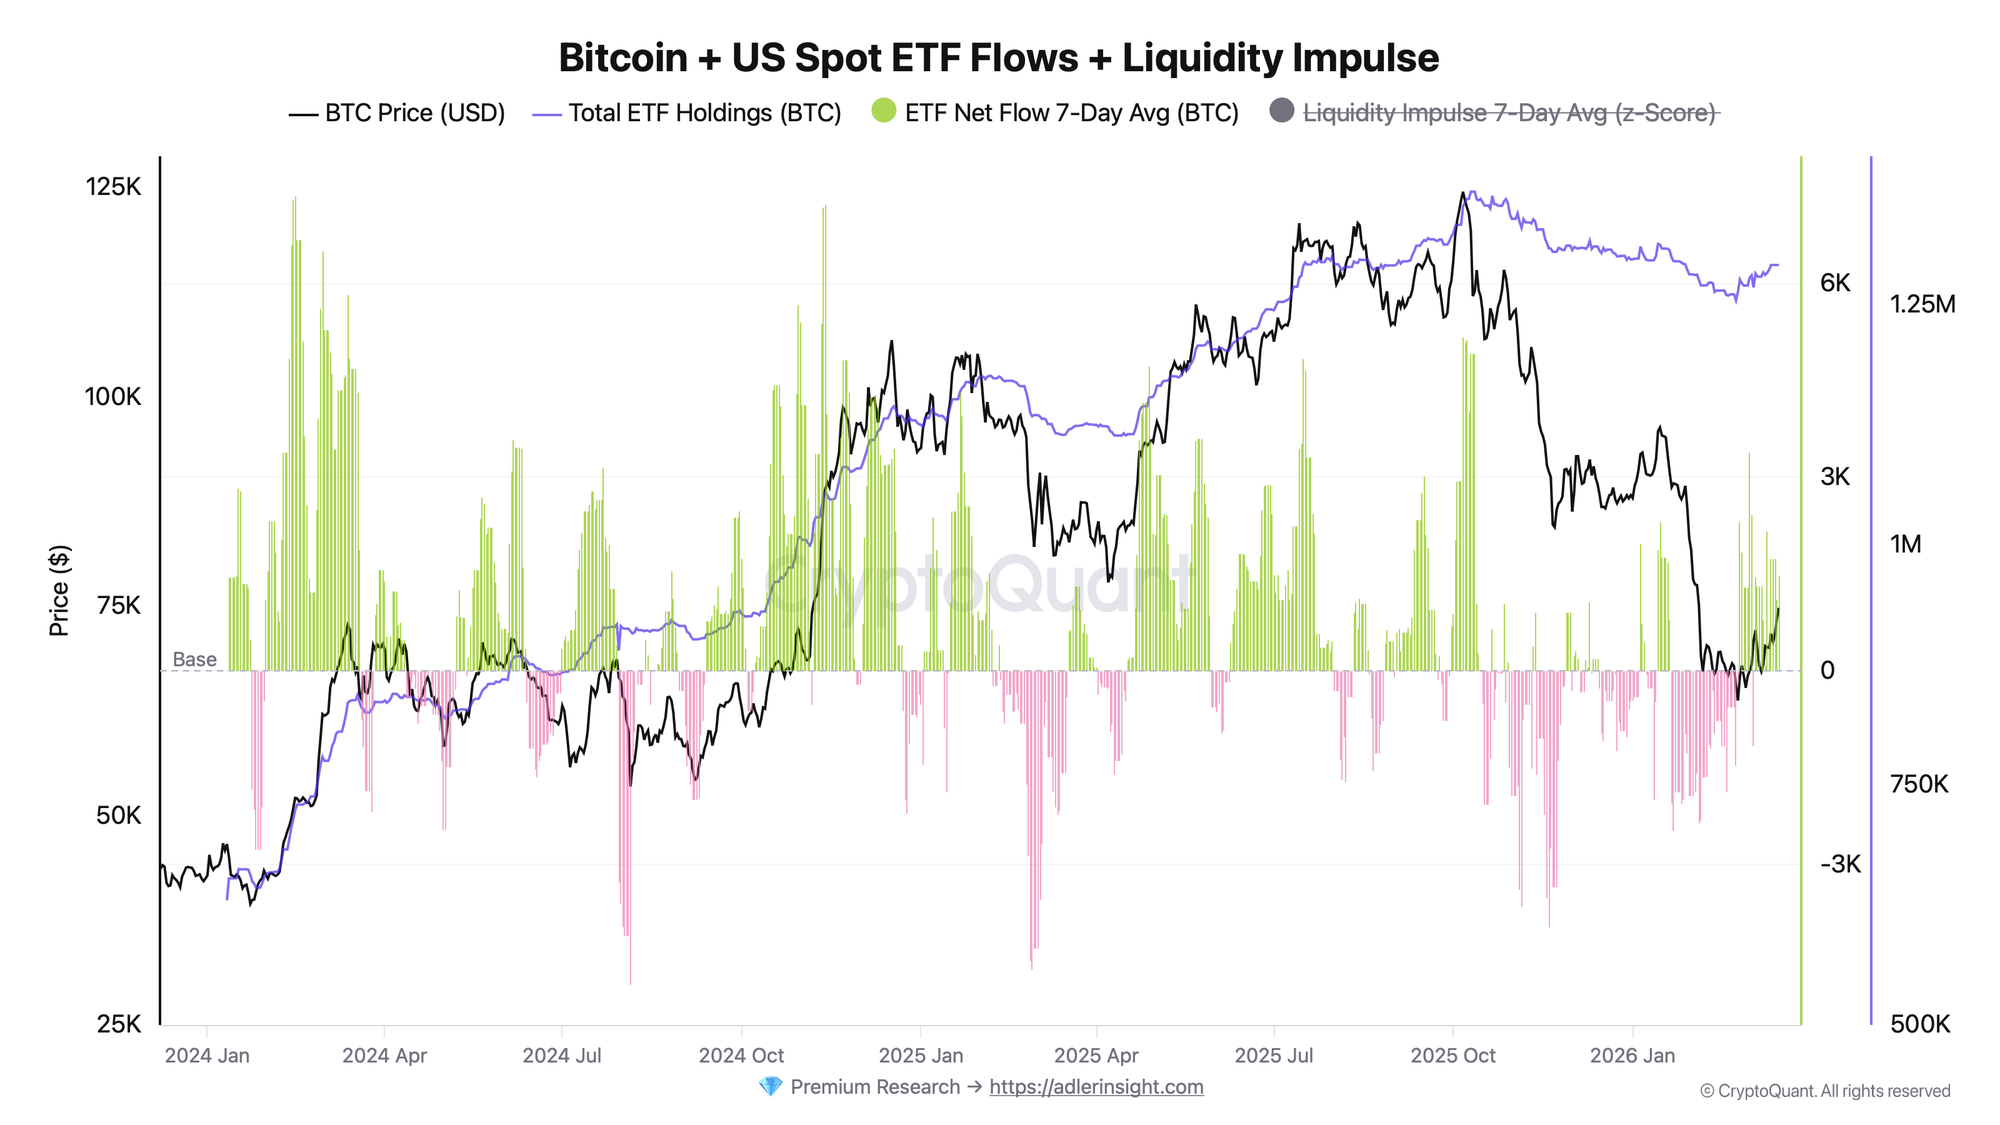
Metric: ETF Net Flow 7-Day Avg (BTC) - dynamics of institutional flows.
From February 15 to 24, ETF flows remained consistently negative: the 7-day average net outflow hit a low of -1,883 BTC/day on February 18. The reversal came on February 25 - net inflow recovered to +2,305 BTC/day, reaching a peak of +3,387 BTC/day on March 2. Today the reading has stabilized at +1,472 BTC/day with Liquidity Impulse at +0.39. Over the month, total ETF holdings grew from 1,264,982 to 1,291,618 BTC (+26,636 BTC, +2.1%).
The recovery in flows points to a return of institutional demand following February's capitulation. Signal confirmation trigger: sustained net inflow above +2,000 BTC/day.
Bitcoin US ETF Realized Price (USD)
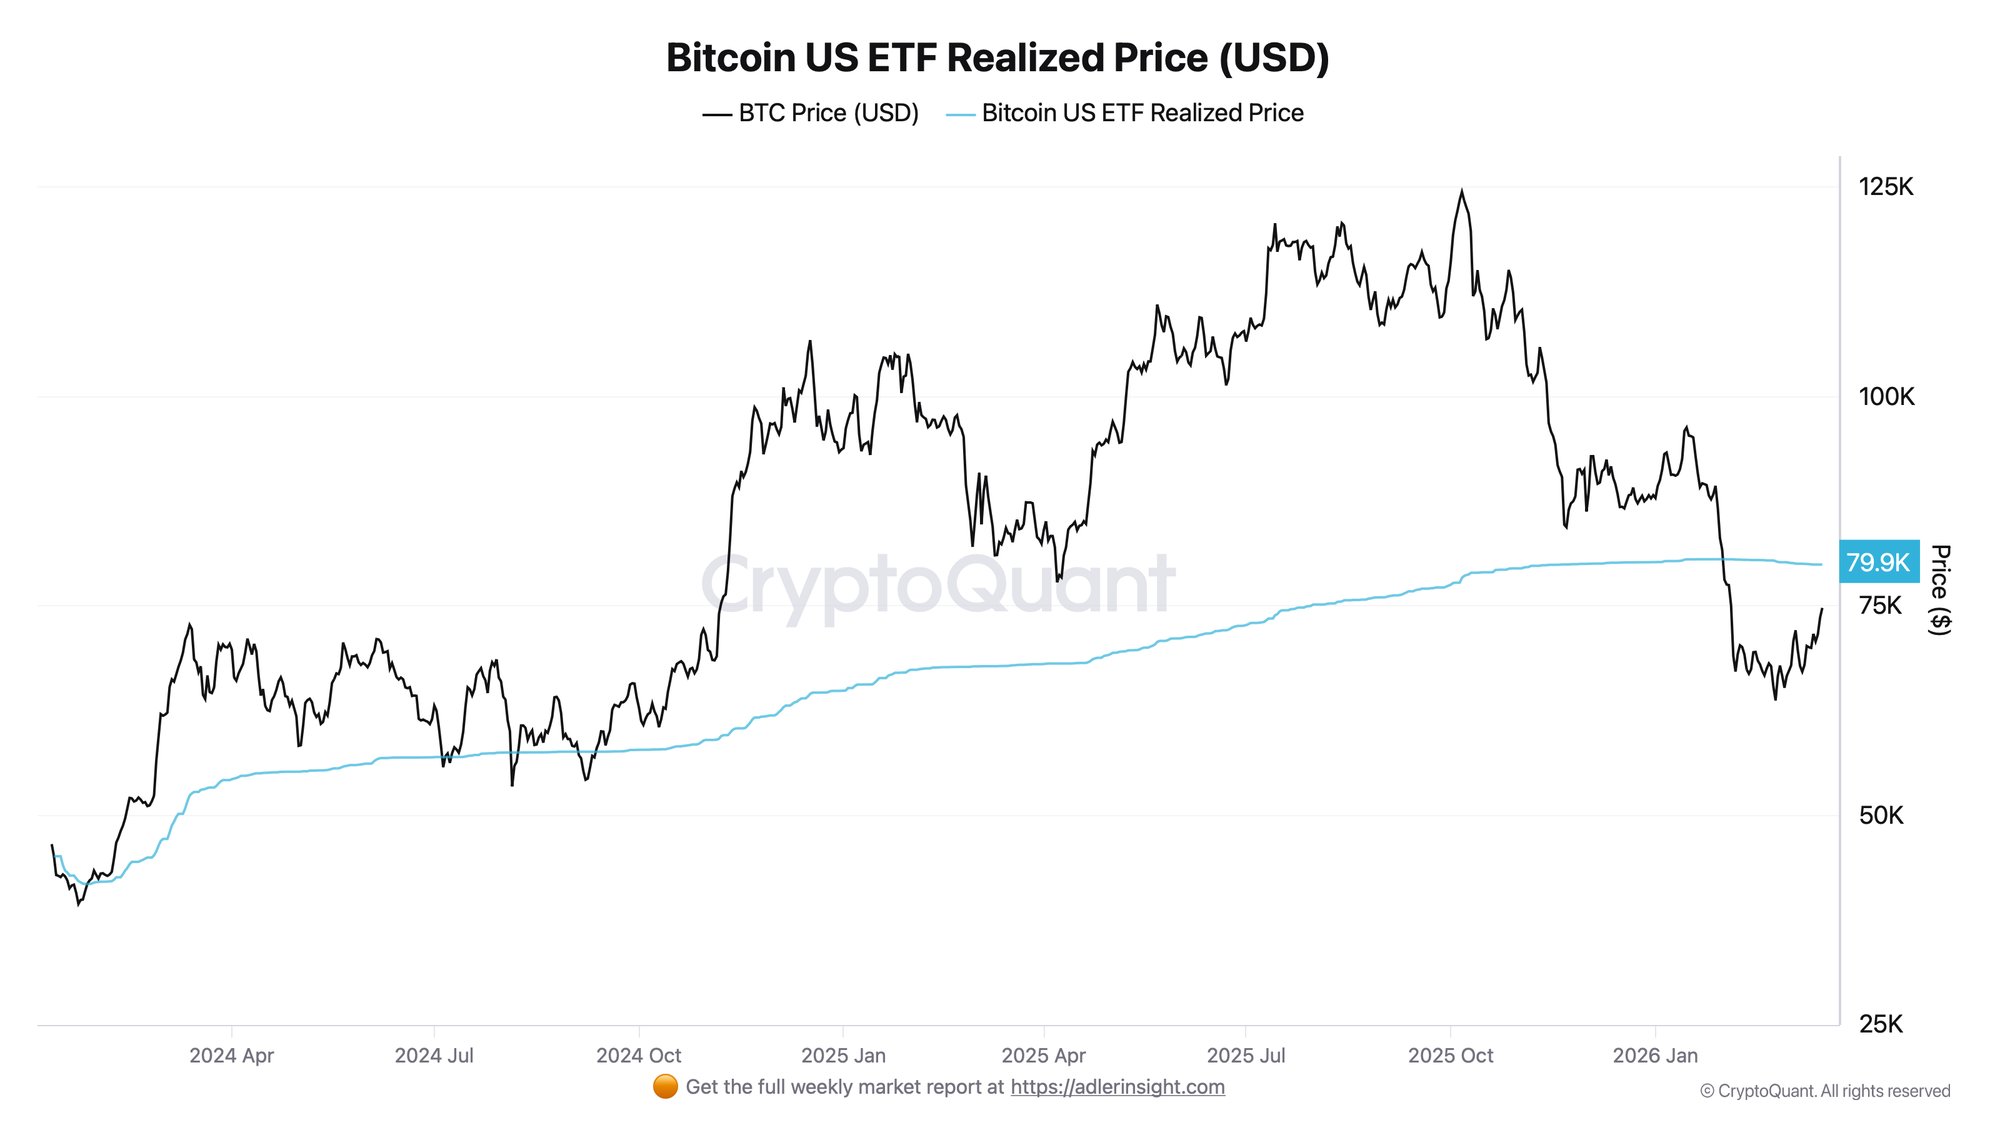
Metric: the ETF cohort's volume-weighted average cost basis (Realized Price) as a cohort health indicator and potential resistance zone.
The ETF cohort's Realized Price declined from a peak of $80,501 (February 15) to $79,962 today (-$539, -0.7%). Despite spot rallying from its low of $63,756 (February 24) to $74,788 (+17.3% over three weeks), the gap persists: spot trades $5,174 (-6.5%) below the Realized Price. The aggregate ETF cohort continues to hold positions at a paper loss.
The $79,962 level defines a likely zone of dense resistance. As price approaches the Realized Price, a portion of holders may exit at breakeven, creating additional supply pressure. The bullish scenario requires a confident break and close above $80K - until then, any rally may stall on approach to this level.
The recovery in ETF flows confirms demand from below, but the Realized Price continues to define the upper boundary. Together, both signals describe the same picture: recovery is underway, but the resistance ceiling is close.
👀 Outperform Buy & Hold with a rules-based strategy - Start free. One weekly action, clear triggers, and invalidation levels. No guessing.
FAQ
Why is the ETF cohort's Realized Price important as a resistance level? The Realized Price is the volume-weighted average purchase price of bitcoin across all ETF holders. While spot remains below this level, the cohort is in aggregate loss. As price approaches $79,962, an increasing number of participants reach breakeven and gain an incentive to take profit - this raises the risk of additional supply that the market will need to absorb.
What would signal a regime change? A spot close above $79,962 combined with sustained ETF net inflow above +2,000 BTC/day. The adverse signal is a return of net outflows before the level is broken: this creates double overhead pressure and erases the recovery momentum built over the past weeks.
CONCLUSIONS
February's ETF flow capitulation is behind us: since February 25, net inflow has been consistently positive (+1,472 BTC/day on a 7d avg), total holdings have grown to 1,291,618 BTC, and Liquidity Impulse has returned to +0.39. Stance - neutrally positive: demand is restored, but structural resistance remains intact. The ETF cohort's Realized Price ($79,962) is the key level for the weeks ahead - while spot trades $5,174 below it, the aggregate cohort is underwater, and this overhang will likely slow any rally. The main trigger is a close above $80K with inflows holding. The main risk is a return of outflows, which at the current gap would create double overhead pressure and potentially reopen a retest of the February lows.
Further Reading