
🎧 Morning Brief #145 - audio debate on today’s market setup
The end of March was marked by a strong BTC outflow from exchanges, and in early April both key flows shifted noticeably. Exchange Flow SMA-7D exited the extremely negative zone and is now near zero, while ETF flows - after a sharp drop on April 7 - returned to positive territory. This points to a weakening of the March imbalance in exchange flows and a partial normalization of ETF structure, but does not yet confirm a sustained bullish impulse.
TL;DR
Exchange Flow SMA-7D reached -15,216 BTC at the end of March, then rose to the neutral zone near zero. This means the extreme pace of net outflow from exchanges has eased noticeably. ETF flows also recovered after a sharp negative day on April 7: SMA-7D turned positive again at +1,835 BTC. For now, both signals point more to stabilization after strong flow volatility than to a confirmed resumption of demand.
Bitcoin Exchange Flow SMA-7D
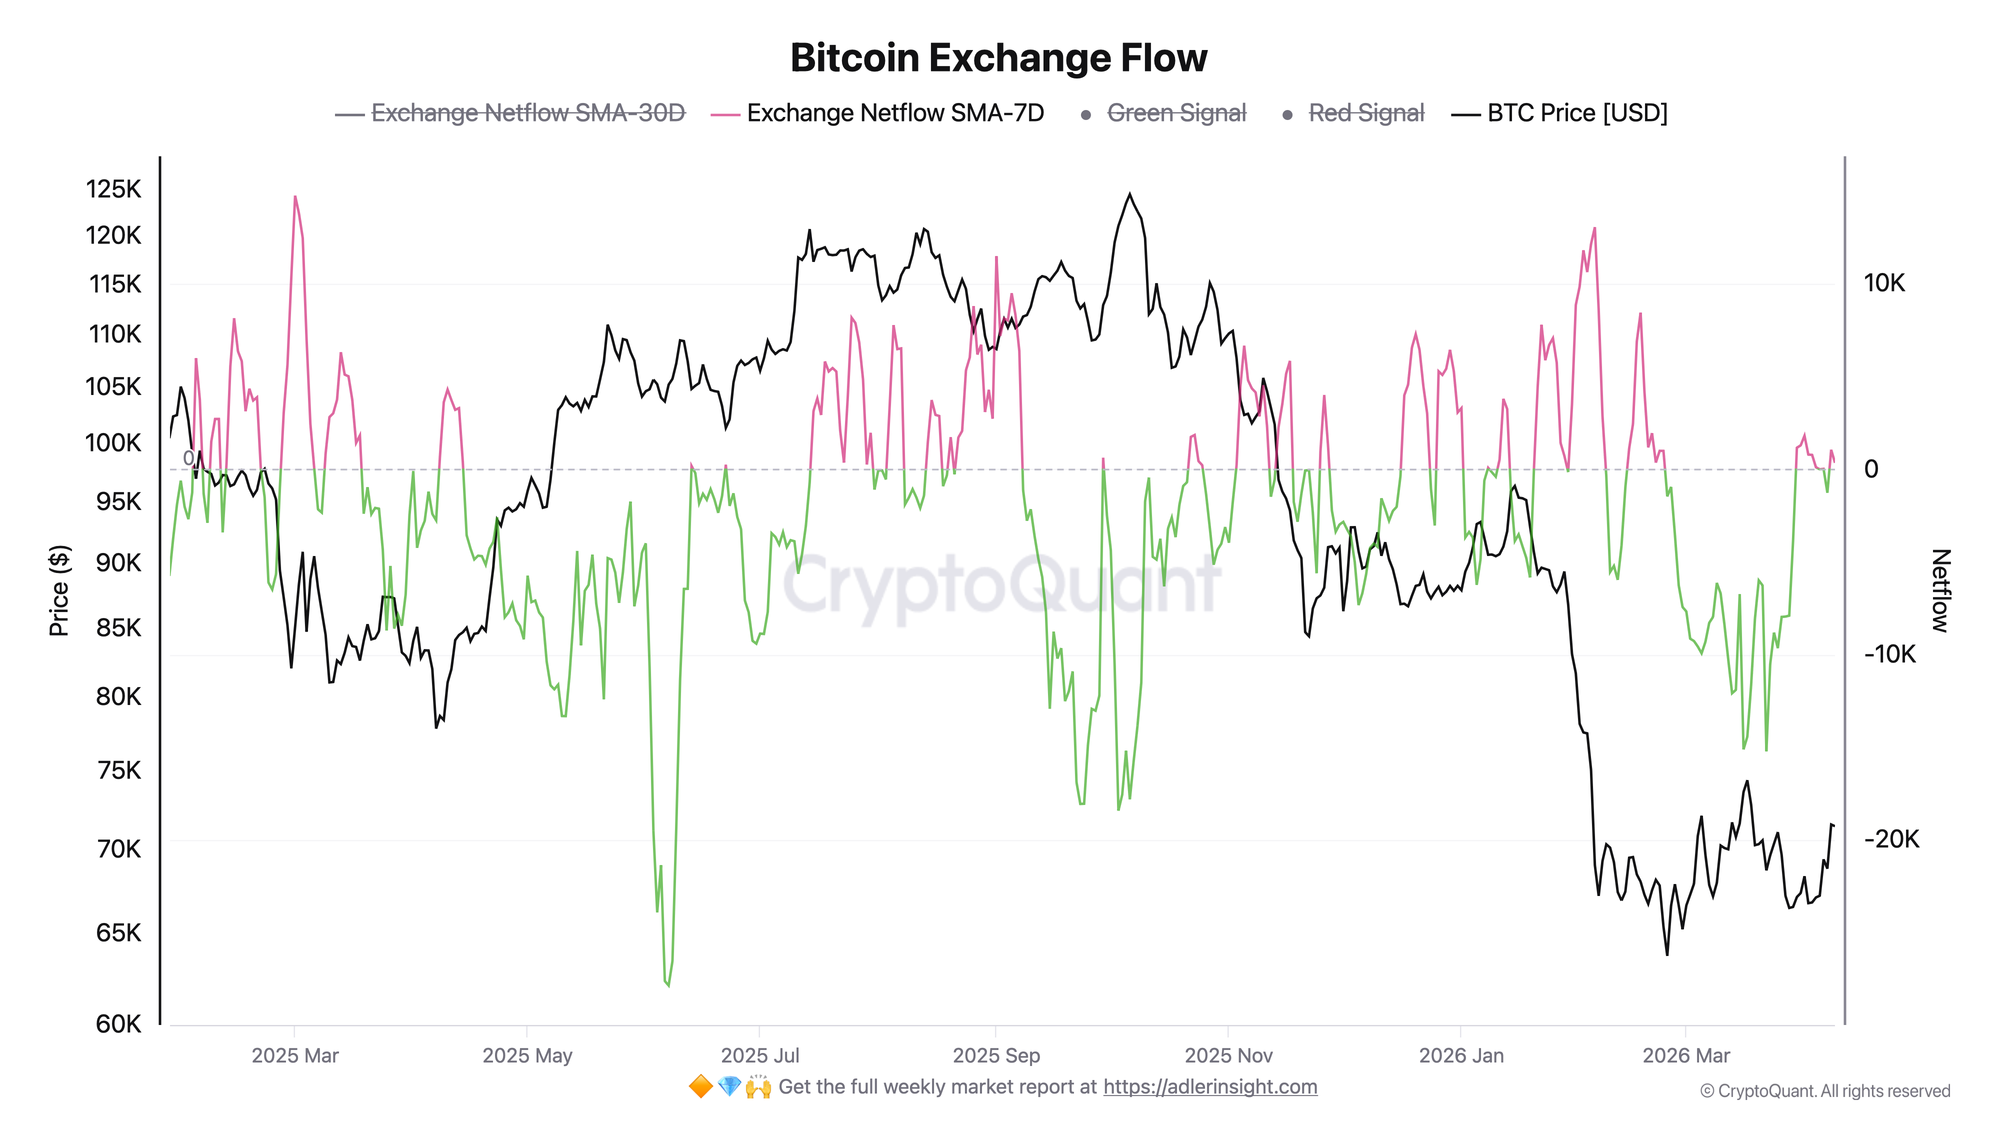
In the second half of March, Exchange Netflow SMA-7D showed persistently deep negative values (a bullish signal). The peak was recorded on March 22 at -15,216 BTC, reflecting a strong net outflow of coins from exchanges. Such dynamics typically correspond to an active phase of supply removal from trading venues, but does not in itself prove accumulation or an inevitable continuation of the uptrend.
From March 30, the metric began recovering quickly and during the first week of April moved into the range of -1,261 to +1,810 BTC. As of April 9, the value stands at +348 BTC. This means the market has exited the extreme outflow regime and moved closer to a neutral balance between inflow and outflow on exchanges.
The key takeaway here is not that the market has turned bullish, but that the previous imbalance has eased. If SMA-7D moves back into a sustained deep negative, it will signal a return of strong net outflow. If the metric holds near zero or moves into positive territory, it will indicate a more neutral or mildly structured supply picture on exchanges.
Bitcoin ETF Tracker SMA-7D Daily Flows BTC
In March, ETF flows looked relatively stable: SMA-7D held in the range of +422 to +3,323 BTC, with a local peak on March 13. In early April the structure deteriorated. On April 7, the daily flow came in at -29,539 BTC - a large single-day negative event that pulled SMA-7D into negative territory at -2,750 BTC.
By April 8, the daily flow recovered to +20,756 BTC, and April 9 added another +6,291 BTC. As a result, SMA-7D on April 9 rose to +1,835 BTC and returned to positive territory. This removes some of the short-term pressure, but does not automatically make the move a full recovery of sustained institutional demand.
The key question now is whether the April 7 drop was a one-off anomaly or the beginning of a more unstable phase in ETF flows. If the negative episode turns out to be isolated, SMA-7D will continue to stabilize. If negative days start repeating, the structure will deteriorate again.
Taken together, these two charts do not signal a "return of the bullish regime" - rather a reduction of the March skew in exchange flows and a partial normalization of ETF flows after the sharp disruption in early April. This is stabilization, not a confirmed impulse.
DECISION TERMINAL: AI-Powered Bitcoin Analysis. One Clear Market Verdict. Start.
FAQ
What does the neutralization of Exchange Netflow SMA-7D near zero mean? The metric reflects the 7-day average balance between BTC inflows and outflows on exchanges. A value near zero means neither side is currently dominant: the market has exited the extreme net outflow phase and moved into a more neutral state.
How should the return of ETF SMA-7D to positive territory be interpreted? It means that after a strong negative episode, the ETF flow average has turned positive again. But this alone is not enough to consider the structure fully recovered - what matters is whether the positive dynamic holds over the coming sessions.
CONCLUSIONS
Exchange Flow passed through an extremely negative phase in late March and by April 9 returned to near neutral values. This reflects a notable easing of the previous net BTC outflow from exchanges. At the same time, ETF flows recovered after the sharp negative day on April 7, with SMA-7D moving back into positive territory. This reduces the level of short-term concern, but does not yet provide sufficient grounds to speak of a full return of sustained demand.
The correct reading here is not "bullish regime is back" but "both metrics have partially stabilized." A stronger interpretation would require seeing continued positive dynamics in ETF flows and more sustained directionality in Exchange Netflow - not just a one-off bounce from extremes.