
🎧 Morning Brief #165 - audio debate on today’s market setup
After a six-day rally with the futures microstructure index peaking above 78, Bitcoin pulled back to ~$79K, and BFMI crashed to the 26-34 range within 48 hours. At the same time, the liquidations dominance oscillator remains deep in negative territory at -11 to -13, indicating persistent dominance of short liquidations even as the market structure compresses.
TL;DR
Futures microstructure deteriorated sharply: BFMI dropped from its peak of 78 to 30 within 48 hours, breaking below SMA-7. The liquidations oscillator remains negative - meaning the market still sees short liquidations dominating - but this is no longer sufficient to offset the deterioration in the futures market structure itself.
Bitcoin Futures Microstructure Index (BFMI)
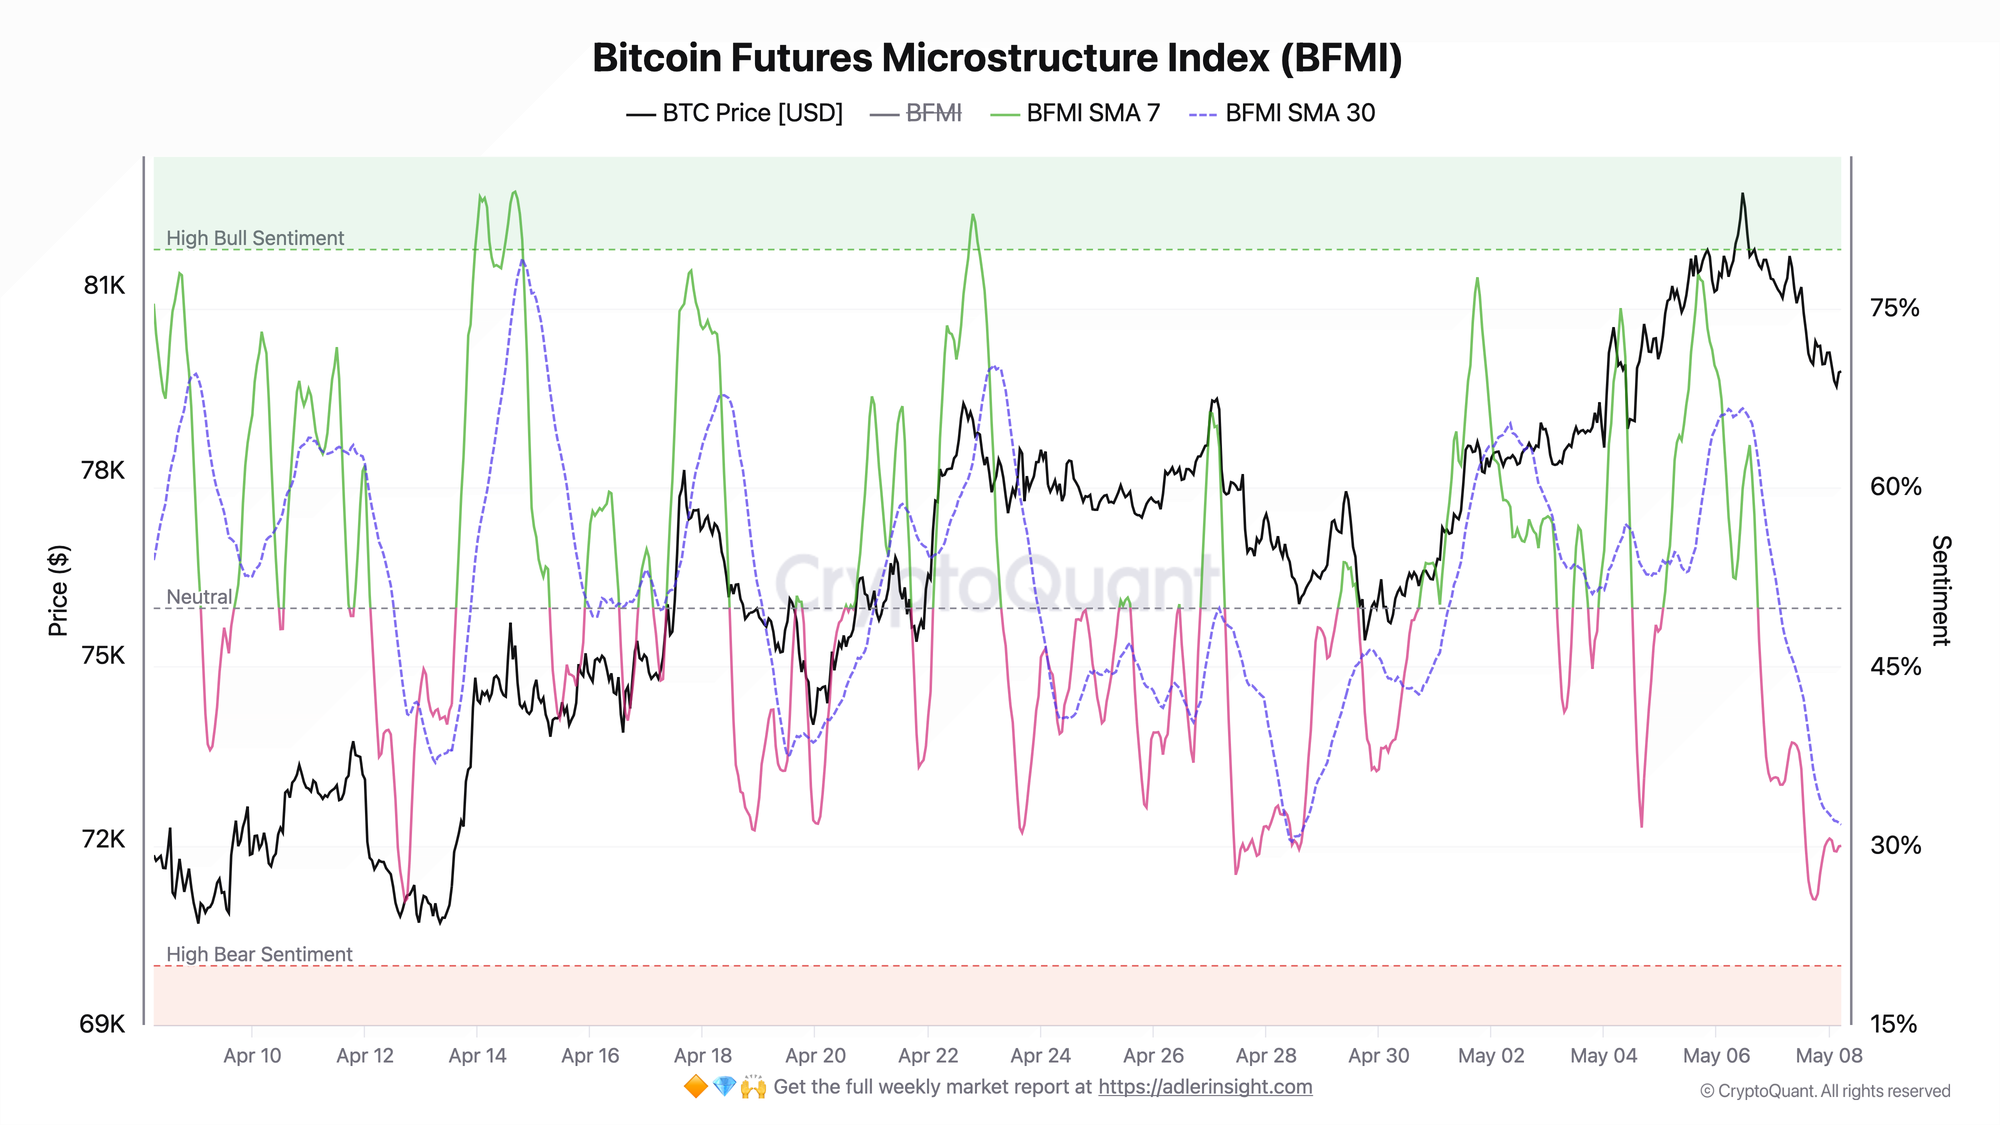
BFMI reflects the quality of futures microstructure: liquidity, order book balance, and flow aggressiveness. Values above 60 correspond to sustained bid-side pressure, below 35 - to seller dominance.
Over the past two weeks, BFMI completed a full cycle: from weak levels to a peak of 78-89 around May 5-6, then rapidly collapsed back to 26-34 by May 7-8. SMA-7, which served as confirmation of the upward impulse, reached a high of around 77-78 and crashed to 30 within 48 hours. SMA-30, acting as a regime filter, also reversed downward from the 65-66 range and is now around 32. In recent hours, BFMI has been holding below both moving averages, indicating a clear deterioration in structure.
A SMA-7 breakdown from above, combined with a simultaneous SMA-30 reversal, points to the end of the short-term impulse. Confirmation of continued weakness will be BFMI closing below 35 over the next 24-48 hours. A recovery above 45 with SMA-7 turning back up will be the first signal for reassessment.
Bitcoin Futures Long/Short Liquidations Dominance
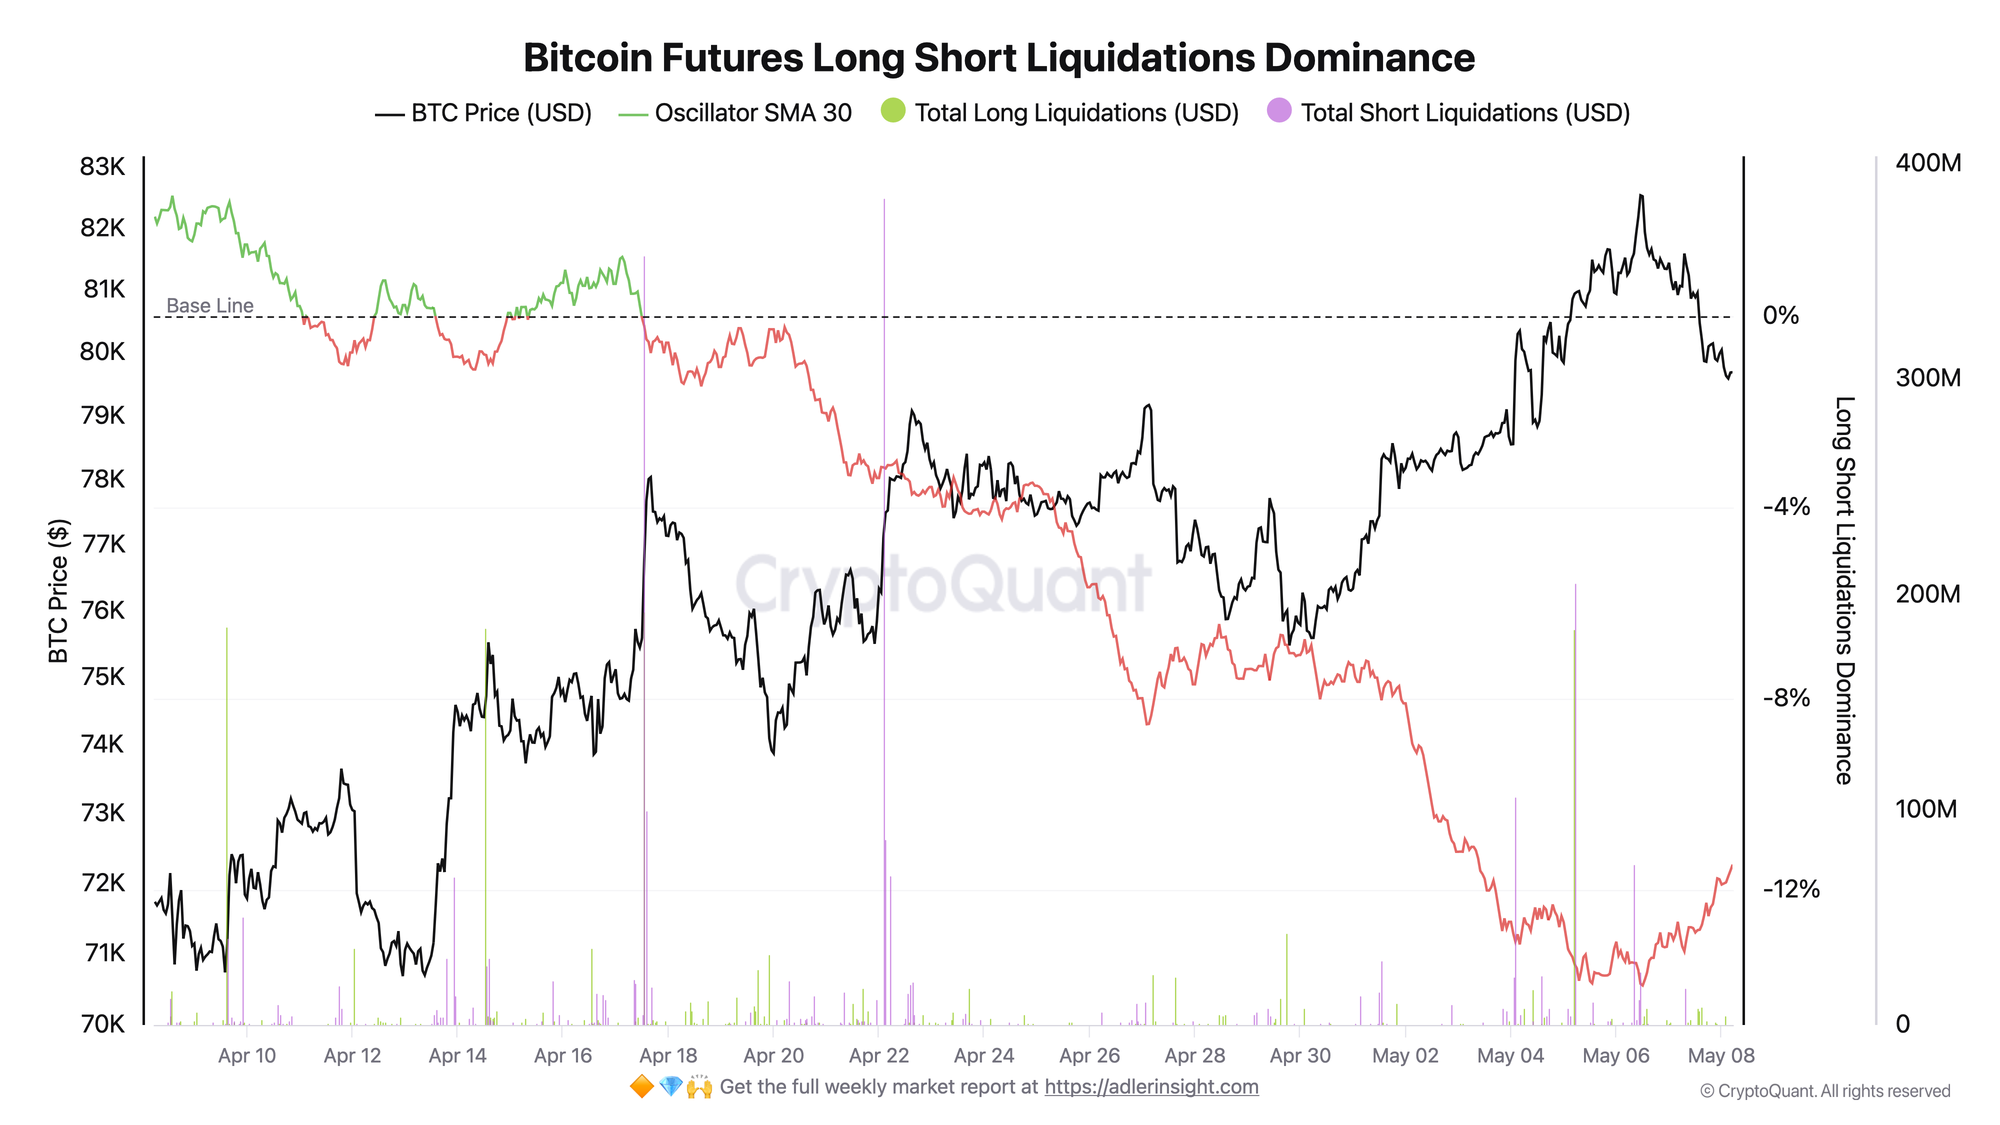
The liquidations dominance oscillator shows whose positions are being forcibly closed more actively - longs or shorts. Positive values indicate dominance of long liquidations, negative values - dominance of short liquidations.
Over the past 14 days, the indicator never moved above zero: the window opened on April 17, then the metric deepened to a local minimum of -14.00 and is now at -11.47. The last 2 days brought only a partial improvement: the oscillator rose from -13.29 to -11.47, but remained in negative territory.
This means short liquidations still dominate, but they are no longer generating enough support to offset the sharp deterioration in BFMI. In other words, the derivatives backdrop remains broadly supportive of price through short squeezing, but the impulse within the futures structure has noticeably faded.
🟠 Outperform Buy & Hold with a rules-based strategy - Start free. One weekly action, clear triggers, and invalidation levels. No guessing.
FAQ
Why does the price growth over the past 2 weeks not look fully confirmed? Because the rally was accompanied by a dominance of short liquidations, but the quality of the futures structure itself deteriorated sharply. In other words, the market is still receiving support through forced closure of short positions, but the internal impulse is already weakening.
Under what conditions will the current regime shift to bullish? The strongest confirmation will be BFMI recovering above 50 with SMA-7 turning back up. Additional confirmation will come from the oscillator staying negative or deepening further, which would signal a new wave of short liquidations against a strengthening microstructure.
CONCLUSIONS
The futures market has completed a short-term impulse cycle. BFMI degraded from the maximum aggression zone of 78-89 to the 26-34 range within 48 hours, with SMA-7 breaking SMA-30 from above. The liquidations oscillator, meanwhile, has remained below zero for several weeks, indicating systematic dominance of short position liquidations. The current regime is neutral risk-off: price is still receiving local support through short liquidations, but the futures microstructure has already noticeably weakened. The key trigger for reassessment is BFMI recovering above 50. The key risk is BTC closing below $79K with BFMI below 30, which would indicate further degradation of market structure.
Further Reading
- Bitcoin Open Interest & Leverage Ratio
- Bitcoin Funding Rates: Definition, Formula & Cycle Signals
- Bitcoin Open Interest vs Price: 4 Divergence Patterns Every Trader Must Know
- Bitcoin Liquidation Cascade: How It Works, Why It Happens & How to Predict It
- Bitcoin Open Interest and Funding Rate: The Combined Framework for Reading Derivatives Markets