
🎧 Morning Brief #153 - audio debate on today’s market setup
Bitcoin Positioning Index climbed to 40.1, while its SMA-30d rose to 4.5 - a 4-month high. At the same time, Open Interest 30D Change added +14.5%, repeating one of the strongest readings over the 120-day observation period. Together, these two signals point to a new risk-on positioning build in the market.
TL;DR
The Positioning Index is steadily reversing higher while open interest is growing again at a double-digit pace. This means the market is gradually building new positions. The main risk to this setup is a reversal of OI back below zero.
Bitcoin Positioning Index Trend
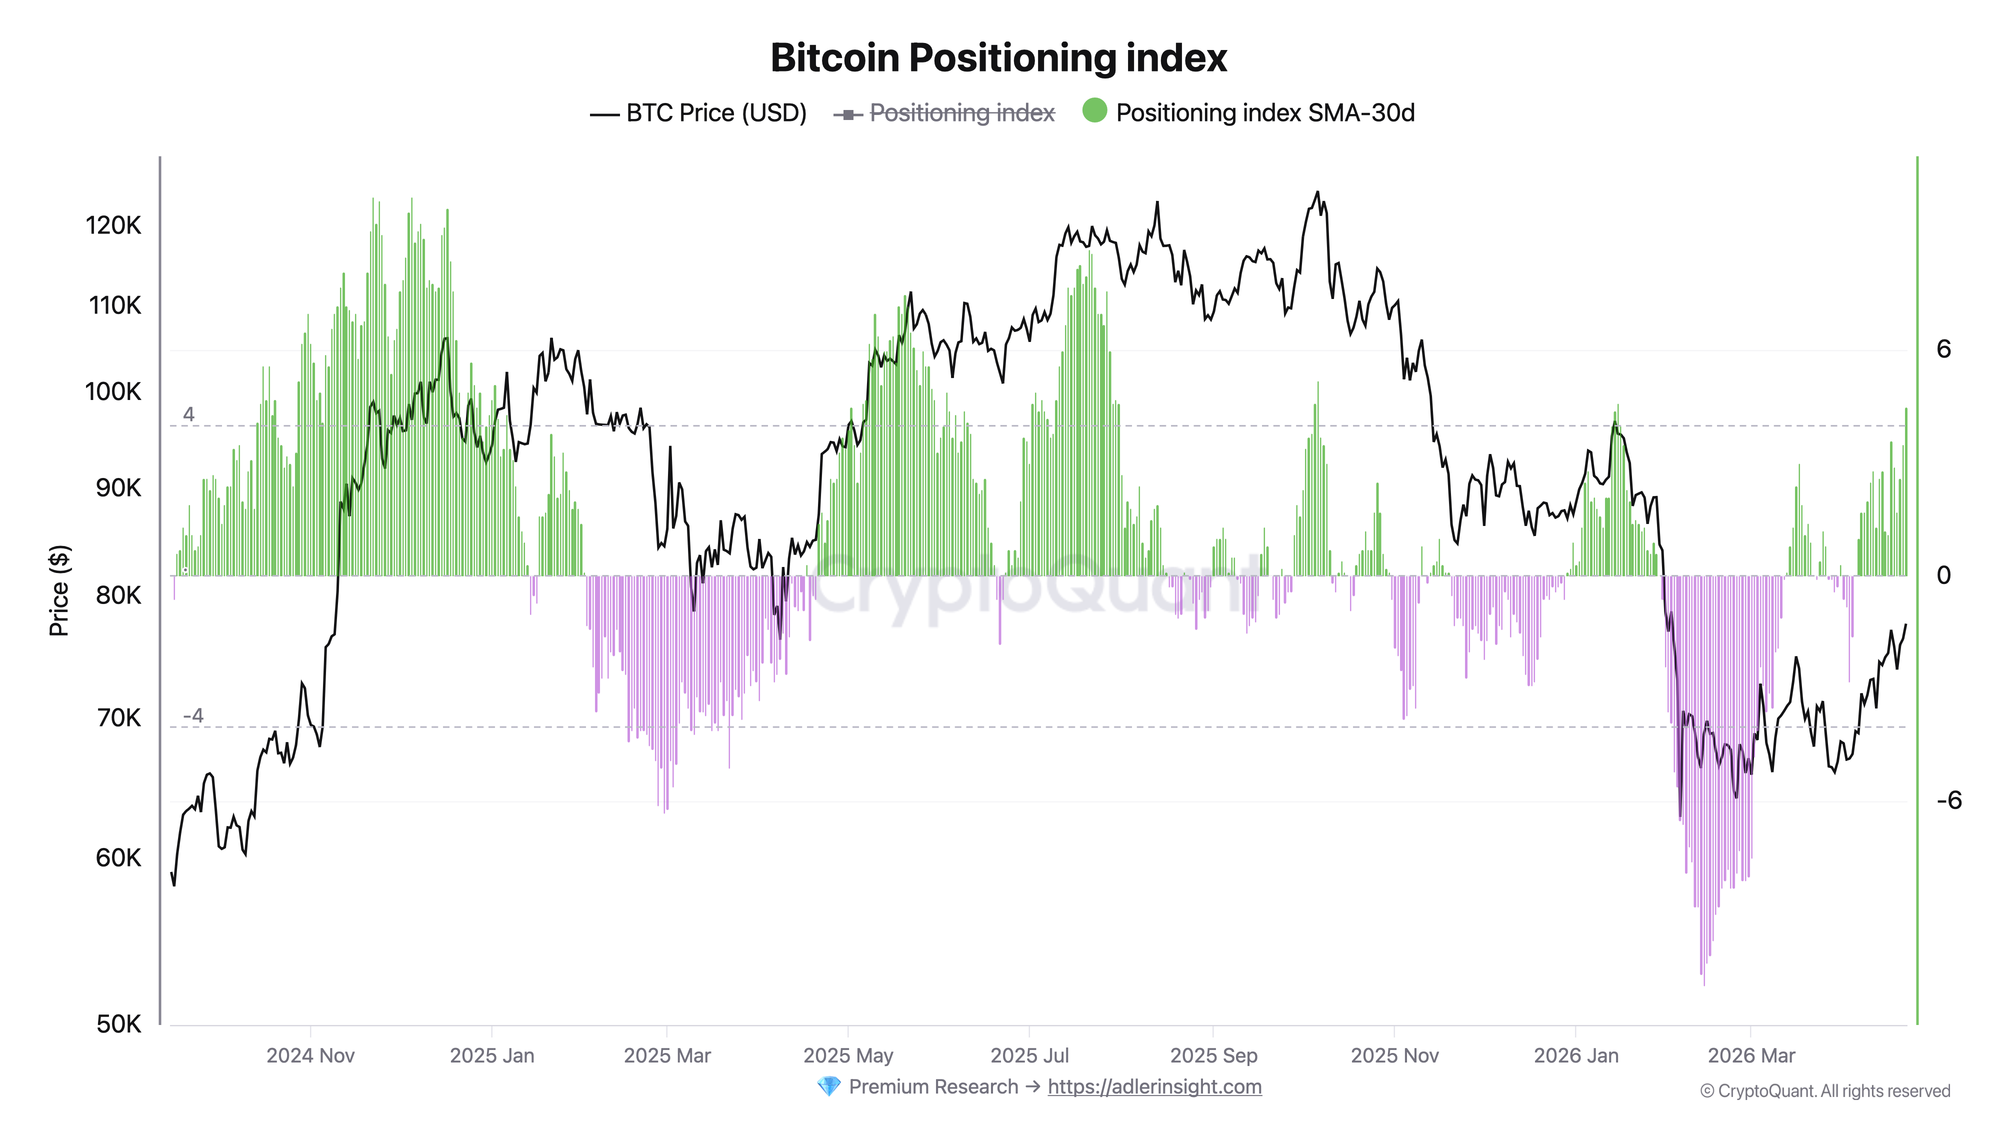
The Positioning Index is a composite indicator that combines directional taker flows, open interest dynamics, funding, and the balance of exchanges where bullish flow is confirmed by rising OI versus exchanges where bearish positioning dominates - into a single signal.
Over the past month, the daily index spiked and recovered sharply several times, but the smoothed metric continued to rise without breaking its trend - from 0.4 at the end of March to 4.5 today. This is the key signal of the chart: the market has stopped living on short-term impulses alone and has started forming a sustained positional edge.
Historically, this is also a significant shift. In February, the SMA-30d fell to -10.9 as BTC dropped below $63K. Since then, the indicator has recovered by more than 15 points.
Bitcoin Futures Open Interest - 30D Change %
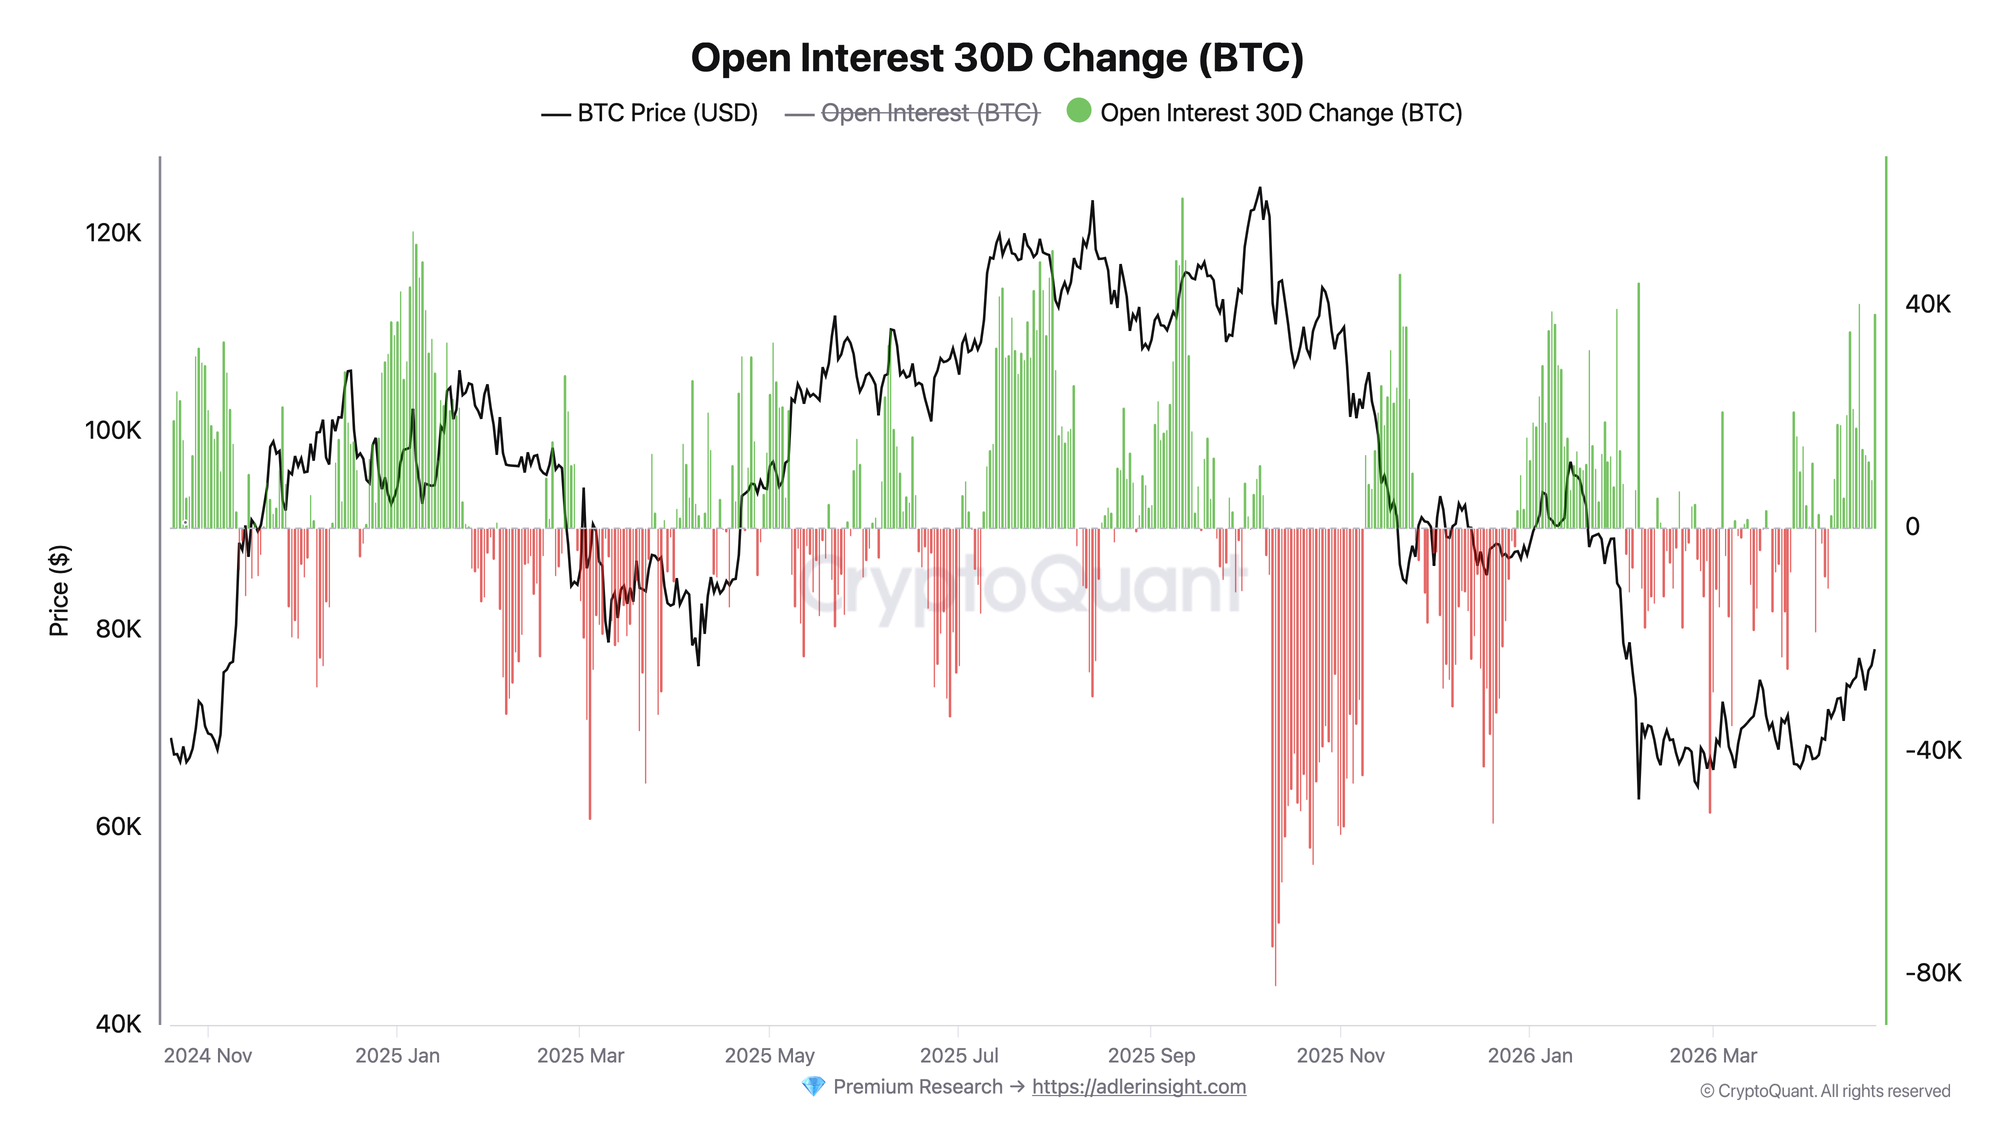
The second chart is needed to verify the quality of the first signal. If the Positioning SMA-30d is rising but OI is falling at the same time, the market is clearing old positions. If SMA-30d rises alongside OI, it is a sign of fresh risk accumulation.
What we are seeing now is exactly the second scenario. OI 30D Change % stands at +14.5%. This is one of the two strongest readings over the last 120 days. Moreover, 23 out of the last 30 days closed with positive OI. This is a sustained upward leverage rebuild.
The key conclusion only emerges from the pair: Positioning SMA-30d is rising, and OI 30D Change % is rising too. This combination signals fresh positioning - the market is adding new positions, not just closing out a squeeze.
Stop holding through every crash - start your 7-day free trial. Weekly Engine tells you when to stay in, when to step aside, and when risk is rising.
FAQ
How is the current signal different from the January spikes? In January, the daily Positioning Index also briefly surged above +20 and +30, but the structure deflated quickly and OI did not provide the same confirmation. The current setup is much stronger: the smoothed SMA-30d trend is moving higher, and OI is simultaneously confirming an inflow of new leverage. This is not a single impulse - it is a coordinated move across two metrics.
When does this signal break down? The first clear breakdown signal is OI 30D Change % moving back below zero. That would indicate the market is entering a deleveraging phase again. The second signal is SMA-30d reversing lower and returning below zero. At that point, the narrative shifts from a new positioning build to an unsustained spike that failed to embed itself in the structure.
Conclusions
At this point, the market is showing price recovery alongside improving derivative positioning structure. The Positioning Index has reached a 4-month high of 4.5, and OI 30D Change % has risen to +14.5%. Together, this leads to one conclusion: the market is building new positions.
As long as OI remains in positive territory and SMA-30d continues to rise, the base case remains constructive. The main risk is a sharp drop in open interest that could quickly turn the current strength into a leveraged trap.
Further Reading
- Bitcoin Open Interest & Leverage Ratio - what open interest measures and how leverage ratio signals market risk
- Bitcoin Open Interest and Funding Rate: The Combined Framework for Reading Derivatives Markets - how to read OI and funding together as a positioning signal
- Bitcoin Open Interest vs Price: 4 Divergence Patterns Every Trader Must Know - divergence patterns between OI and price and what they signal