
🎧 Morning Brief #152 - audio debate on today’s market setup
Bitcoin is going through a notable episode of exchange outflows. In March, the 30-day net flow moved sharply into negative territory, and total exchange reserves dropped by more than 105K BTC over seven weeks. Both indicators point to the same process: coins are leaving trading platforms, and available market supply is gradually contracting.
TL;DR
This brief covers a synchronized accumulation signal: in March, 30D Net Flow fell to -300K BTC, while exchange reserves have been declining for seven consecutive weeks. This is a strong exchange outflow signal over recent months, though not a historical extreme on the full chart horizon. Fewer coins on exchanges means less potential selling supply.
Bitcoin 30D Net Flow (BTC)
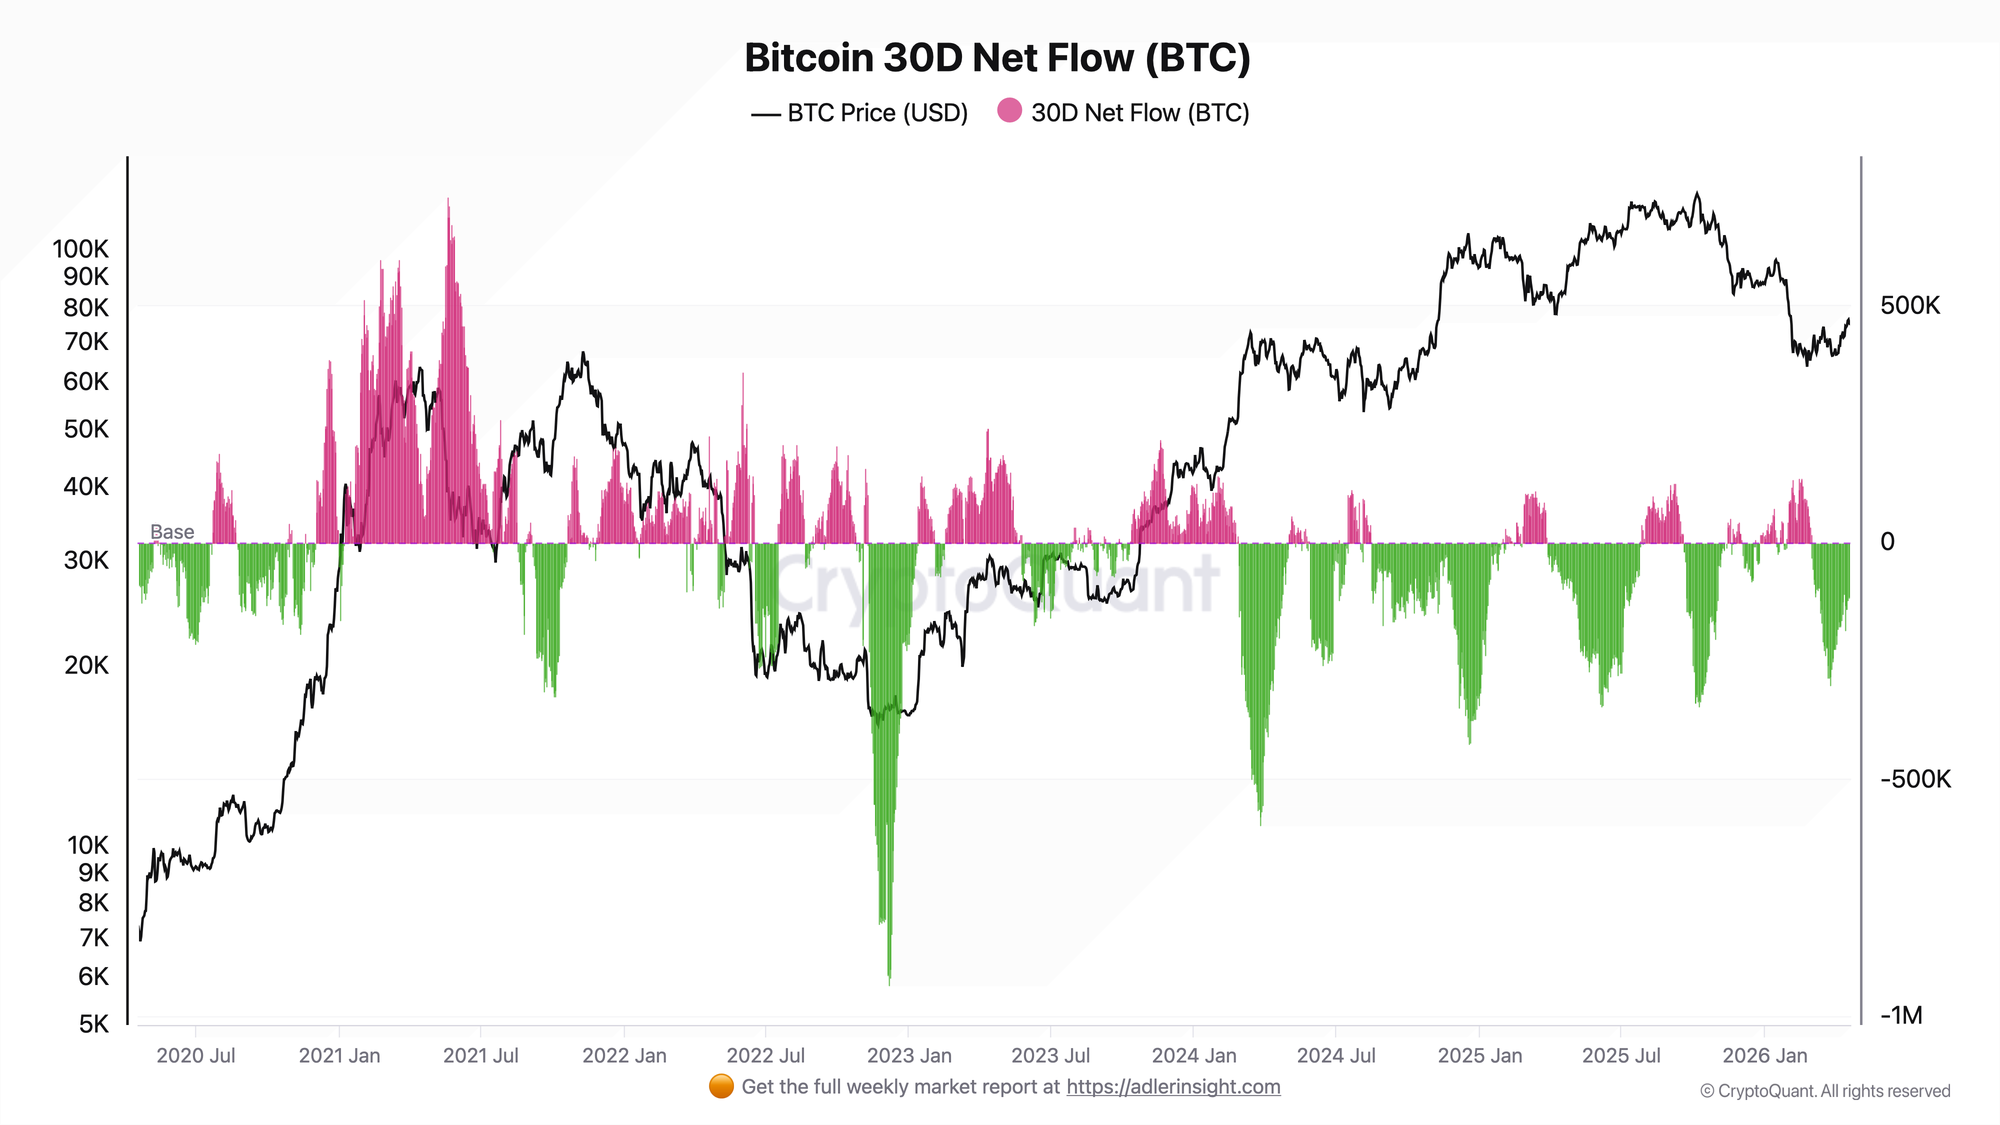
The metric reflects the net movement of coins to and from exchanges over a rolling 30-day window. Negative values indicate exchange outflows and a reduction in available supply; positive values indicate coin inflows to exchanges and a potential increase in selling pressure.
In February 2026, the 30-day flow remained in positive territory, reaching +94K BTC. This meant coins were flowing onto exchanges and potential selling supply was growing. In early March, the flow reversed sharply and the market shifted into active withdrawal mode. The local trough came on March 25, when the indicator reached -300,563 BTC over 30 days. This is a strong outflow episode by recent months' standards, though not the deepest level on the full displayed period. By April 21, the reading recovered to -98,075 BTC - outflows continue, but the pace has slowed considerably.
The slowdown from -300K to -98K BTC does not signal a reversal. The flow remains negative, meaning the supply structure has not deteriorated. The key question now is whether this represents normalization after the strong March extreme, or the first sign of demand saturation. A return of the 30D Net Flow to sustained positive territory above +30K-50K BTC would be the warning signal to watch.
Bitcoin Exchange Reserve - All Exchanges
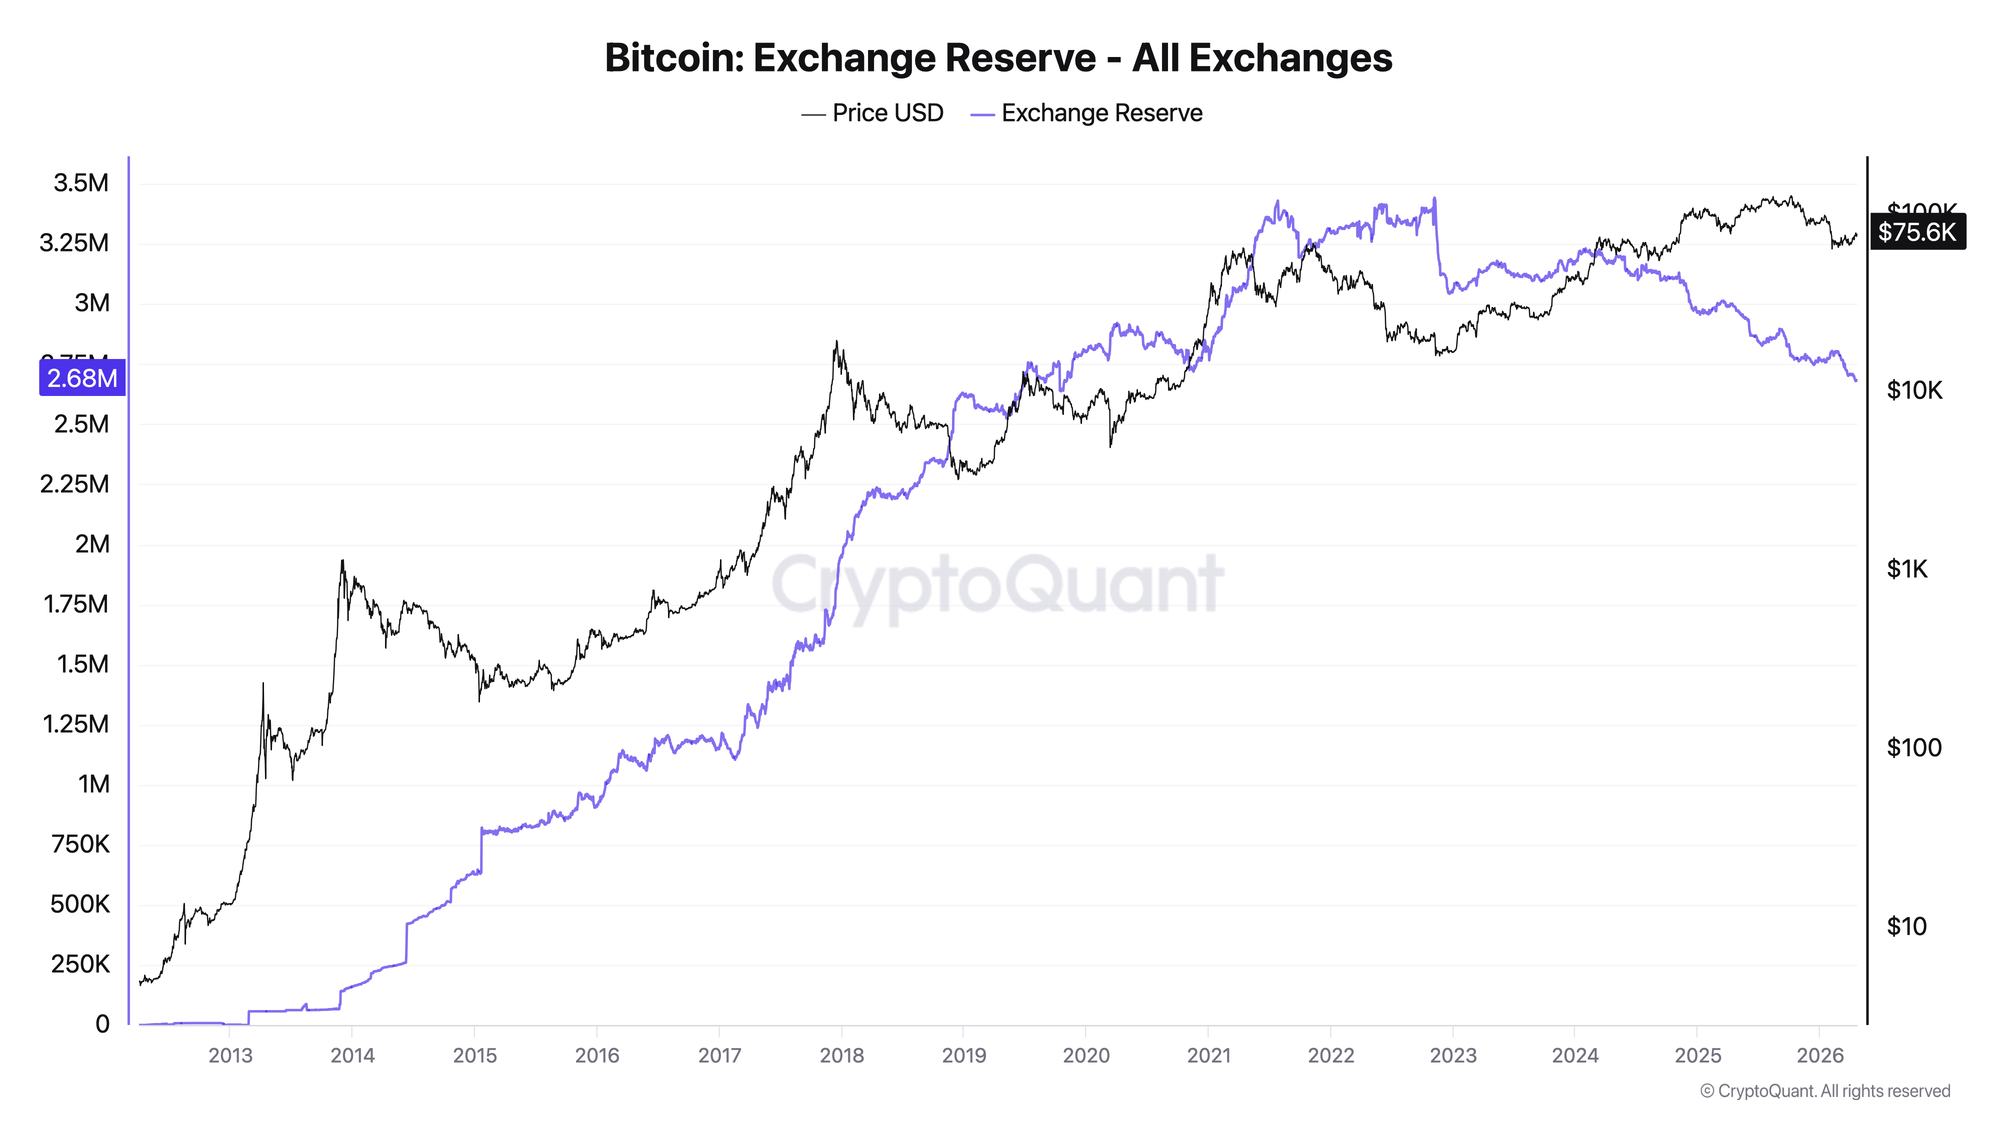
The metric shows the total volume of BTC held across all major centralized exchanges.
Since early March 2026, exchange reserves have declined by 105,171 BTC - from 2,786,361 BTC to 2,681,190 BTC as of April 21. The decline has continued for nearly seven consecutive weeks. Particularly notable is the fact that in the first half of April, when BTC was trading in the $67K-$72K range, reserves showed no meaningful inflow spike. Even under price stress, holders did not send coins back to exchanges - which reads as a signal of conviction in their positions.
The decline in reserves combined with the absence of panic inflows during the April drawdown suggests that coins continue to settle into the hands of more patient holders. At the current price of $75K, available exchange supply is 105K BTC lower than it was in early March. The main risk to this setup is a return of coins to exchanges as price approaches higher resistance levels.
The combination of these two charts confirms a single narrative: in March, the market went through a strong episode of exchange outflows, after which both indicators began normalizing in sync. The peak intensity is likely behind us, but the structural withdrawal of coins from exchanges continues.
Stop monitoring dozens of BTC charts - get one clear market verdict. ADLER Terminal compresses on-chain, derivatives, and macro data into a simple YES / CAUTION / NO, updated 4 times a day. Unlock access.
FAQ
If coins are being withdrawn from exchanges, why isn't price rising aggressively? Because outflows reduce supply but do not create demand on their own. A strong upside impulse requires a new buyer - spot, ETF, or macro liquidity. Declining reserves improve the supply structure but do not substitute for a demand catalyst.
At what Net Flow level does the picture turn negative? If the 30D Net Flow returns sustainably to positive territory and holds above +30K-50K BTC, that would signal coins returning to exchanges and growing potential supply pressure. As long as the flow remains negative, the supply structure remains constructive.
CONCLUSIONS
Both indicators form a consistent constructive signal on supply structure. The February inflow to exchanges gave way to strong March outflows, and exchange reserves contracted by more than 105K BTC over seven weeks with no notable inflow spike - even during the April drawdown.
Current regime - neutral with a bullish lean on on-chain supply structure. The primary confirmation signal is further reserve decline below 2,680K BTC with 30D Net Flow holding in negative territory. The primary risk is a flow reversal back into positive territory, signaling coins returning to exchanges and rising supply pressure.
Further Reading
On-chain fundamentals behind today's signals:
- Bitcoin Exchange Reserve: Definition, Formula & Cycle Signals - how to read exchange reserve dynamics and what declining balances mean for supply structure
- Bitcoin Exchange Netflow: What It Is and How to Use It - a full breakdown of the Net Flow metric: methodology, interpretation, and historical examples
- Institutional Bitcoin Flows: ETF, Coinbase Premium & OTC - how institutional demand interacts with exchange outflow signals and what to watch on the buy side