
🎧 Morning Brief #151 - audio debate on today’s market setup
April became a month of extreme liquidations on both sides of the market, but the current resolution reads in favor of a short squeeze that has already played out. The combination of two charts shows not just the fact of liquidations, but the key question - was the move accompanied by a real exit of leverage, or did the market simply redistribute risk from one set of hands to another.
TL;DR
On April 17, the market went through the peak of a liquidation cascade: $525.87M in shorts were wiped out in a single day. After that, OI started to contract - and that is the key detail. The market did not continue building new leverage immediately after the impulse, but moved into a cooling phase. For now, this looks more like a healthy deleveraging after a squeeze than a new round of overheating.
Bitcoin Futures Long/Short Liquidations Dominance
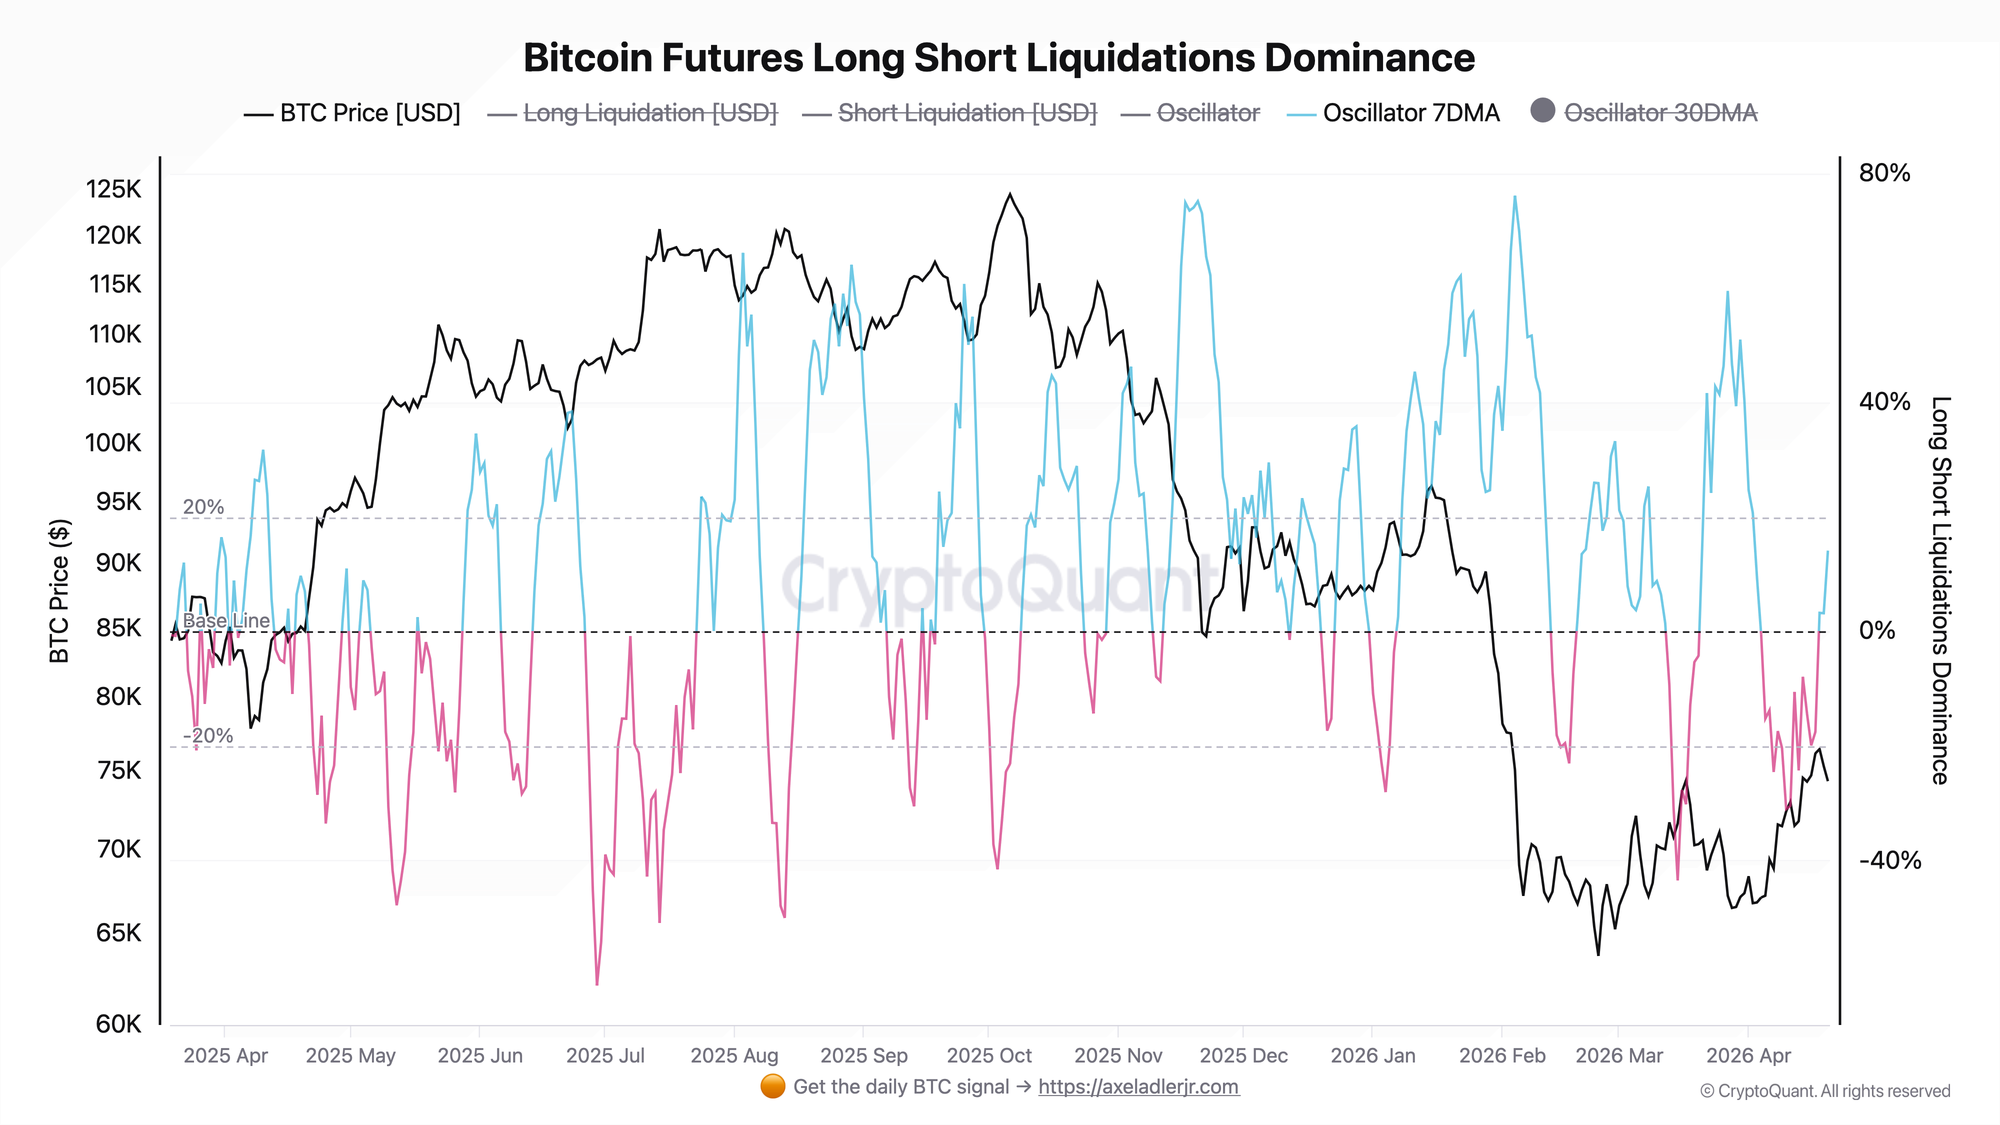
From April 4 to April 17, the metric continuously held in negative territory, dropping to a minimum of -31.0 during April 10-11. For almost two weeks, the market was in a mode of sustained short liquidation dominance - not isolated spikes, but systemic pressure on short positions.
The peak came on April 17: approximately $526M in shorts and $213.12M in longs were liquidated in a single day. Even after this shock, the metric remained negative (-17.6) - confirming that this was not an isolated event, but the conclusion of a longer phase.
The turning point was recorded on April 18: the 7DMA crossed zero for the first time in the month and by April 20 accelerated to +14.1. This coincided with price stabilization near $75,000-76,000 and signals one thing - the phase of systemic pressure on shorts is over, the regime has changed. The 30DMA throughout the entire period remained in a moderately positive zone, confirming: there is no long-term structural imbalance, April is an event-driven shock against a neutral backdrop.
Open Interest of Bitcoin Futures Top Exchanges - OI 7D Change (BTC)
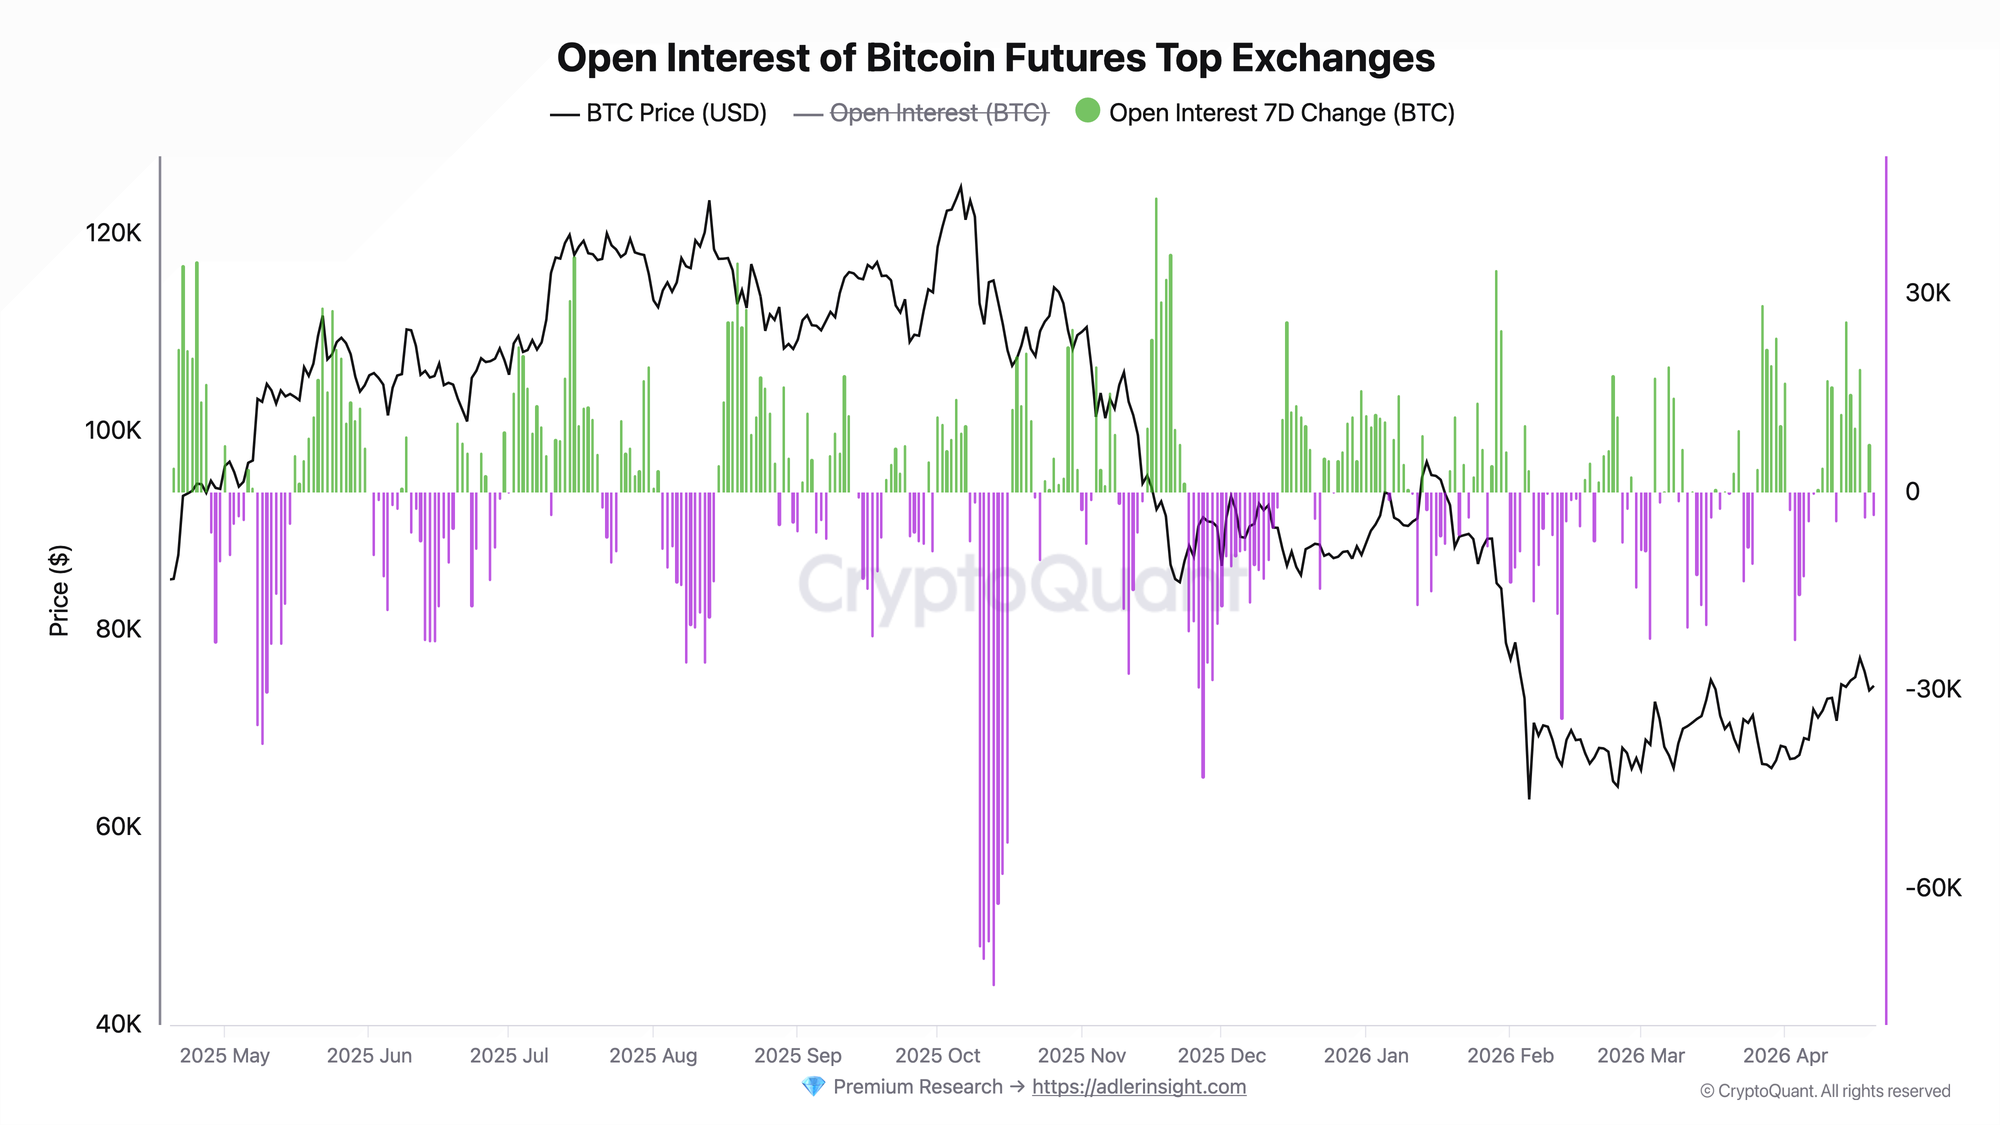
OI 7D Change shows the net change in open interest in BTC over a week. Growth means new positions being added, a decline means real leverage exiting the market. That is exactly why this chart is needed alongside liquidations: it answers the question of whether risk was burned out of the system or simply redistributed quickly.
From April 1 to April 7, the weekly OI flow remained negative, confirming real deleveraging. Then the situation changed sharply. From April 8 to April 14, OI recovered aggressively: by April 14, the weekly increase reached +25,917 BTC, and the absolute OI level grew to 307,346 BTC. This is a full leverage rebuild. The peak came on April 17, when OI reached 319,499 BTC - exactly at the moment of the largest bilateral liquidation event.
After that, contraction began. By April 20, OI declined to 293,045 BTC, and the weekly flow turned negative again, to -3,534 BTC. And this is the most important part of the whole picture. The leverage built up during April 8-17 did not stay in the system, but partially exited through liquidations and the subsequent cooldown. In other words, after the shock the market did not overheat again - instead it started to unwind.
What the Two Charts Say Together
The first half of April created the fuel for a sharp move: OI was growing, leverage was accumulating, the market was becoming increasingly fragile. On April 17, that fuel detonated. Both sides were hit, but right after this event OI moved lower while price stayed near local highs. That is a constructive combination.
That is why the current picture does not look like the start of a new overheating phase, but rather a cooling period after a squeeze that has already occurred. The next important question is straightforward: will OI return to 300,000+ BTC as price attempts to break $76,000-77,000, or will the market try to move higher on lighter positioning.
When Bitcoin moves, context matters more than opinions. ADLER Terminal filters the noise and delivers one actionable market read backed by real data and AI analysis. Access here.
FAQ
What happened on April 17 - a short squeeze or bilateral panic? Both. $525.87M in short liquidations and $213.12M in long liquidations point to extreme volatility and a forced market clearing. But the main focus is not just on the scale of liquidations - it is on what happened immediately after: OI stopped growing and began to contract. This strengthens the case for a completed squeeze rather than the launch of a new cycle of overheated leverage.
When will it become clear that deleveraging is complete and the market is ready for the next move? The reference point is stabilization of OI 7D Change in a moderately positive zone, for example in the range of +5,000 to +15,000 BTC, without new extremes in the liquidation oscillator. This would indicate that positions are returning to the market gradually, without excessive pressure. If OI quickly returns to 310,000-320,000 BTC, the risk of a new liquidation cascade will rise again.
CONCLUSIONS
April 2026 in the BTC futures market passed through three distinct phases: deleveraging at the start of the month, aggressive leverage rebuild in mid-April, and forced clearing on April 17. The current regime looks cautiously constructive. A significant portion of short-side pressure has already been removed, OI has moved down from its peak, and the market is more likely cooling than building new overheating.
For the bullish scenario to continue, one straightforward condition is needed: price must hold above $75,000 and attempt the $76,000-77,000 zone without a rapid return of excess leverage. The main risk remains the same - if OI starts recovering faster than spot demand, the next liquidation cascade could hit the market again.
Further Reading
- Bitcoin Open Interest & Leverage Ratio
- Bitcoin Funding Rates: Definition, Formula & Cycle Signals
- Bitcoin Open Interest vs Price: 4 Divergence Patterns Every Trader Must Know
- Bitcoin Liquidation Cascade: How It Works, Why It Happens & How to Predict It
- Bitcoin Open Interest and Funding Rate: The Combined Framework for Reading Derivatives Markets