
🎧 Morning Brief #150 - audio debate on today’s market setup
The long-term holder cohort continues to expand - LTH Realized Supply grew from 5.26M to 8.32M BTC over the last three months. At the same time, LTH SOPR (7d-SMA) has dropped below 1.0. This combination matters: the volume of coins in the LTH cohort is growing, but part of the spent old coins is already exiting at a loss.
TL;DR
The volume of coins in the LTH cohort has risen sharply, but the drop in SOPR below 1.0 shows: part of long-term holders is already spending coins at a loss. For now this looks like local stress, not capitulation - the key question is how quickly SOPR returns above 1.0.
Bitcoin LTH Realized Supply (Total)
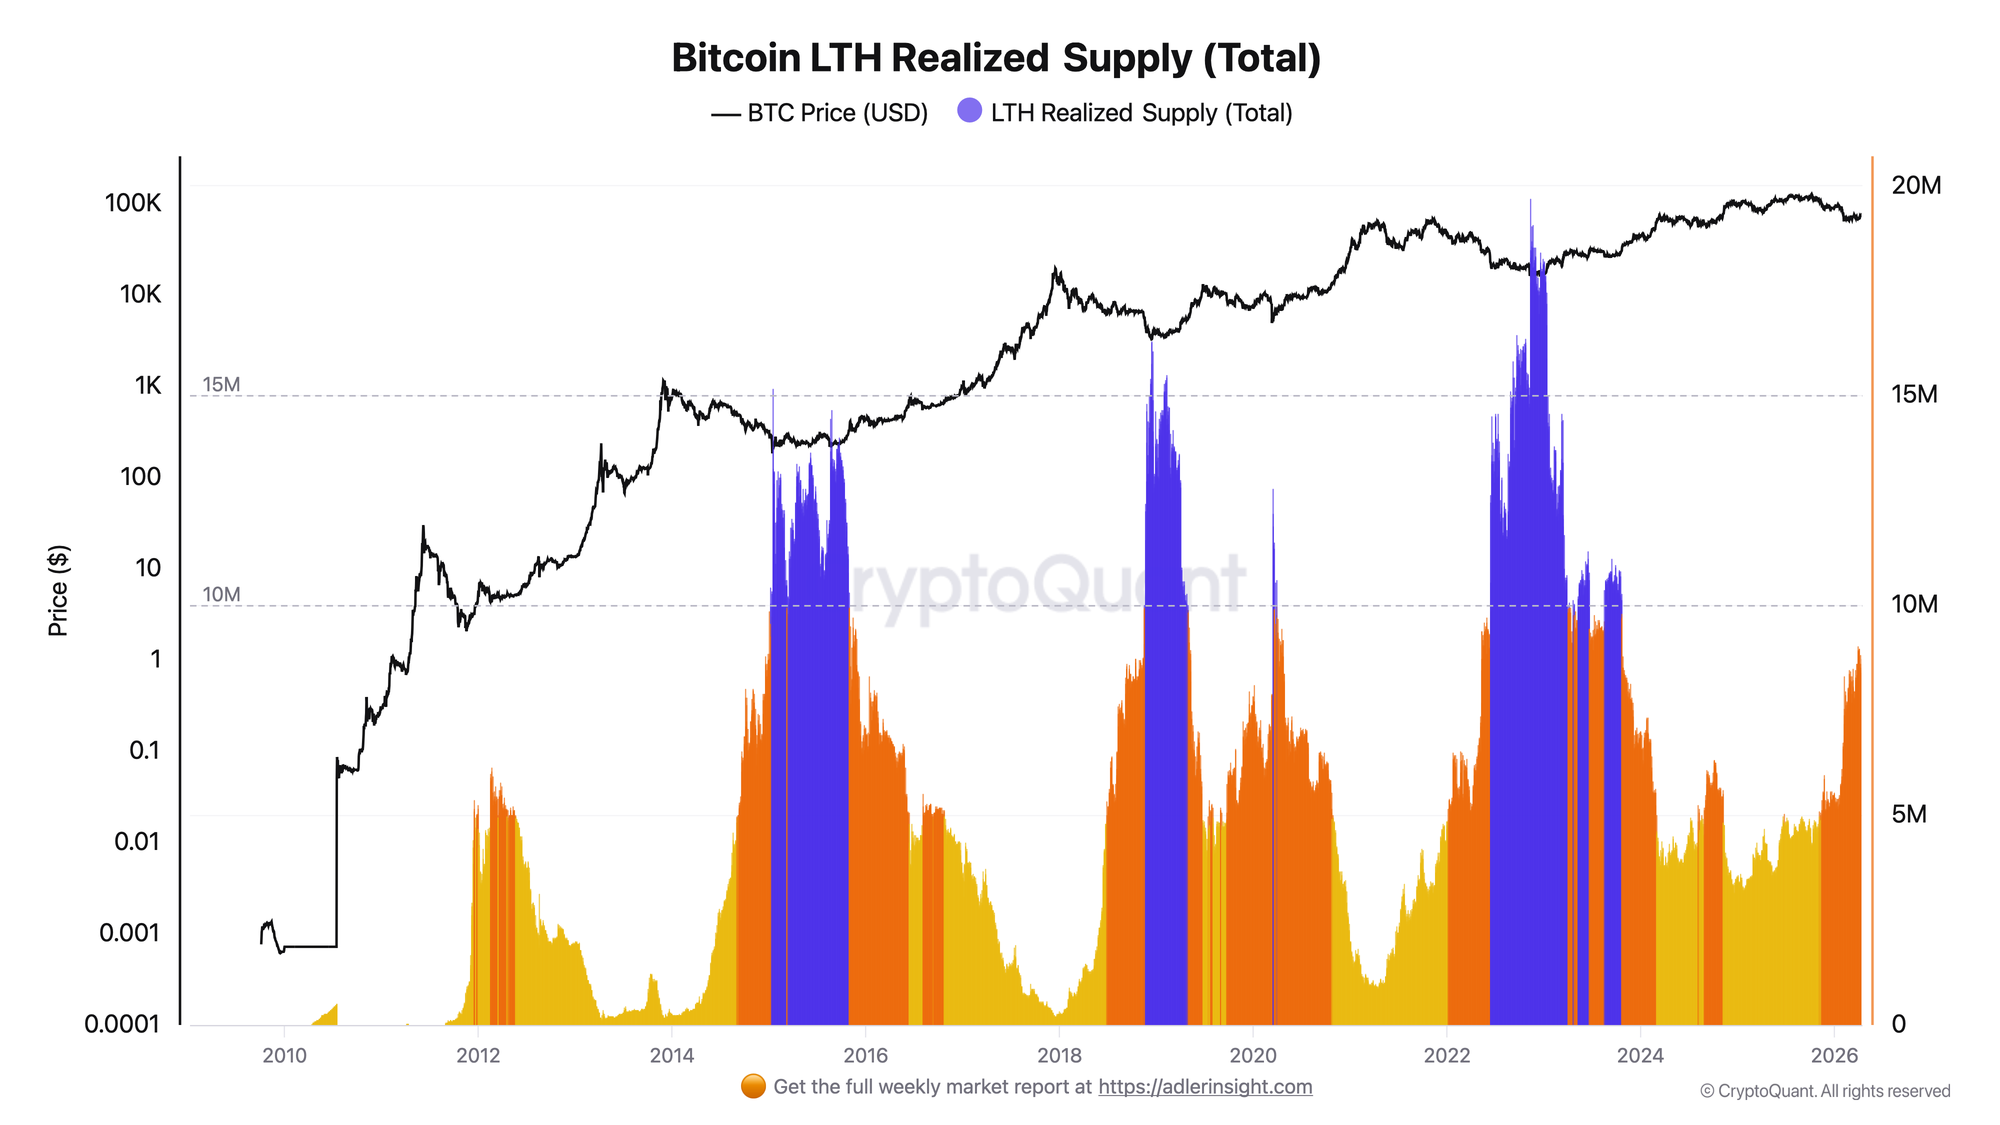
The metric reflects the total volume of BTC held within the LTH cohort - coins that have not moved for more than 155 days. An important nuance: growth in this series does not mean all these coins were purchased recently. Part of the increase comes from existing supply simply "maturing" and transitioning into the LTH category by remaining idle.
Over the last three months, LTH Realized Supply added 3.06M BTC - from 5.26M in January 2026 to 8.32M as of April 16. A year ago, the figure was just 4.35M BTC. For comparison: at the peak of the 2022 bear market in November, LTH Realized Supply reached 15.31M BTC, after which it began declining as old coins were spent.
The current dynamic points to LTH cohort expansion amid consolidation near $75,000. This profile typically corresponds to liquid supply compression, but does not by itself guarantee an immediate price increase. The key deterioration signal is a sustained reversal of LTH Realized Supply downward, indicating old coins are returning to circulation.
Bitcoin LTH SOPR 7d-SMA
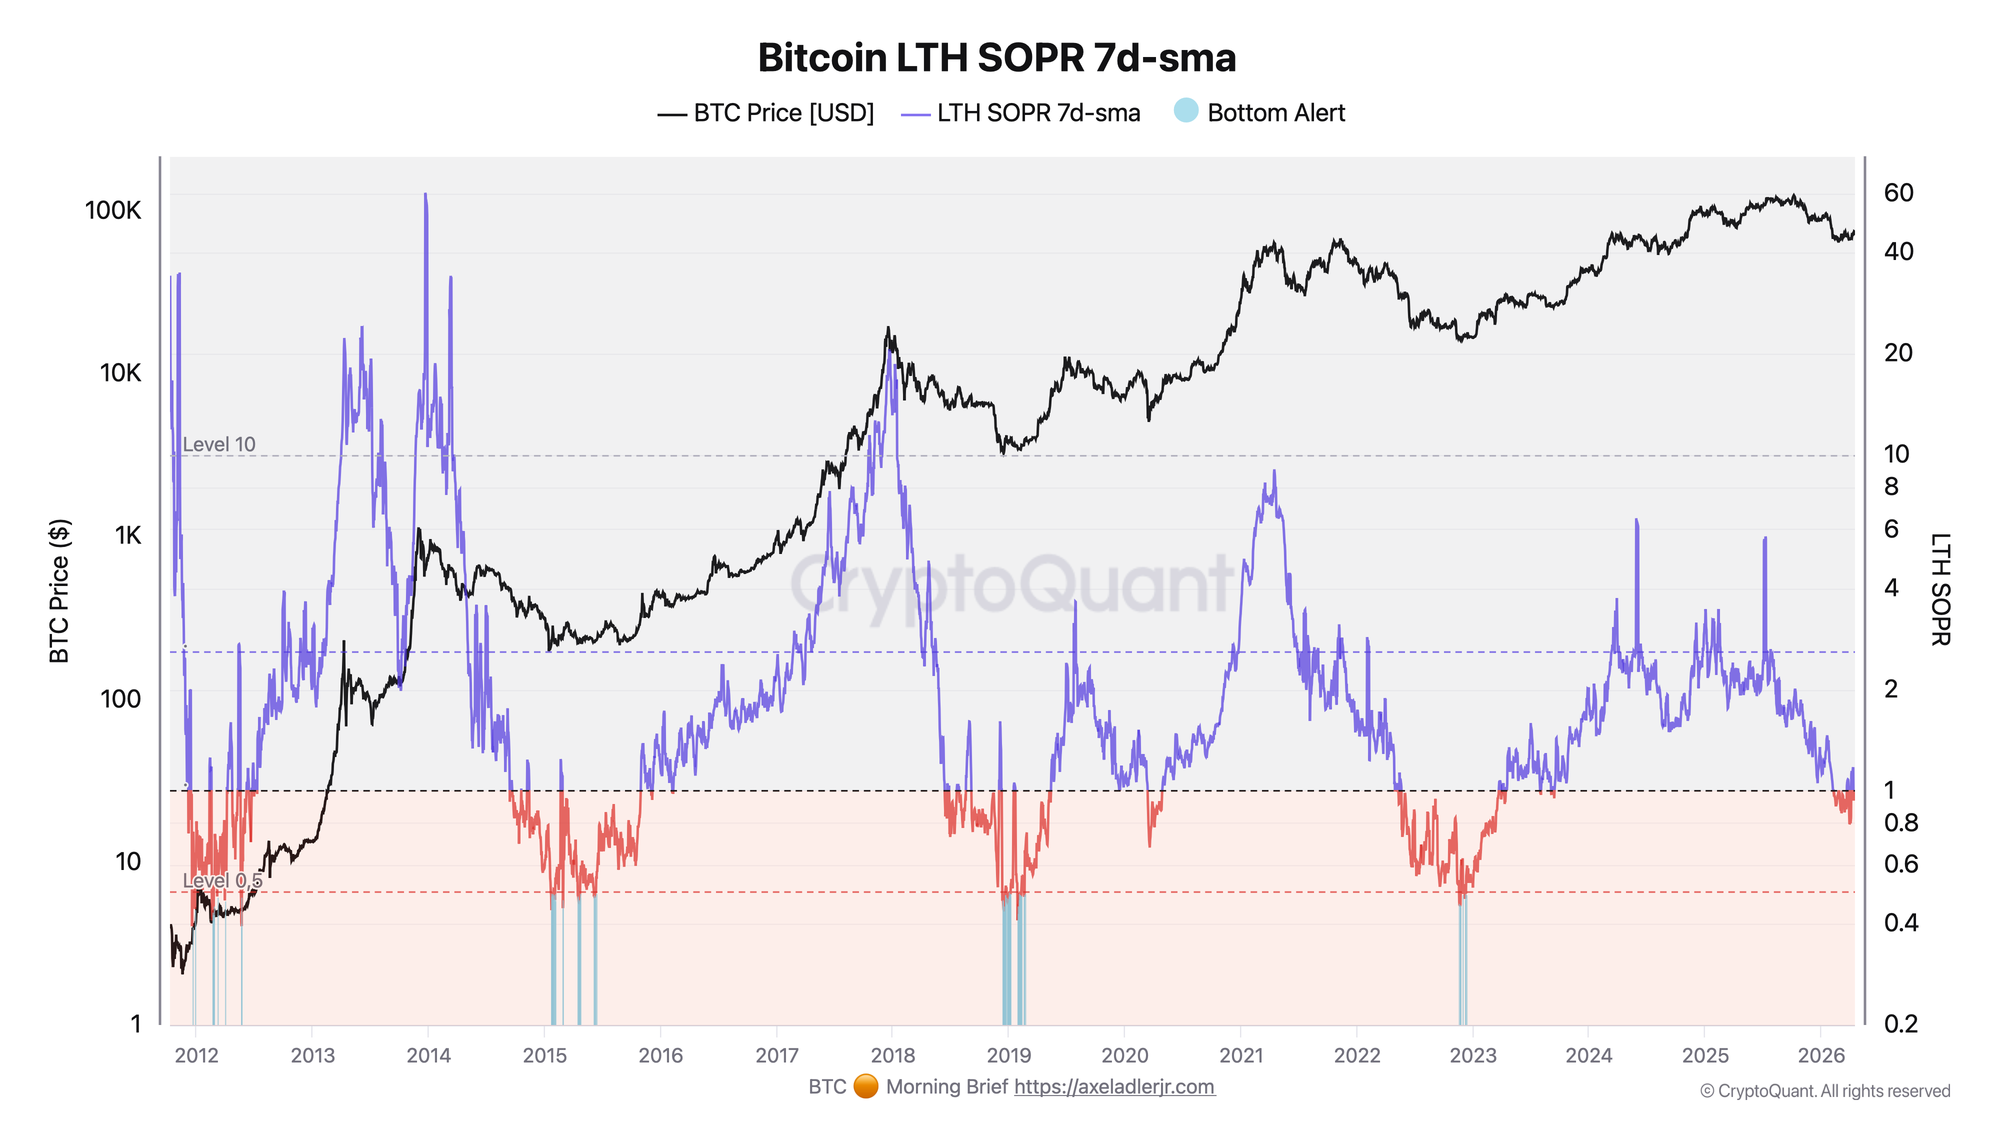
LTH SOPR (Spent Output Profit Ratio) shows the profitability of coins being spent specifically by long-term holders. A value above 1.0 means selling at a profit, below 1.0 means selling at a loss. Importantly, this is a metric of spent coin behavior, not of the entire LTH supply.
The current LTH SOPR (7d-SMA) value is 0.979 - the fifth consecutive day below 1.0, with the series running since April 12. However, this is not the first episode below the neutral zone in 2026: the chart shows that starting from February, SOPR has repeatedly dropped below 1.0. The deepest episode came in late March - early April, when the indicator fell to 0.798, remaining below 1.0 for seven consecutive days. After a brief recovery above 1.0 (April 5-11), SOPR dropped below the neutral mark again.
For historical context: in 2022, LTH SOPR fell to 0.45 and stayed below 1.0 for 231 days, and in 2018-2019 - for 292 consecutive days. The current picture is a series of recurring shallow dips below 1.0 with quick recoveries, not a prolonged capitulation.
The key question now is whether the current series will hold above the March lows (0.798) or SOPR will break below them. A repeat move deeper, combined with a simultaneous reversal of Realized Supply downward, is the real red flag for a regime change.
When Bitcoin moves, context matters more than opinions. ADLER Terminal filters the noise and delivers one actionable market read backed by real data and AI analysis. Access here.
FAQ
Does SOPR below 1.0 signal the start of a new price decline? Not necessarily. The depth and duration of the episode are what matter. As long as the decline remains shallow (lows in the 0.93-0.80 range) and recovers quickly each time - this is a sign of short-term pressure, not confirmation of a new downside impulse. Historically, similar short-term dips with quick recoveries have been entry points.
Under what condition does the picture become clearly bearish? The red flag appears if LTH SOPR holds noticeably below 1.0 and begins declining deeper, while LTH Realized Supply simultaneously reverses downward. This would mean that old coins are not only being spent at a loss, but the LTH cohort itself is no longer expanding and is transitioning into a distribution regime.
CONCLUSIONS
The combination of these two metrics describes the market in a neutral-to-cautious mode. The growth in LTH Realized Supply points to cohort expansion and declining activity of old supply - a structurally positive backdrop. But the fresh drop of LTH SOPR below 1.0 shows that part of long-term holders is already selling at a loss, adding short-term uncertainty. The main positive trigger is a quick recovery of SOPR above 1.0 while Realized Supply continues its upward trajectory: this would confirm that the current weakness was a local episode, not a regime change. The main risk is a prolonged hold of SOPR below 1.0 with deepening losses and a simultaneous reversal of Realized Supply downward, which would shift the market from consolidation to a clear phase of old coin distribution.
Further Reading
- Bitcoin LTH vs STH: Supply Dynamics, Cost Basis & Market Structure - the foundational framework behind today's metrics
- Bitcoin STH SOPR: What It Is and How to Use It - SOPR mechanics explained, STH side of the same indicator family
- Coin Days Destroyed (CDD) & Liveliness: Definition, Formula & Cycle Signals - complementary metric for tracking old coin movement
- Bitcoin Dormancy Flow: Bottom Signals & Buy Zone Detection - how dormant coin behavior maps to cycle bottoms
- STH vs LTH Realized Price: Support & Resistance Guide - cost basis levels that define the current consolidation zone