
🎧 Morning Brief #149 - audio debate on today’s market setup
Both structural capital indicators - the growth rate of market cap relative to realized cap and the 30-day Realized Cap change - have remained in negative territory since the start of 2026. This means demand has failed to offset selling pressure for more than three months.
TL;DR
Since the start of 2026, capital has been systematically leaving the Bitcoin network: Realized Cap has declined, and the market cap growth rate has not sustainably risen above zero. A bullish reversal requires a restoration of fresh capital inflows - until then, the regime remains defensive.
Bitcoin Growth Rate (Market Cap vs. Realized Cap) 365DMA
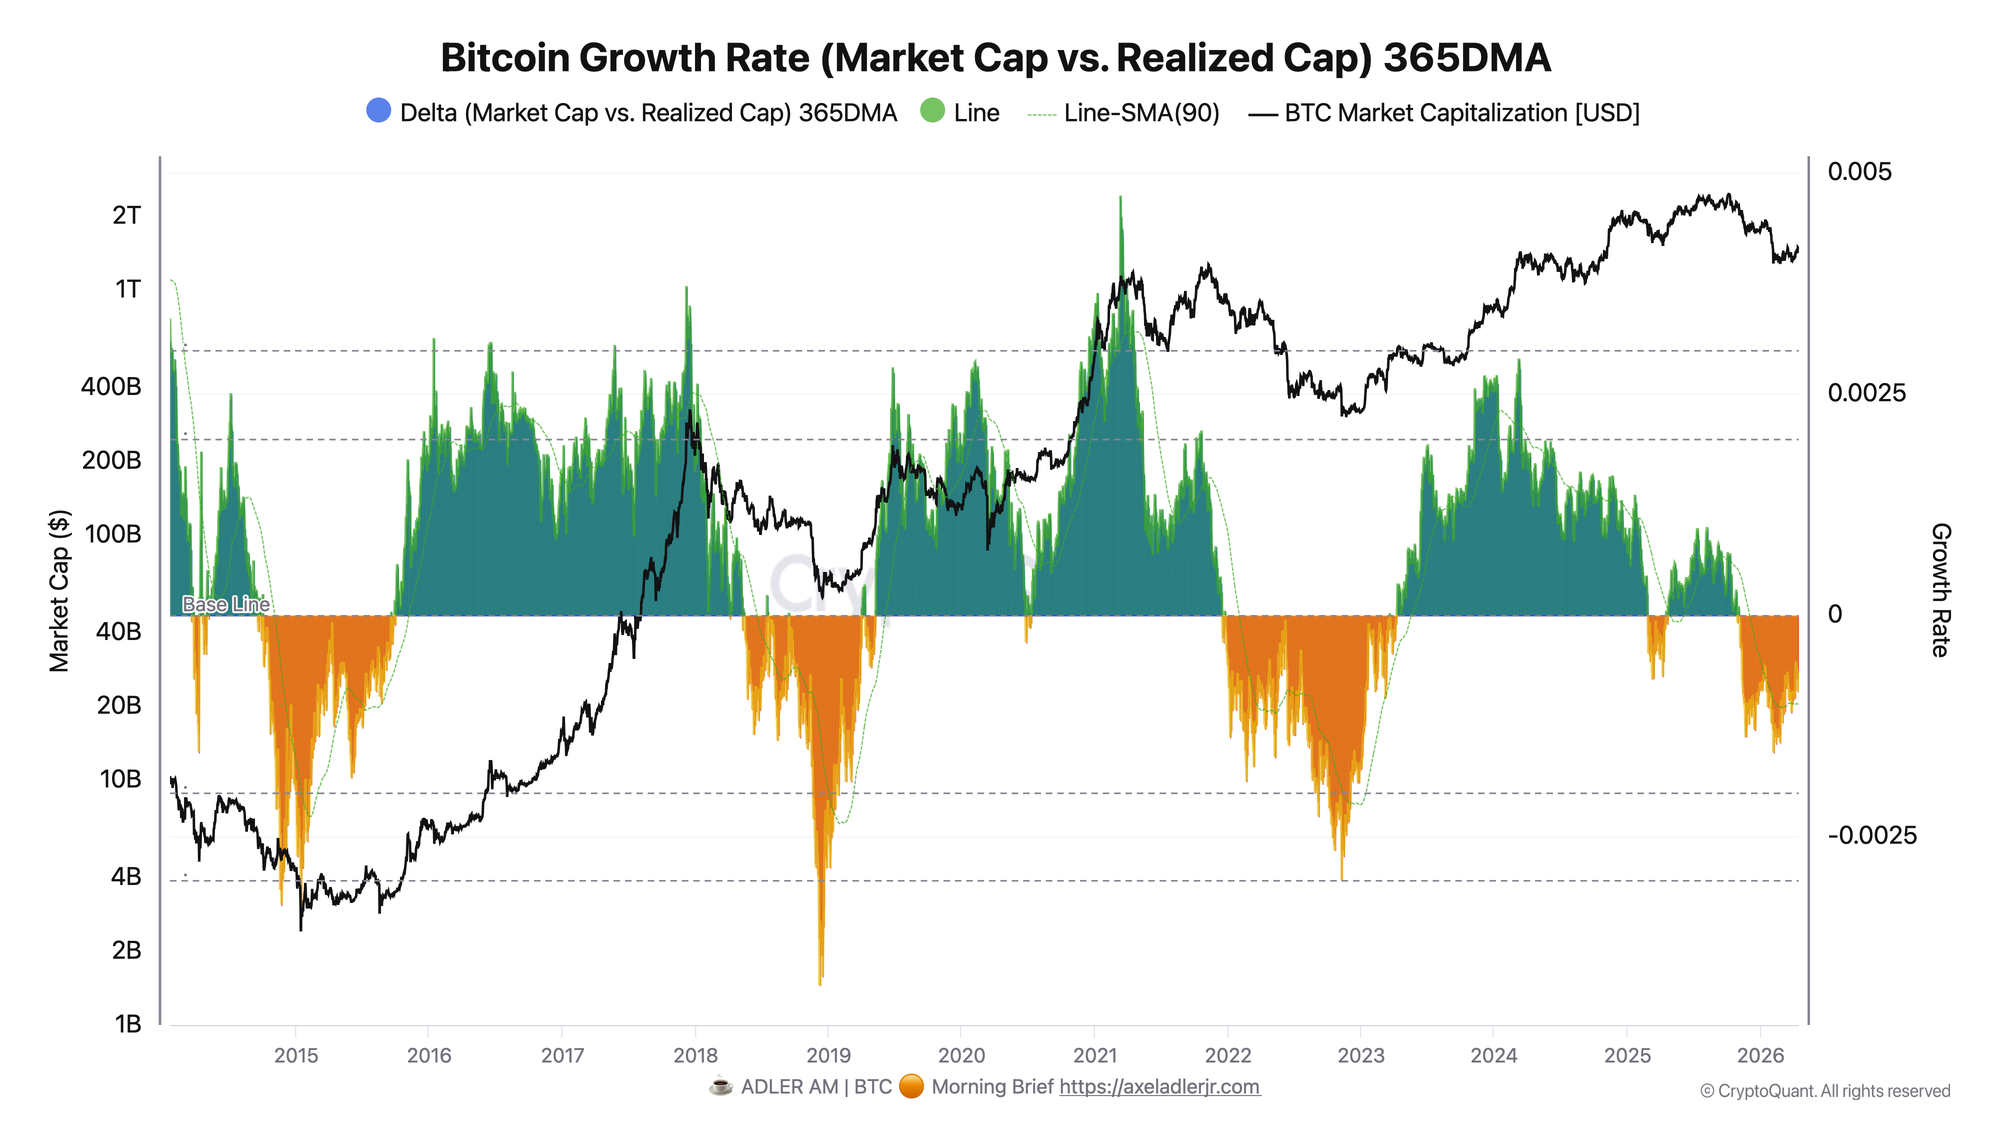
The metric reflects the difference between the growth rate of market cap and Realized Cap, smoothed by a 365-day moving average. Positive values indicate accumulation of new capital; negative values indicate its outflow.
Since January 1, 2026, the delta has not risen above zero once - across all 105 trading days the metric has remained in negative territory. The only attempt at a reversal was recorded in mid-January (January 16-22), when values briefly turned positive amid a price impulse, but by January 23 the pullback returned the metric to negative, where it has remained ever since. The current delta value is -0.000652, while the 90-day SMA has dropped to -0.001005 - meaning the medium-term trend is significantly weaker than even the current level, and the delta is trading above its SMA, which technically looks like a relative improvement, but in absolute terms remains deeply negative.
As long as the delta holds below zero, market cap is growing more slowly than Realized Cap - this is a structural bear regime. The trigger for a regime change is a sustained move of the delta into positive territory and its hold there for more than a week.
Bitcoin Realized Cap Change 30D
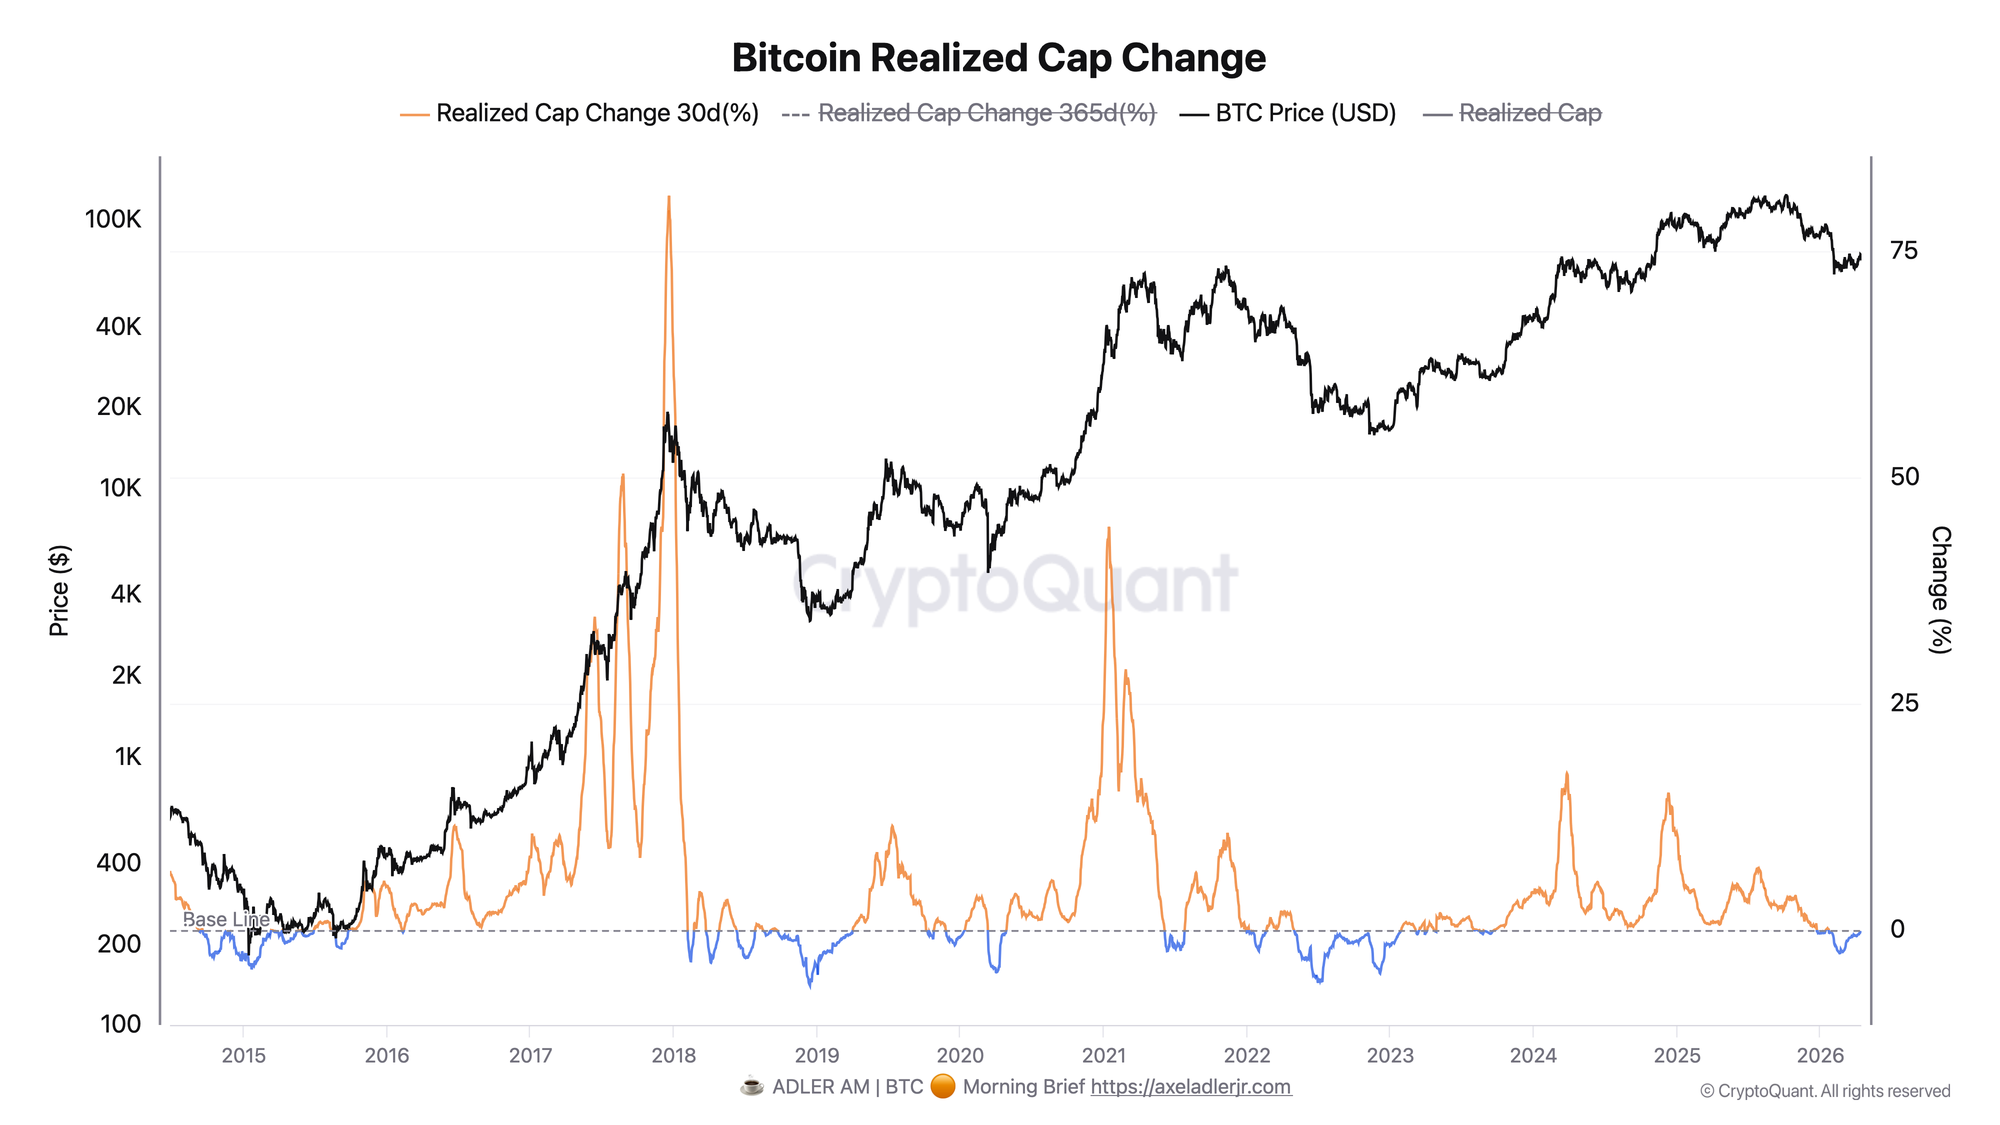
The 30-day Realized Cap change reflects the net movement of capital into the network over the past month: negative values mean that coins are being settled on average below their acquisition price, or that capital is physically leaving the network.
Out of 105 days since the start of 2026, only 7 showed a positive 30-day Realized Cap change - and all of them are concentrated in the short window of January 16-22. Since January 23, the metric has been continuously negative. The outflow extreme was recorded on February 20 (-2.58%), after which pressure partially eased: the current value is -0.32%. Realized Cap over the period from January 1 has declined from $1,120.8B to $1,084.7B - an absolute drop of -3.23% over the quarter. The BTC price currently stands at $74,819, significantly below January's opening levels.
At the same time, over the past two weeks (April 10-15) the 30-day change has been showing a gradual recovery from the extremes seen at the start of April (-0.54% on April 6 vs. -0.32% now) - the outflow is slowing, but a reversal has not yet occurred. This is the first signal worth watching.
Both indicators paint the same picture: since mid-January, capital has been systematically leaving the network without meeting compensating demand. The modest improvement in the 30-day change in April is consistent with the growth delta trading above its SMA - both charts are sending the same signal: the outflow is slowing, but has not yet reversed. This is the key observation today.
Bitcoin does not reward noise. DECISION TERMINAL gives you AI-powered market context, cycle phase, and execution quality in one place - so you can judge conditions before you act. Enter Terminal.
FAQ
What does "Realized Cap declined by 3.23%" mean? Isn't this simply a reflection of the price drop? No, this is a qualitatively different signal. Realized Cap only changes when coins move on-chain and record a new cost basis. A decline in Realized Cap means holders were selling coins below their acquisition price or withdrawing capital from the network - this is not an echo of a price correction, but direct evidence of capitulation and real money leaving the system.
What needs to happen for the regime to shift to bullish? A sustained reversal of both indicators is required: the 30-day Realized Cap change must move into sustained positive territory (not just for 2-3 days, as in January, but for 1-2 weeks), and the 365DMA growth delta must break through the zero line from below and hold there. Both events need to coincide with price appreciation above key STH cost basis levels.
CONCLUSIONS
Since the start of 2026, both structural capital indicators - Growth Rate 365DMA and Realized Cap Change 30D - have been recording the same reality: the network is losing capital, not accumulating it. Over 105 days, only 7 showed positive inflows, and those were quickly absorbed. The current regime is defensive, risk-off. The only encouraging signal of April is the slowdown in outflow: the 30-day change is recovering from the February extreme (-2.58%), and the growth delta is trading above its SMA. This is a slowdown, not a reversal. The main trigger for reconsidering positioning is a sustained move of Realized Cap Change into positive territory and a break of the delta through the zero line. The main risk is a new wave of capitulation if price returns to early April levels and selling pressure accelerates again.
Further Reading
Core topic
- Bitcoin Realized Price Bands Explained: Cycle Analysis, Signals, and Historical Examples
- Bitcoin MVRV Ratio: Definition, Formula & Cycle Signals
- Bitcoin LTH vs STH: Supply Dynamics, Cost Basis & Market Structure
- Bitcoin STH Realized Price: Definition, Formula & Cost Basis Framework
Go deeper