
🎧 Morning Brief #148 - audio debate on today’s market setup
After the February decline, BTC has rebounded, and the market looks better at the structure level than at the level of internal network profitability. The first chart shows bullish components returning above the baseline, the second shows that P/L sentiment has still not exited the negative zone - so this is a recovery, not a fully confirmed bull regime.
TL;DR
BTC structure has improved noticeably: bullish components of the Bull-Bear Structure Index are active again, and bearish signals have faded. But the P/L Block Dashboard is still holding in negative territory. This is not a confirmed bullish impulse - it is a recovery phase with persistent internal weakness.
Bitcoin Bull-Bear Structure Index
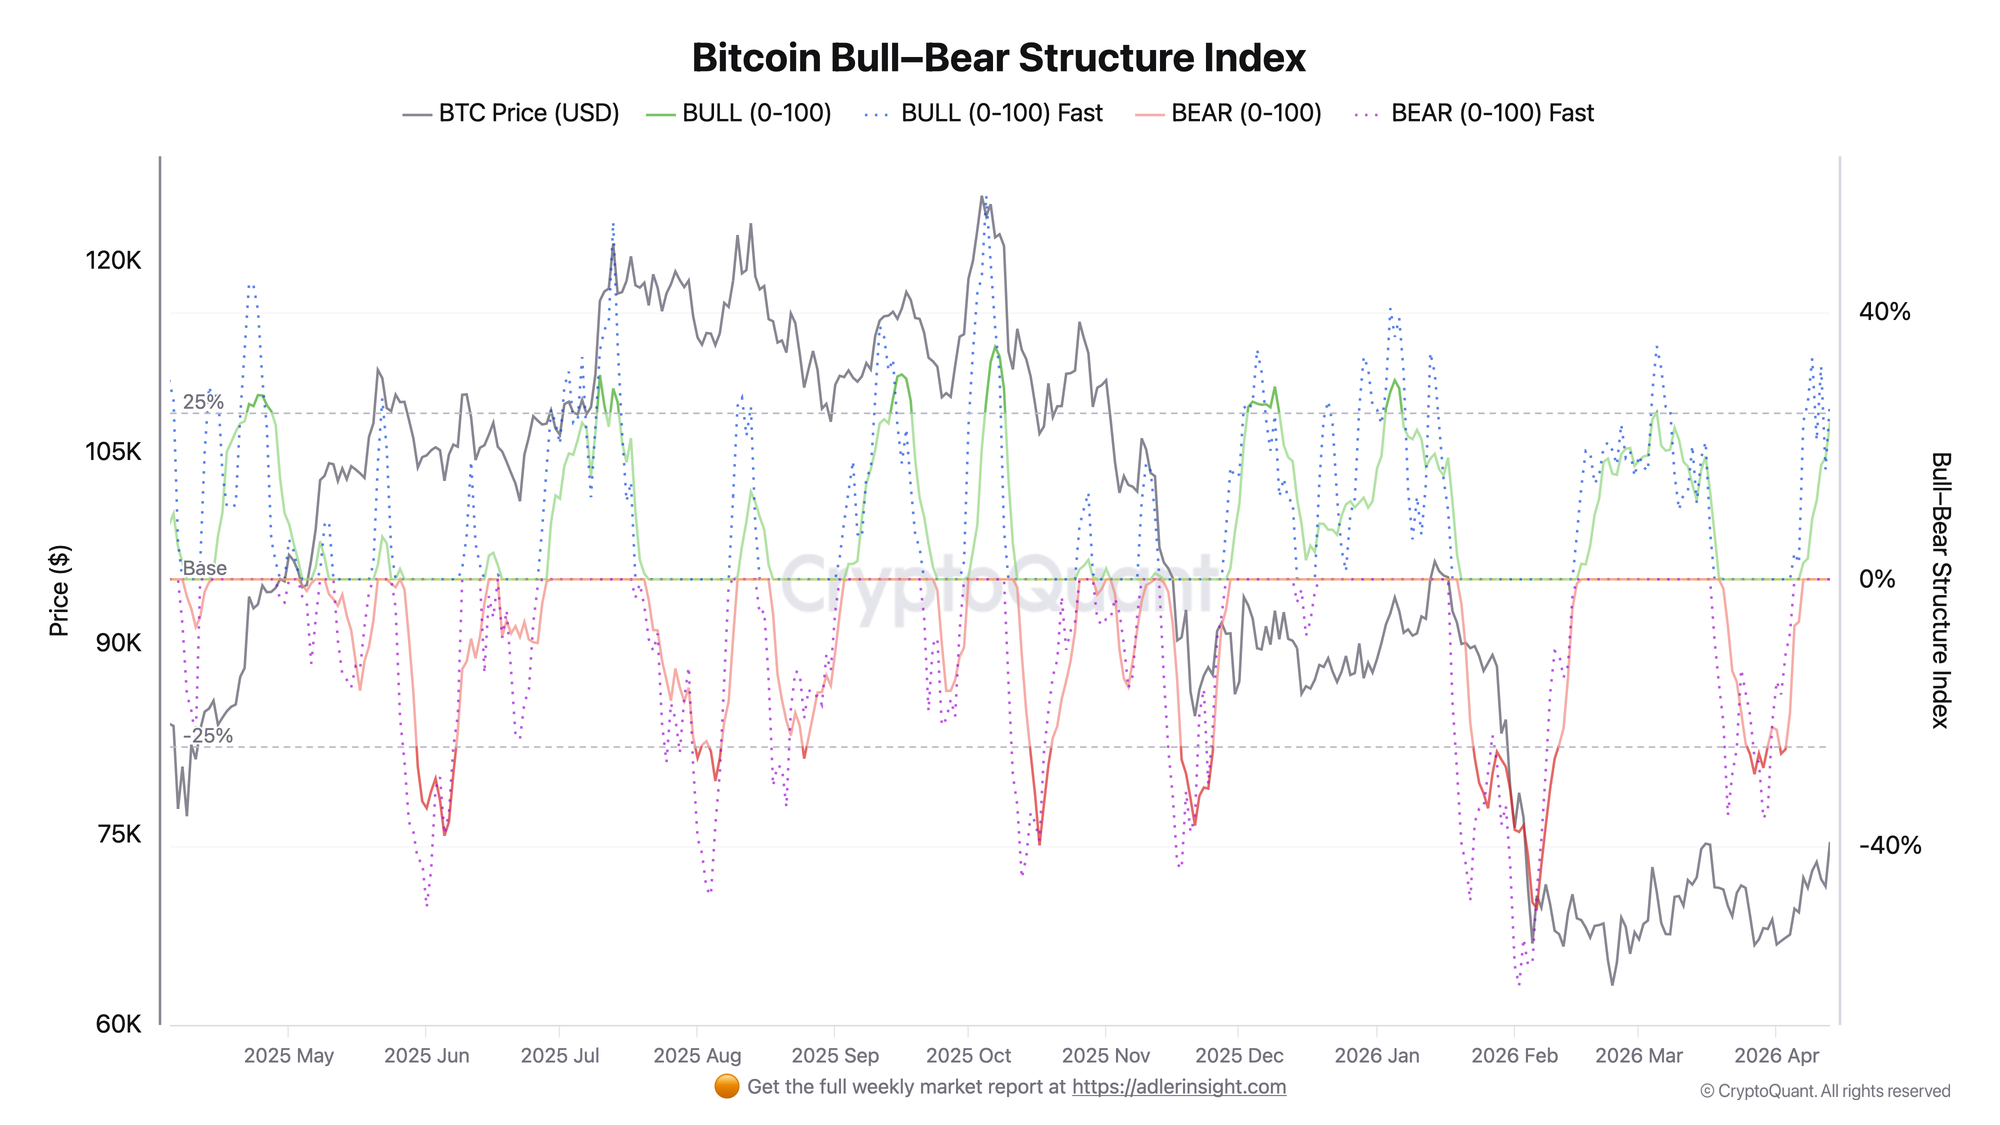
On the most recent segment, the bullish lines have risen back above the zero baseline, while the bearish components have faded noticeably compared to the February decline phase. Fast components continue to move sharper and more volatile than the slow lines, but right now what matters is not the speed - it is the fact itself: the bearish contour has stopped dominating. Price is recovering from its local low, and the market is returning to a phase of structural improvement.
This is an important regime shift. But on its own it does not yet mean final confirmation of a new sustained impulse: fast components traditionally react earlier and more aggressively, while slow lines provide more reliable confirmation.
For this shift to be considered fully bullish, the bullish components need not just to bounce from the baseline - they need to hold above it. If the bullish lines quickly slide back toward zero again, the current signal will remain only a recovery within a regime that has not yet fully formed.
Bitcoin P/L Block Dashboard

The metric compares BTC price against the aggregated P/L sentiment across network blocks.
Price has risen from the February lows, but the P/L signal itself on the most recent segment is still holding below the zero line. This means that the external improvement in price is not yet accompanied by an equally strong recovery in internal network profitability. In other words, the market has rebounded, but the internal network environment does not yet look genuinely strong.
For a regime change here, P/L sentiment needs to return to the neutral zone and close above it. Until that happens, any price increase remains vulnerable to losing momentum again.
The connection between these two charts: market structure has improved, but internal confirmation is still lagging. The key question today is not the rebound in price itself - it is whether the improvement in the Bull-Bear Structure Index can receive confirmation from P/L sentiment.
Bitcoin does not reward noise. Adler Terminal gives you AI-powered market context, cycle phase, and execution quality in one place - so you can judge conditions before you act. Enter Terminal.
FAQ
Why does a price recovery alone not yet signal a new bull regime? Because price has already rebounded, while P/L sentiment is still below zero. This means some internal weakness in the network persists, and the market currently looks stronger by structure than by the actual profitability of participants.
What would be a more reliable confirmation of a regime change? The clearest signal is bullish components holding above the baseline at the same time as P/L sentiment returns to the neutral zone. That is when the improvement in structure and internal network condition begin pointing in the same direction.
CONCLUSIONS
Both charts reflect the same regime: the market has exited the acute phase of weakness, but has not yet transitioned into a fully confirmed bull regime. The current assessment remains cautiously neutral - structure has already improved, but internal confirmation is still incomplete. The main trigger is bullish components holding above the baseline while P/L signal returns to the neutral zone; the main risk is a renewed decline in P/L sentiment and a rapid fading of the current structural rebound.
Further Reading
- Bitcoin Supply in Profit: Definition, Thresholds & Market Signals - how to read profitability thresholds and what regime shifts in supply-in-profit signal for market direction.
- Bitcoin NUPL (Net Unrealized Profit/Loss): What It Is and How to Use It - the aggregate unrealized P/L framework that contextualizes where the network stands relative to historical capitulation and recovery zones.
- Realized Profit vs Unrealized Profit: What's the Difference - the foundational distinction behind the P/L Block Dashboard metric covered in today's brief.
- Bitcoin STH Realized Price Definition, Formula & Cost Basis Framework - short-term holder cost basis as a key level to watch during the current structural recovery phase.