
🎧 Morning Brief #147 - audio debate on today’s market setup
Bitcoin is trading right at the average purchase price of BTC held in US ETFs - $74,232. This is a key test for the ETF cohort: after a period of trading below this level, the market is attempting to return to the break-even zone for this segment of holders. Short-term holders remain at a notable loss, while long-term holders retain a substantial profit buffer.
TL;DR
BTC has approached the ETF Cost Basis at $74,232. This means the aggregate ETF cohort is nearly back to break-even. But market structure remains subdued: the STH Cost Basis sits noticeably above current price, so pressure from short-term holders persists.
Bitcoin ETF Cost Basis (Realized Price)
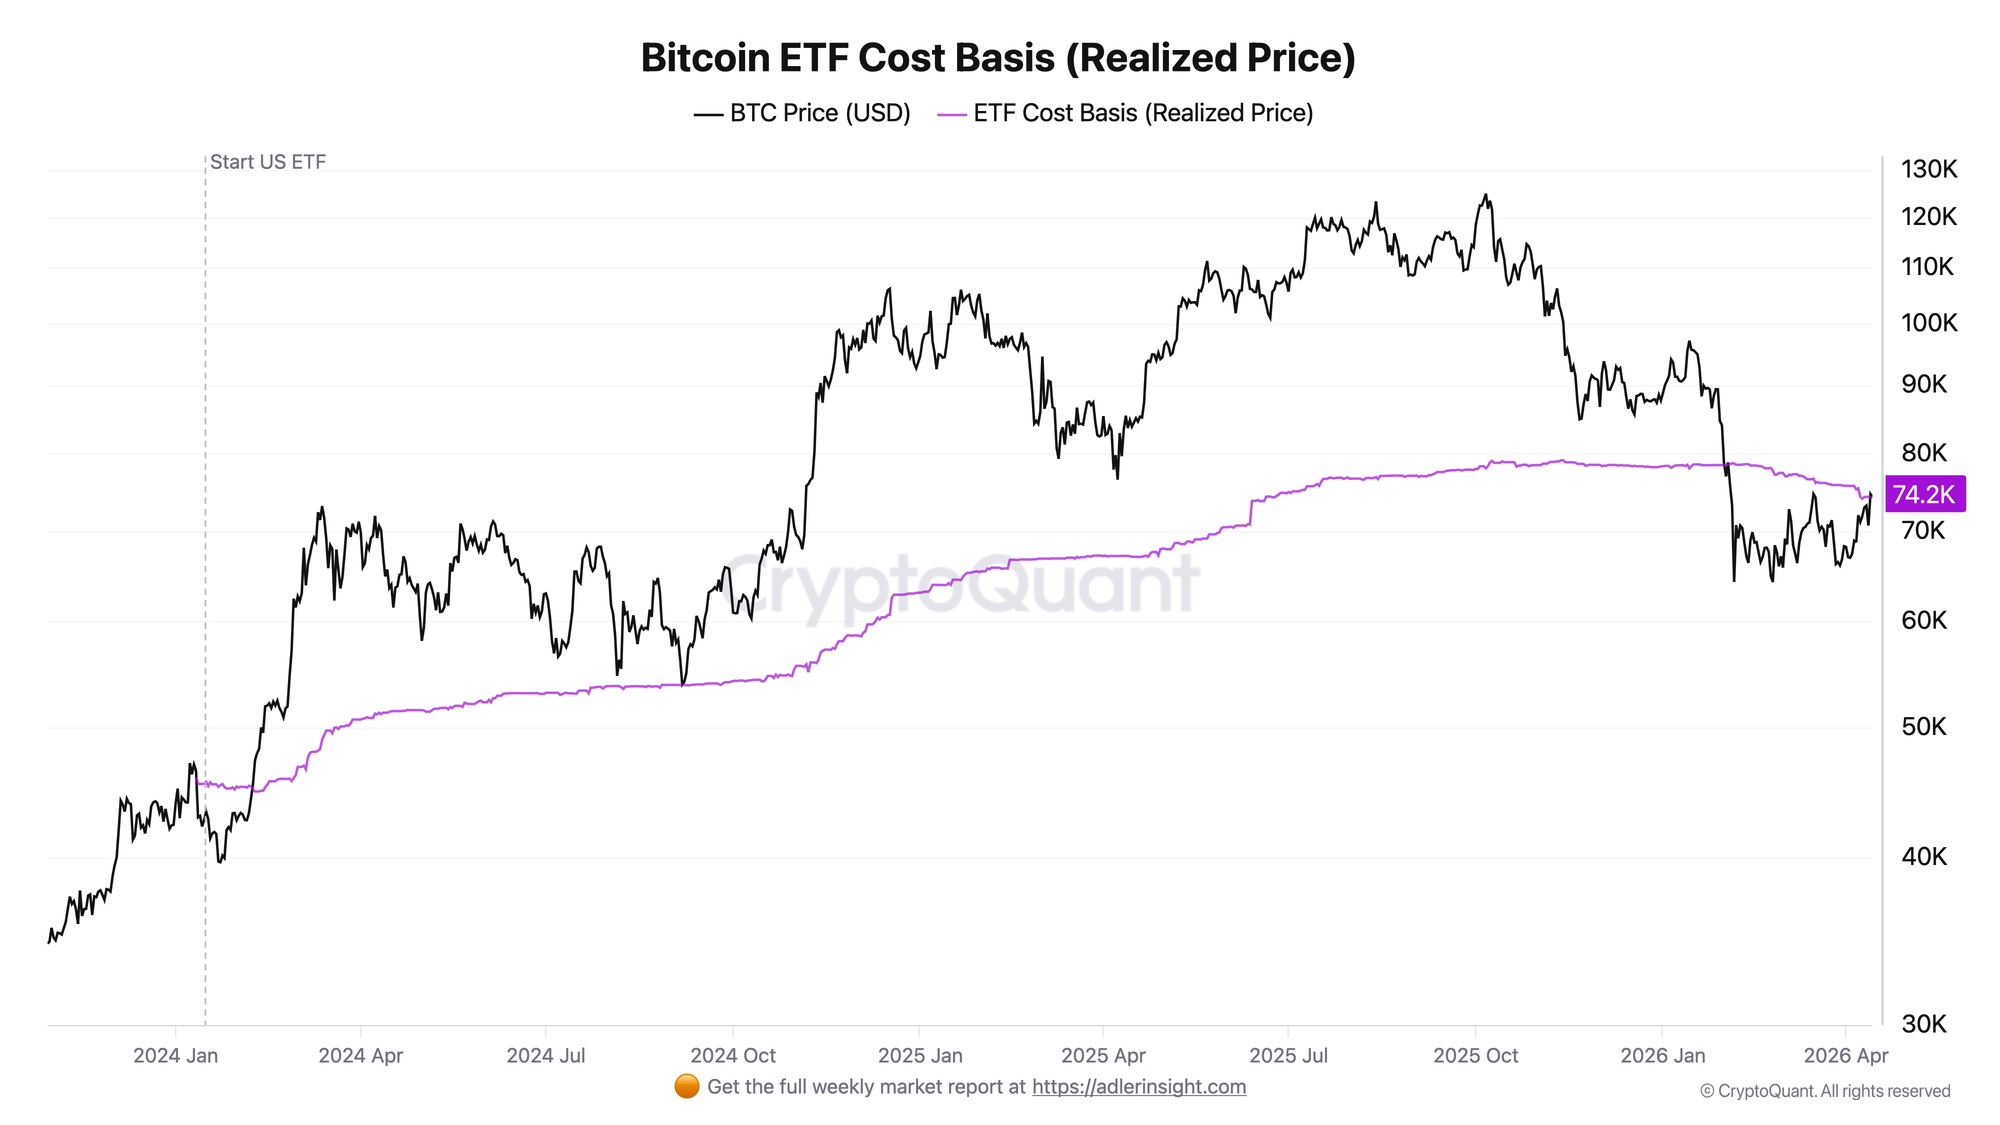
Over recent weeks BTC has been trading below the ETF Cost Basis, which held in a range of approximately $74,000-75,700. As of April 14, the ETF Realized Price stands at $74,232, while spot price is around $74,206. The gap between them has narrowed to less than $30, meaning the market is effectively testing this level from below.
For the ETF segment, this is an important threshold. A sustained return of price above $74,232 would signal a transition of the aggregate ETF cohort position from a loss to a neutral state. If BTC slides back below this level, pressure on this segment will remain.
Bitcoin Cost Basis: STH vs LTH
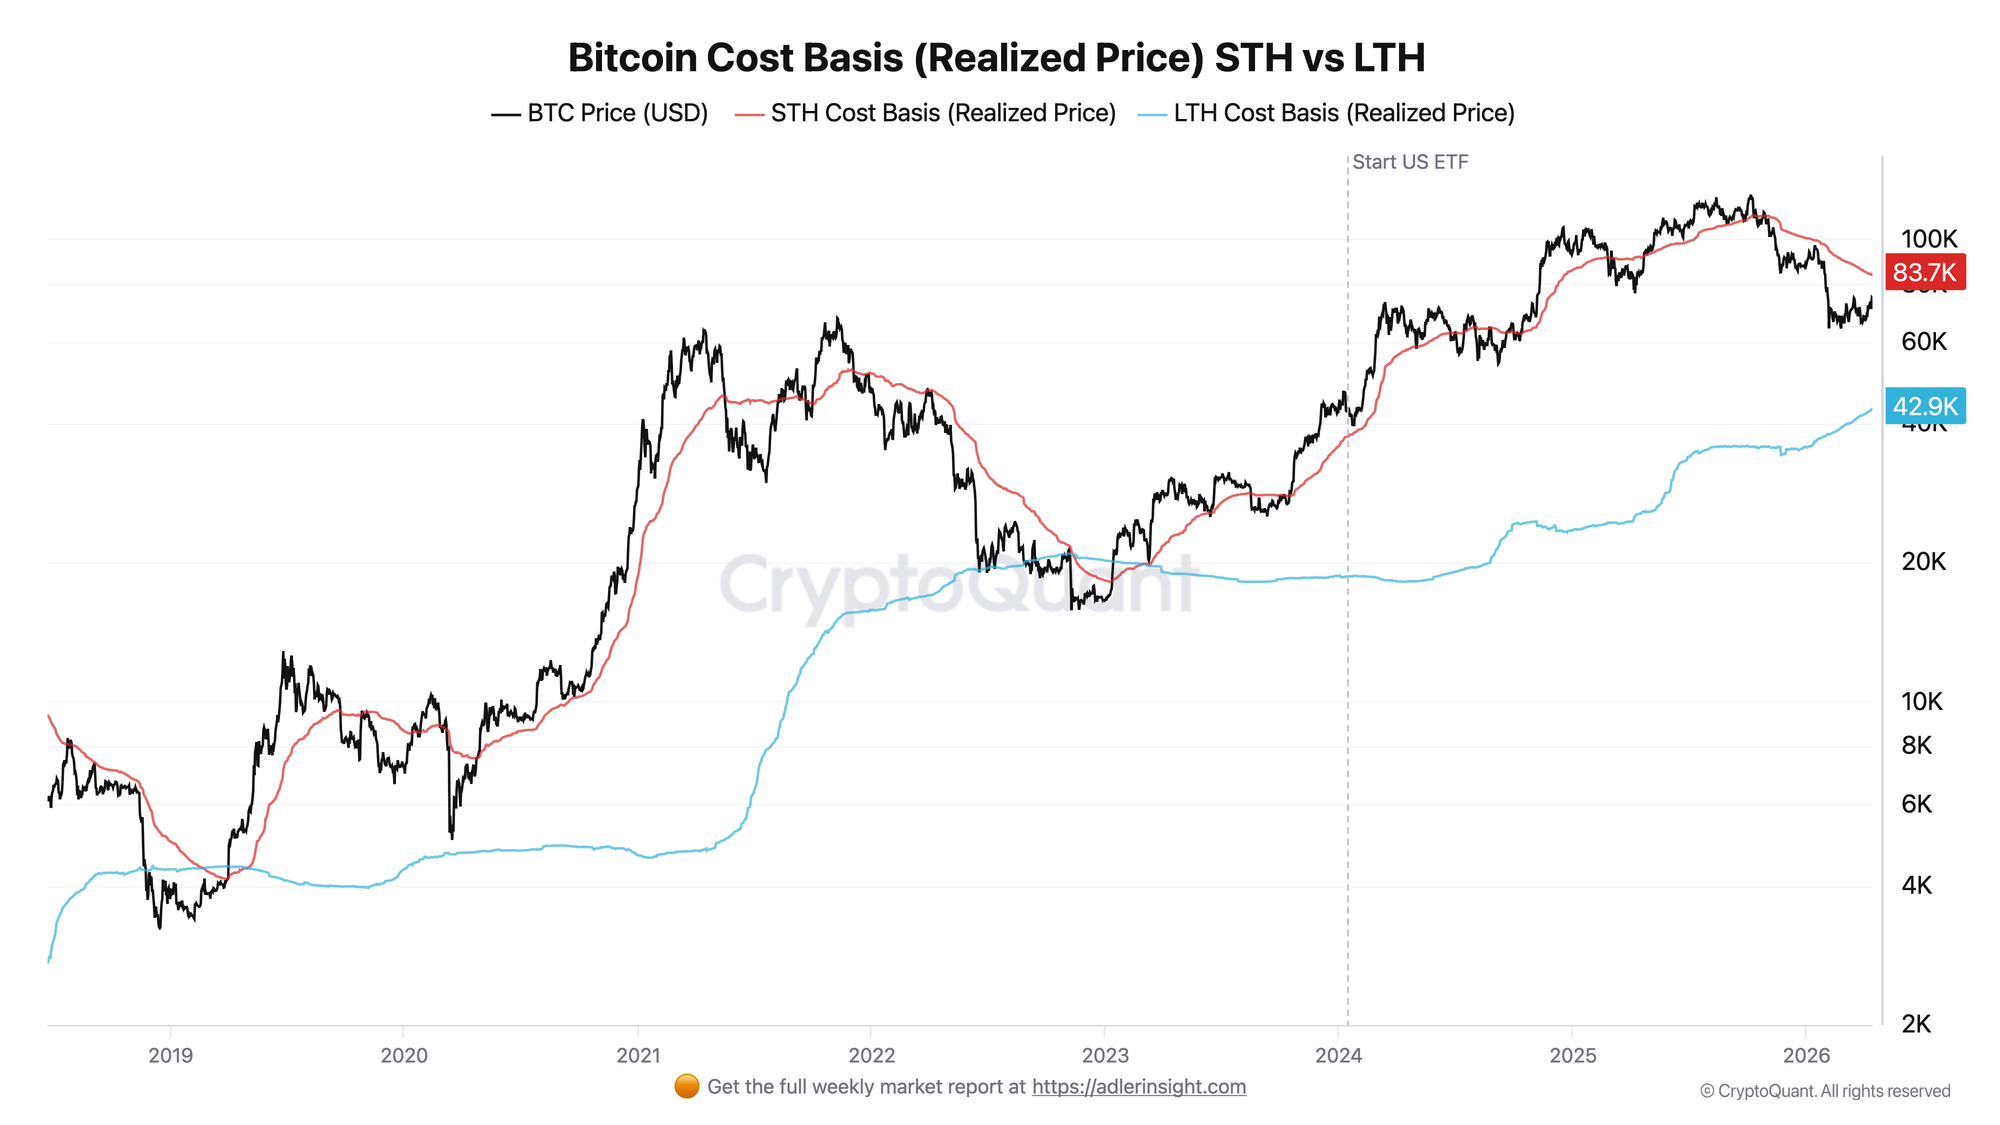
The current cost basis structure looks as follows:
- STH Cost Basis: ~$83,734
- LTH Cost Basis: ~$43,018
This means short-term holders remain approximately $9,500 below their average entry price, while long-term holders retain a profit buffer of around $31,000 per coin.
This configuration matters for reading market structure. The ETF segment sits at the equilibrium point, LTHs remain in a stable profit zone, and the primary tension is concentrated in the STH segment. As long as price stays below the STH Cost Basis, short-term supply remains a potential source of resistance on any recovery.
Both charts together show the following: the nearest structural threshold runs through the ETF Cost Basis at $74,232, and the higher pressure level sits at the STH Cost Basis around $83,734. In other words, the market is currently solving the first problem - bringing the ETF cohort back to break-even. But even if successful, the next layer of resistance will remain above.
Stop monitoring dozens of BTC charts - get one clear market verdict. ADLER Terminal compresses on-chain, derivatives, and macro data into a simple YES / CAUTION / NO, updated 4 times a day. Unlock access.
FAQ
What does the ETF Cost Basis test mean? The ETF Cost Basis is the average purchase price of BTC held in ETF products. When spot price is below this level, the aggregate ETF cohort is at a loss. When price returns to it, the market is testing whether this segment can be moved back into a neutral zone.
Has market structure already improved? Partially, but not fully. The ETF Cost Basis test is a step toward stabilization, but not a full confirmation of strength. For a more meaningful improvement, the market needs not only to hold above the ETF Cost Basis, but also to close the gap to the STH Cost Basis - which remains substantial for now.
Conclusions
BTC has approached the ETF Cost Basis at $74,232 - this is the nearest important level for assessing the condition of the ETF cohort. The market has nearly brought this segment to break-even, but pressure from short-term holders persists, as the STH Cost Basis remains significantly above current price. The current configuration is therefore best described not as a reversal, but as a test of resilience. Holding above the ETF Cost Basis will be the first sign of stabilization, while a return below it will signal that the structure remains weak.