
🎧 Morning Brief #130 - audio debate on today’s market setup
Two on-chain indicators show an important divergence: realized losses have reached extreme values, while supply activity continues to decline. PnL capitulation with frozen supply points to exhaustion of selling pressure, but does not yet confirm a full demand reversal on its own.
TL;DR
Realized losses have reached a cycle maximum, but active supply is not expanding - coins remain frozen. This divergence points to exhaustion of loss-realizing selling and signs of an accumulation phase. Final confirmation will only appear when Net Realized PnL recovers while supply activity remains low.
Bitcoin Net Realized Profit/Loss
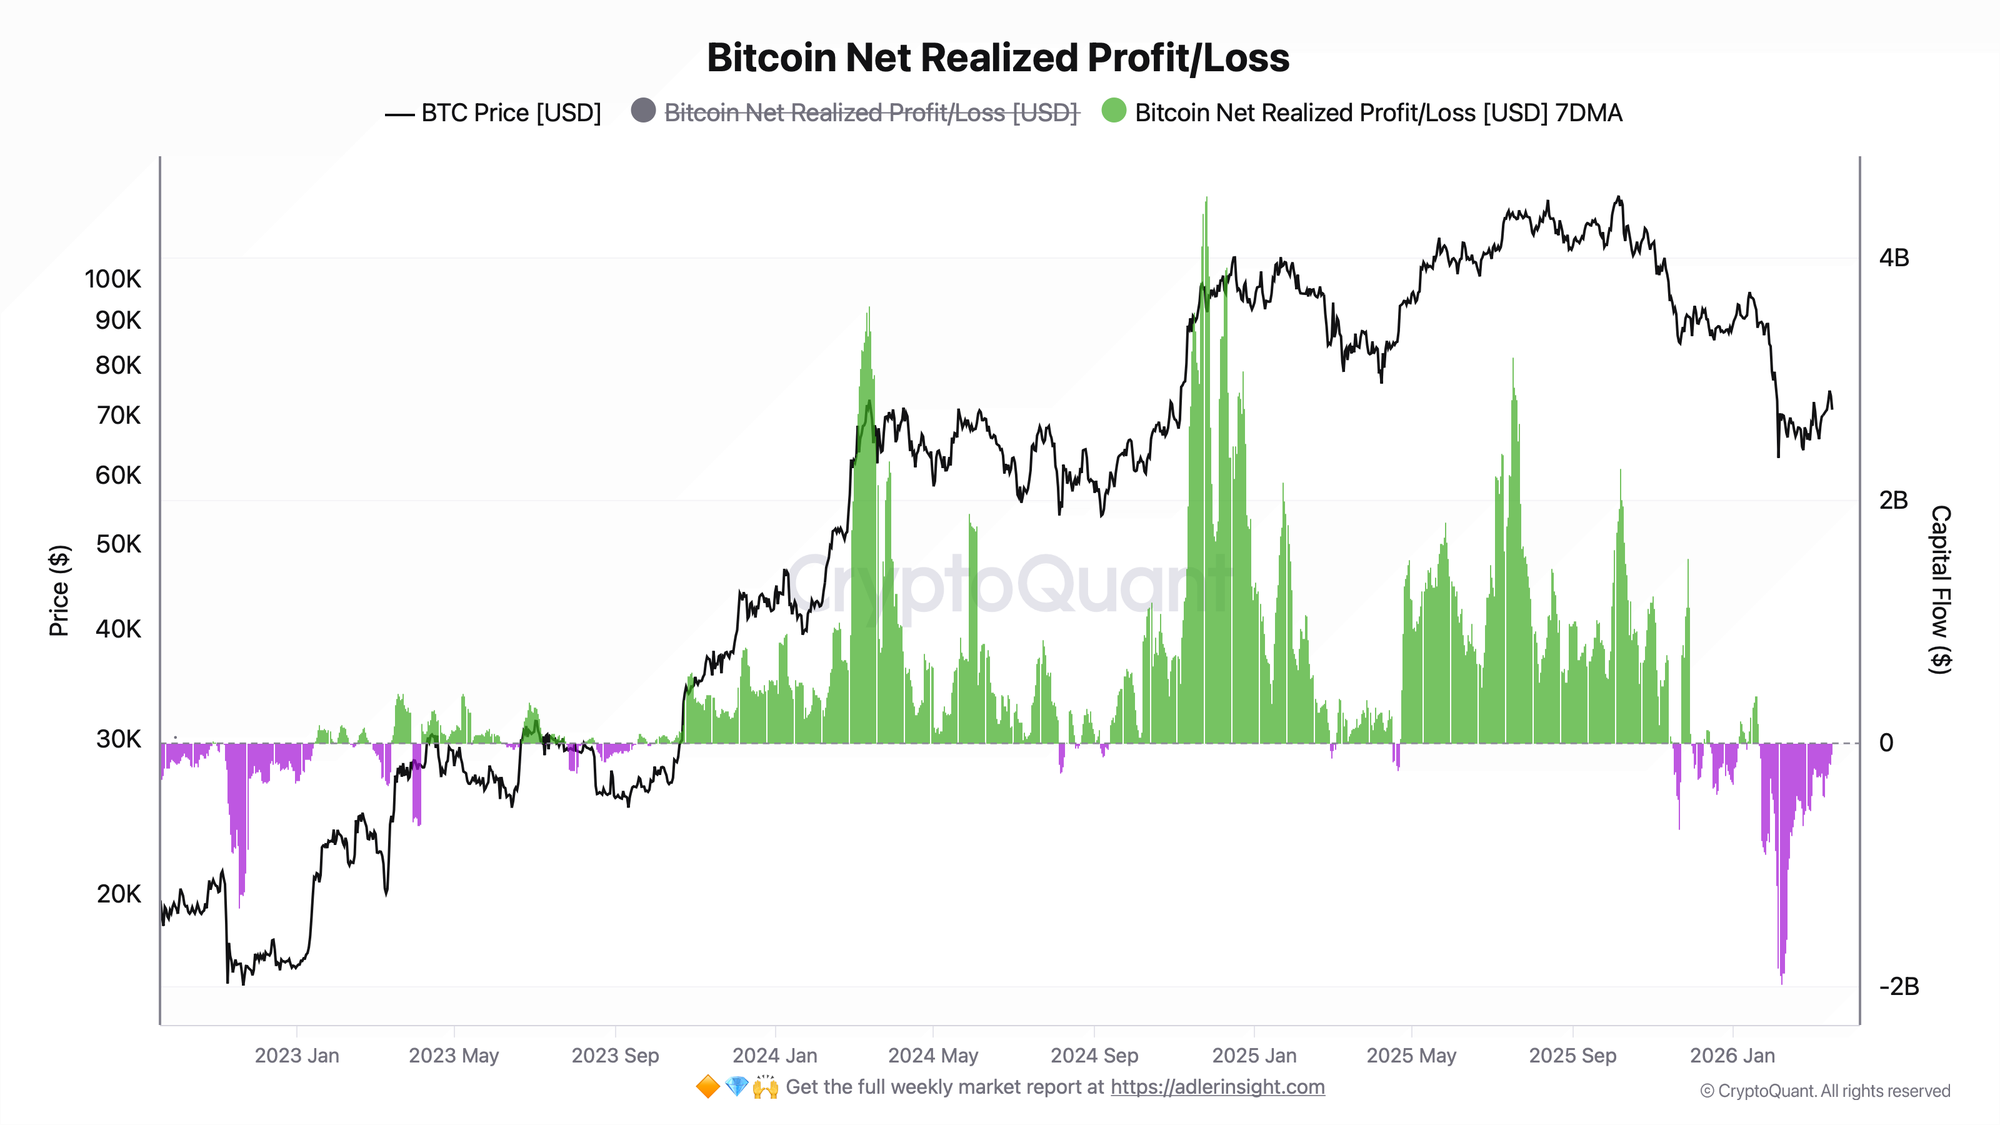
The metric measures the difference between total realized profit and total realized losses across all UTXOs per day: green bars - profit dominates, purple bars - losses dominate, smoothed by 7DMA.
From October 2023 through end of 2024, Bitcoin Net Realized Profit/Loss held steadily in positive territory - participants were locking in profit, which accompanied the rally from $30K to the peak of $125K. Starting in late 2025 the picture changed: purple loss bars began appearing more frequently and deeper, and in January-February 2026 the metric dropped to values around -$2B - levels not seen since the 2022-2023 bear market. Currently the 7DMA remains near zero or slightly in negative territory.
Dominance of realized losses of this magnitude at prices in the $65K-$75K range is a characteristic sign of capitulation pressure from weaker market participants. Historically, such extremes in realized losses have accompanied phases of intense market stress and selling compression. However, this signal alone does not mean an immediate reversal. Confirmation of a regime change will be a return of the 7DMA to a sustained green zone - similar to what happened in September-October 2023 before the start of the main upward impulse.
Bitcoin Supply Active, 30D Change
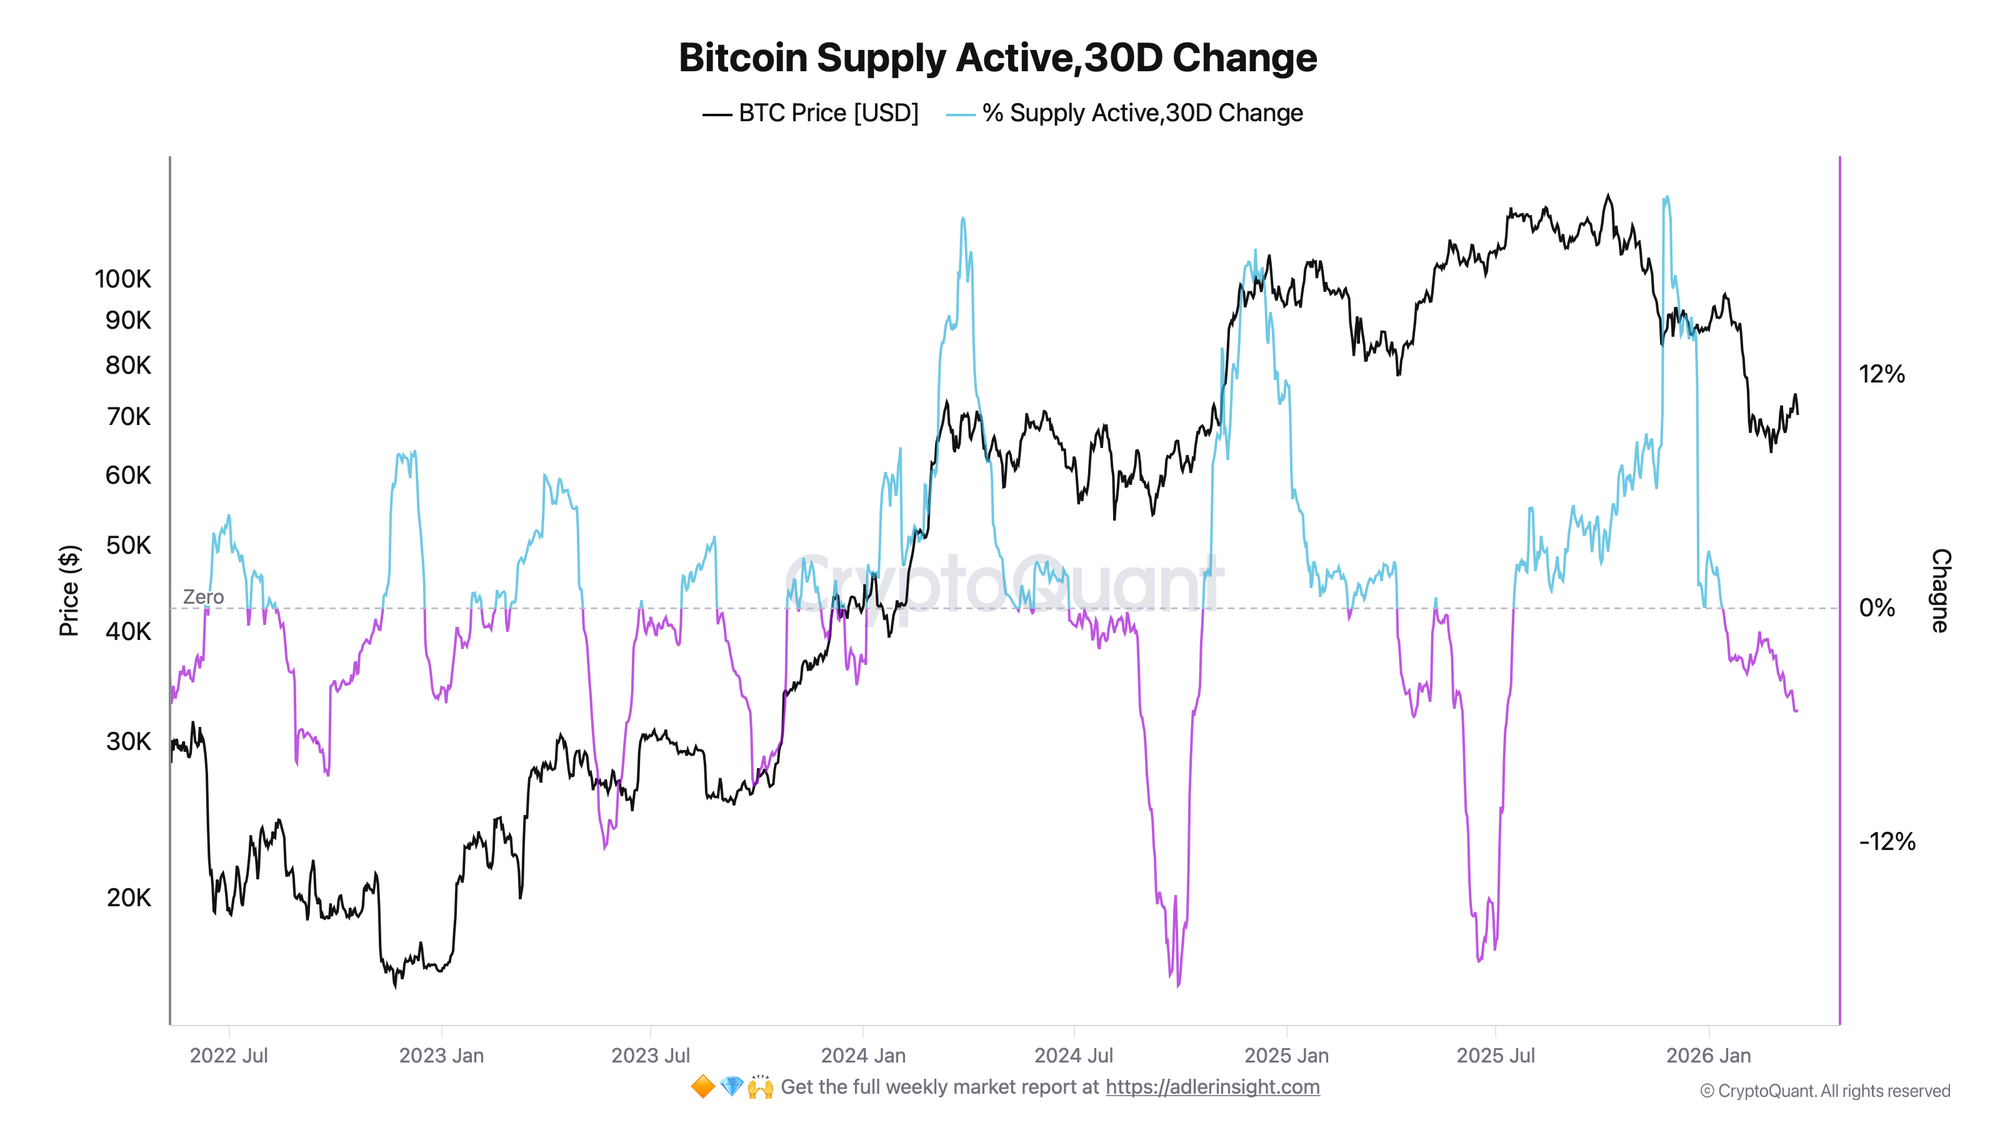
The metric shows the 30-day change in the share of coins aged under 6 months relative to total supply: a rise above zero means an increase in the share of recently moved coins, a decline means their freeze and UTXO "aging."
The chart shows that every significant bullish impulse was accompanied by a sharp spike in 30D Change upward, above +12%. Now the situation is reversed: the metric is declining and moving below the zero line. This means the share of "young" UTXOs is contracting - coins are moving less, and supply activity is compressing.
Declining supply activity alongside price stabilization is more characteristic of an absorption and accumulation phase, although it does not yet confirm a full demand reversal on its own. The main risk remains a scenario where Supply Active accelerates sharply without confirmation from Bitcoin Net Realized Profit/Loss. In that case the market may move not toward organic recovery, but toward distribution.
The link between the two charts points to a shift in market structure: Net Realized Profit/Loss is recording capitulation pressure - losses are at cycle highs and beginning to compress, but Supply Active does not respond with a corresponding supply expansion. Coins remain relatively immobile despite the stress, and this looks more like a phase of selling exhaustion.
Stop letting Bitcoin volatility make the decisions for you - start your 7-day free trial. Weekly Engine tells you when to hold, when to reduce risk, and when the market regime is breaking down. One clear action per week, built to protect capital before the next drawdown hits.
FAQ
What does dominance of realized losses with frozen supply mean?
When losses are being realized at extreme levels but Supply Active is not growing, it means capitulation pressure is present, but no broad expansion of active supply is visible. This configuration appears more often in selling compression phases, when some weaker participants exit the market while the more inert mass of holders remains passive.
Under what condition is the accumulation signal confirmed?
Confirmation will be a reversal of Net Realized Profit/Loss 7DMA back into positive territory while supply activity remains low. If Supply Active starts rising sharply before PnL recovers, that will be a signal that holders are using any bounce to sell - meaning the market is closer to distribution than to sustained accumulation.
CONCLUSIONS
Both indicators show the same structure from different sides: the market is going through a PnL capitulation phase but is not confirming it with an expansion of active supply. Net Realized PnL has moved into negative territory for the first time since the bear market, yet Supply Active 30D Change shows no sign of mass holder exit. This is not a signal of a ready reversal - it is a signal of selling exhaustion. The base regime remains cautiously neutral. A transition to risk-on requires a sustained return of Net Realized PnL 7DMA to the green zone while supply activity remains subdued. The main risk is an acceleration of Supply Active without PnL recovery, which would indicate the start of a new distribution wave.
Further Reading
Realized Profit vs Unrealized Profit: What's the Difference - the foundation for understanding what Net Realized PnL actually measures and why it matters for cycle analysis.
Bitcoin Supply in Profit: Definition, Thresholds & Market Signals - complements the Supply Active framework by showing how profitability distributes across the holder base.
Bitcoin LTH vs STH: Supply Dynamics, Cost Basis & Market Structure - essential context for interpreting UTXO age bands and the freeze of active supply discussed in this brief.
Bitcoin Dormancy Flow: Bottom Signals & Buy Zone Detection - a related on-chain metric that also captures coin inactivity and has historically confirmed accumulation phases.
Realized Price UTXO Age Bands: Definition & HODLer Signals - direct methodology behind the Supply Active metric used in this brief.