
🎧 Morning Brief #144 - audio debate on today’s market setup
A month ago, the market was under noticeable pressure in derivatives: the 30DMA of the Net Taker Volume oscillator had moved below zero, while the liquidation structure pointed to increased vulnerability in long positions. Now both indicators look calmer: Net Taker Volume has returned to positive territory, and the 30DMA of liquidations dominance has fallen to low levels. This points to an easing of the previous pressure, but by itself it still does not prove a sustained market reversal.
TL;DR
The Net Taker Volume Oscillator 30DMA is back above zero, indicating an improvement in the short-term balance of aggressive buying. At the same time, 30DMA Liquidations Dominance has declined to low levels compared with previous months, pointing to less overheating on the long side. Taken together, this is more a signal of structural stabilization than a confirmed bullish reversal.
Bitcoin Net Taker Volume Oscillator (30DMA)
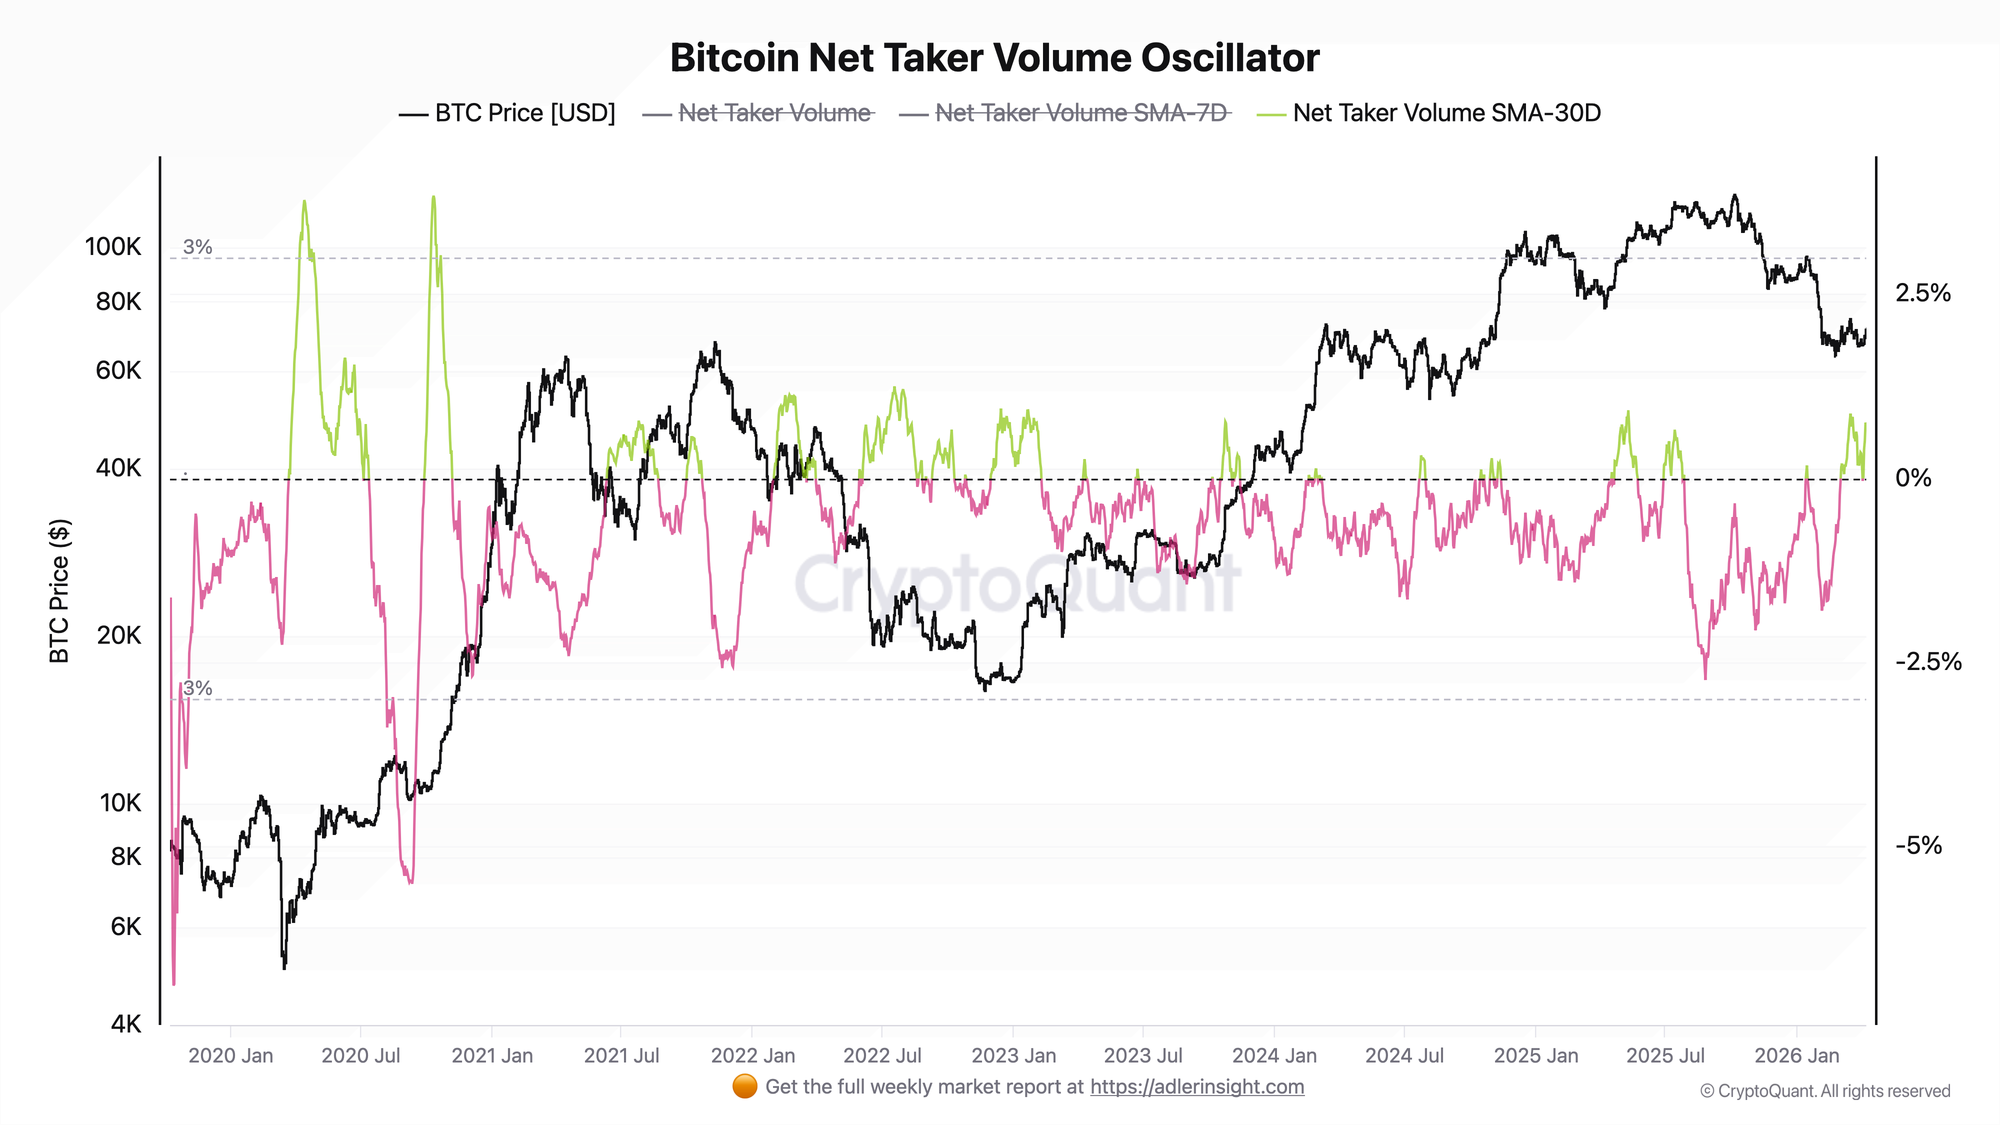
The metric reflects the ratio between aggressive bullish and bearish flow, while the 30DMA smooths out short-term fluctuations.
In February 2026, the 30DMA gradually moved deeper into negative territory, reaching around -1.6. This coincided with a phase of price decline from the ~$95K area to ~$63-65K and reflected sustained pressure from sellers. In March, the indicator began to recover and by March 17-18 had risen to roughly +0.87, which was accompanied by a price rebound. Then, in late March - early April, momentum weakened again: the indicator moved back toward zero and briefly dipped into mildly negative territory.
As of April 8, the 30DMA had recovered to +0.73. This shows that the short-term flow structure has become stronger than it was in early April. Even so, for a more confident conclusion, what matters is not the point itself but the persistence of positive readings in the coming sessions.
As long as the 30DMA remains above zero, aggressive selling pressure appears to have eased. A return of the indicator to negative territory would mean that the improvement in structure was temporary.
Bitcoin Futures Long/Short Liquidations Dominance (30DMA)
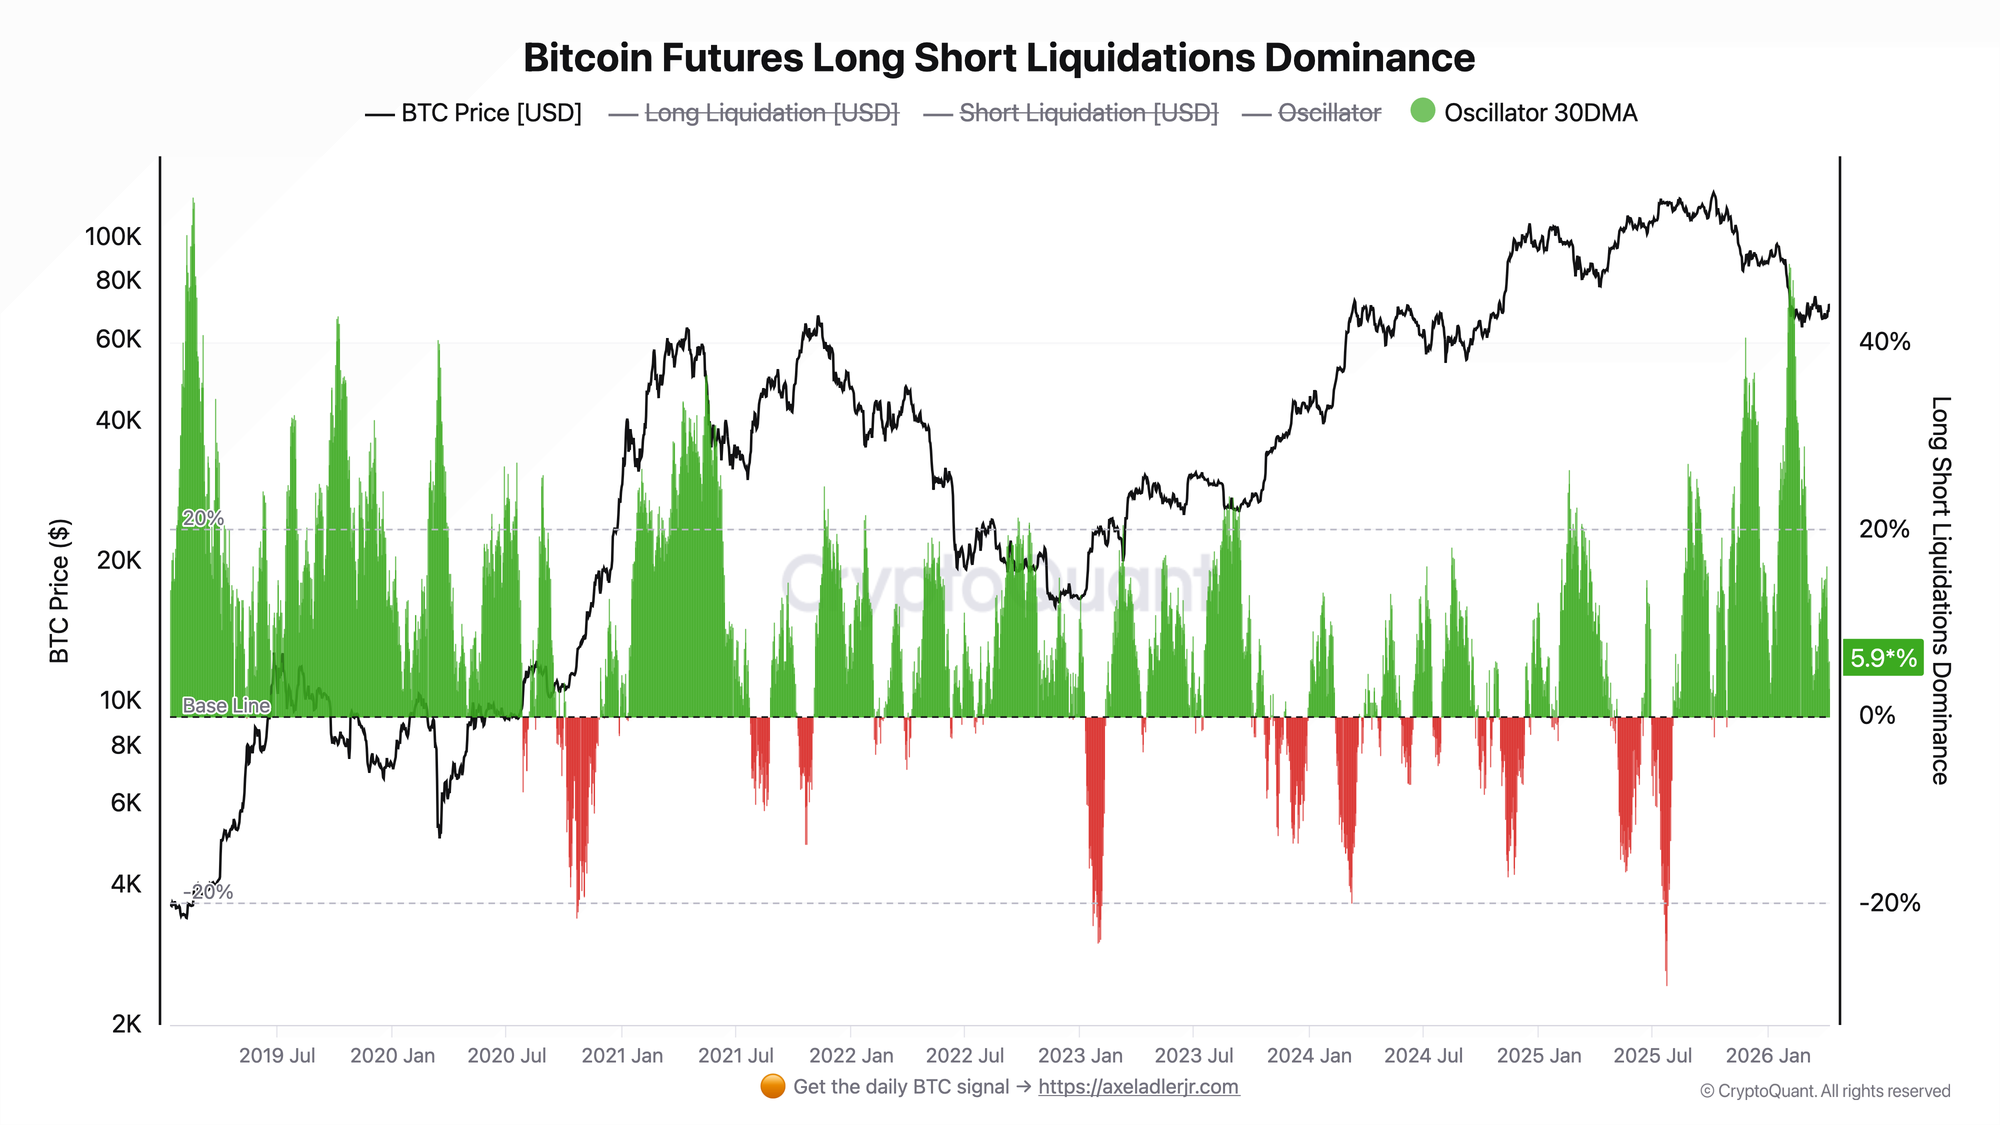
he oscillator reflects the balance between the volume of long and short liquidations in futures. Positive values indicate a predominance of long liquidations, while negative values indicate a predominance of short liquidations. The 30-day moving average makes it possible to assess the structural backdrop rather than isolated spikes.
In late January and throughout February, against the backdrop of falling prices, the 30DMA Liquidations Dominance rose above +40-48. This meant the market was going through a phase of active long washout. From March onward, the indicator began to decline and by mid-month had fallen to low levels. At the same time, there were isolated sessions in late March marked by pronounced short liquidations, but the 30DMA itself reacted only moderately, without a full regime shift.
In the first week of April, sharp one-day fluctuations were observed, yet the 30DMA itself remained near multi-month lows. This suggests that at the structural level, the market became less overloaded compared with the previous deleveraging phase.
A low 30DMA Liquidations Dominance reading is not a bullish signal by itself. It only shows that pressure from forced long liquidations has weakened. For that improvement to continue, confirmation from price and other flow metrics is still needed.
Both indicators are currently pointing to the same thing: the acute phase of pressure has eased, and the market structure looks more balanced than it did in February. But additional confirmation is still needed before calling it a full reversal.
FAQ
What does the return of the NTV Oscillator 30DMA to +0.73 after falling toward zero mean?
It means that over the past 30 days, the balance of aggressive trades has shifted back in favor of buyers. But this signal alone is not enough to treat the reversal as confirmed: what matters is whether the positive zone holds from here.
What does a low 30DMA Liquidations Dominance mean?
It means the market is no longer in the phase where longs are being systematically washed out as aggressively as before. In other words, the structural pressure through liquidations has eased. But that still does not automatically equal a transition to growth.
CONCLUSIONS
At this point, both indicators show improvement compared with the tense phase of February - early April. The Net Taker Volume Oscillator 30DMA is back above zero, while 30DMA Liquidations Dominance remains well below the extremes of the previous decline. This suggests that the market has become more balanced and that the earlier pressure from sellers and liquidations has eased.
The correct conclusion here is not "the reversal is confirmed," but rather "the structure has stopped deteriorating and has partially stabilized." For the interpretation to become stronger, the market still needs to show that positive NTV is holding and that there is no further expansion of pressure in liquidations dominance. If that does not happen, the current stabilization may turn out to be only a pause within a broader neutral-to-weak structure.
Further Reading
- Bitcoin Open Interest & Leverage Ratio
- Bitcoin Funding Rates: Definition, Formula & Cycle Signals
- Bitcoin Liquidation Cascade: How It Works, Why It Happens & How to Predict It
- Bitcoin Open Interest vs Price: 4 Divergence Patterns Every Trader Must Know
- Bitcoin Open Interest and Funding Rate: The Combined Framework for Reading Derivatives Markets
- Institutional Bitcoin Flows: ETF, Coinbase Premium & OTC