
🎧 Morning Brief #0097 - audio debate on today’s market setup
In October 2025, Bitcoin entered a bear cycle and is now experiencing a correction phase after local highs of $125K. Two on-chain indicators, Percent Unrealised Loss and LTH/STH SOPR Ratio, show mounting pressure on holders, yet capitulation signals remain absent.
TL;DR
Unrealised losses tripled since January, LTH/STH SOPR Ratio dropped 40% from peaks - market in mid-cycle stress phase, but no signs of mass capitulation.
Bitcoin Percent Unrealised Loss
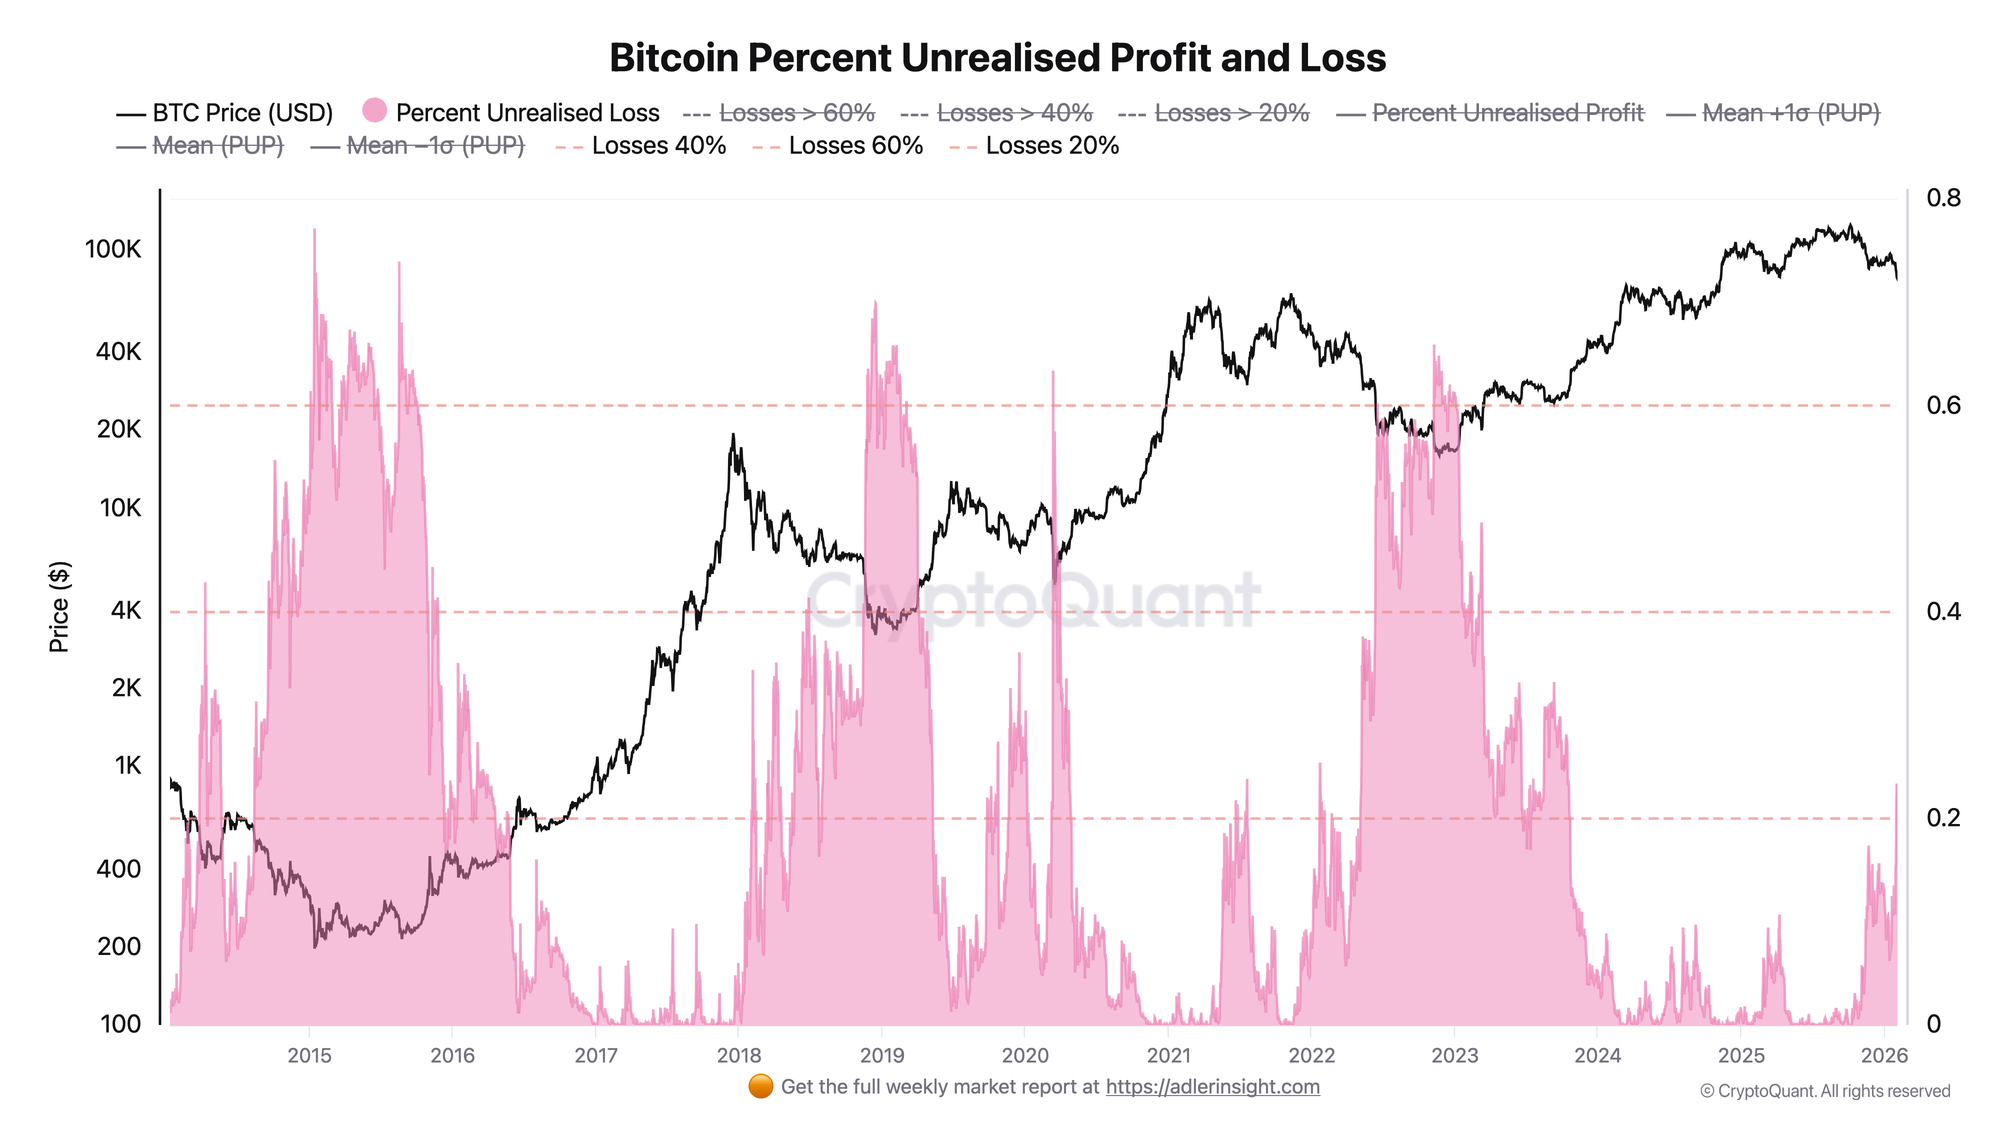
The metric reflects the percentage of BTC supply in unrealised loss - meaning the current price is below the acquisition price of these coins.
Unrealised loss grew from 7% in mid-January to the current 22%. This is a threefold increase amid the price drop from $95K to $78K. The value is approaching the 20% threshold, which historically separated moderate corrections from deeper drawdowns. Meanwhile, the metric remains significantly below the 40-60% levels typical of the 2019 and 2023 bear markets.
The current level signals growing discomfort among holders but does not reach capitulation zones. Deterioration trigger - a breach of the 30% unrealised loss threshold, which would require further price decline.
Bitcoin LTH/STH SOPR Ratio
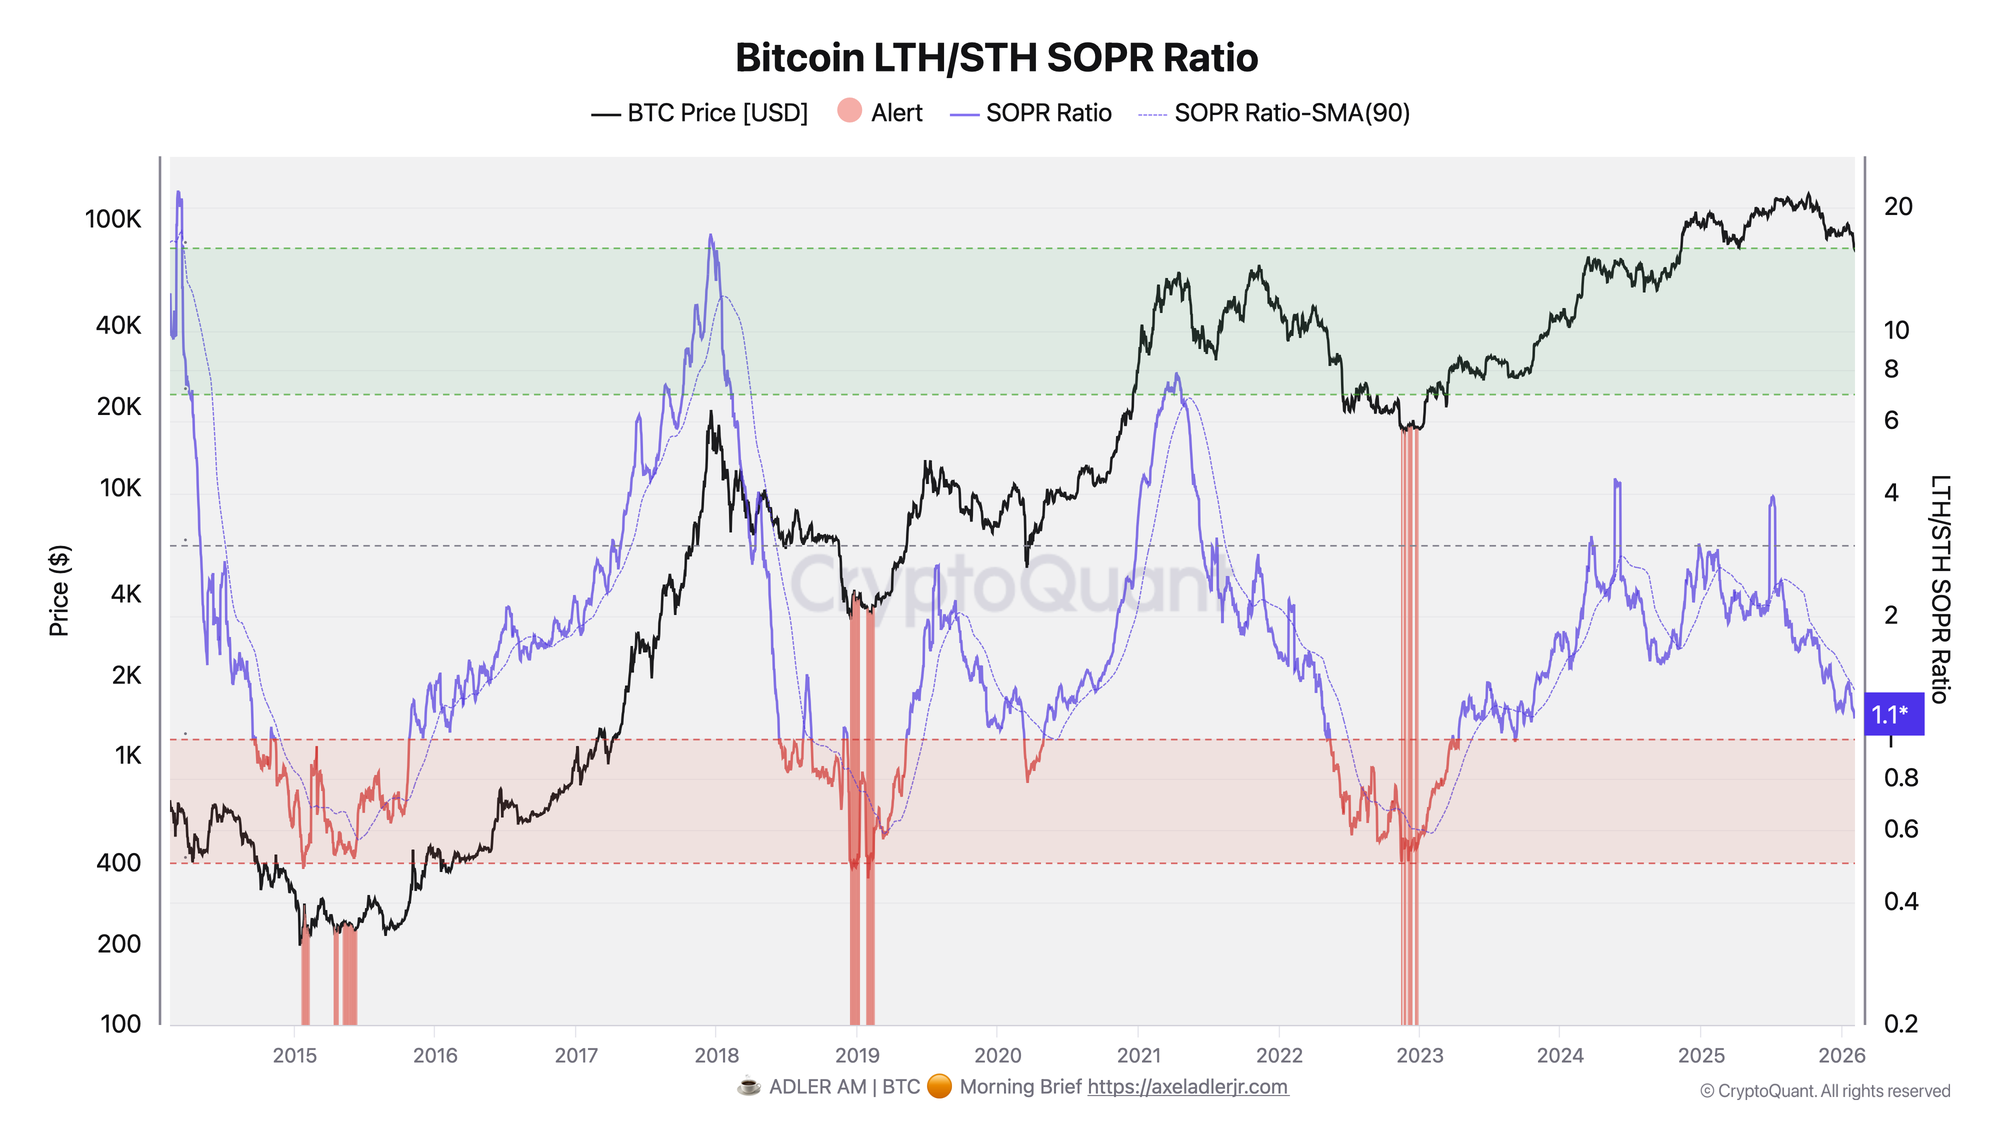
The metric shows the SOPR ratio of long-term holders (LTH) to short-term holders (STH). High values mean LTH are realizing profits significantly more successfully than STH, low values mean STH are selling at a loss.
SOPR Ratio declined from peak 1.85 in October to the current 1.13 - a drop of about 40%. However, the indicator remains above the critical 1.0 threshold, below which STH massively realize losses. The chart shows that historically, drops into the red zone below 0.6-0.8 coincided with full capitulation and market bottoms in 2015, 2019, and 2023.
The current value of 1.13 indicates profit compression for both cohorts, but LTH are still realizing positions in profit. Deterioration trigger - a drop below 1.0, which would signal STH entering full capitulation mode. A return above 1.3-1.4 would signal confidence recovery.
Both indicators show a mid-cycle stress phase: unrealised losses are rising, profitability is compressing, but the market has not reached extreme capitulation zones. This distinguishes the current correction from final phases of bear markets.
This brief is only part of the system.
Full access to the Biticon strategy and Deep Research is available in the 7-day trial.
FAQ
Why is the 1.0 threshold important for SOPR Ratio?
When LTH/STH SOPR Ratio falls below 1.0, it means short-term holders are on average selling at greater losses than long-term holders. Historically, such periods coincided with zones of maximum fear and preceded reversals. The current value of 1.13 shows pressure, but not capitulation.
At what level of unrealised losses should risk stance change?
Percent Unrealised Loss rising above 30% has historically been accompanied by accelerated selling and additional price pressure. The current 22% is a discomfort zone, but not panic. A drop back to 15% without a new price low would be a constructive signal.
CONCLUSIONS
The market is in a corrective stress phase: unrealised losses have tripled from January lows, and LTH/STH SOPR Ratio has lost 40% from October peaks. Yet both indicators remain above critical capitulation thresholds - Unrealised Loss does not reach 30%+, LTH/STH SOPR Ratio holds above 1.0. Main deterioration trigger - LTH/STH SOPR Ratio breach below 1.0 combined with unrealised losses rising above 30%.