
🎧 Morning Brief #138- audio debate on today’s market setup
Bitcoin ownership structure confirms dolphin dominance (100-1K BTC) with a 25.91% share - the largest block across all cohorts. Spending activity remains above the short-term trend: the daily value of 532K transactions exceeds the SMA-30D at 473K, although price is trading notably below recent local highs.
TL;DR
Large and mid-size holders have concentrated over 68% of BTC supply, while the network shows no signs of fading. Ownership structure and spending activity together point to stable supply distribution without confirmation of a capitulation regime.
Bitcoin Total Balance Share and Number of Addresses by Address Cohort
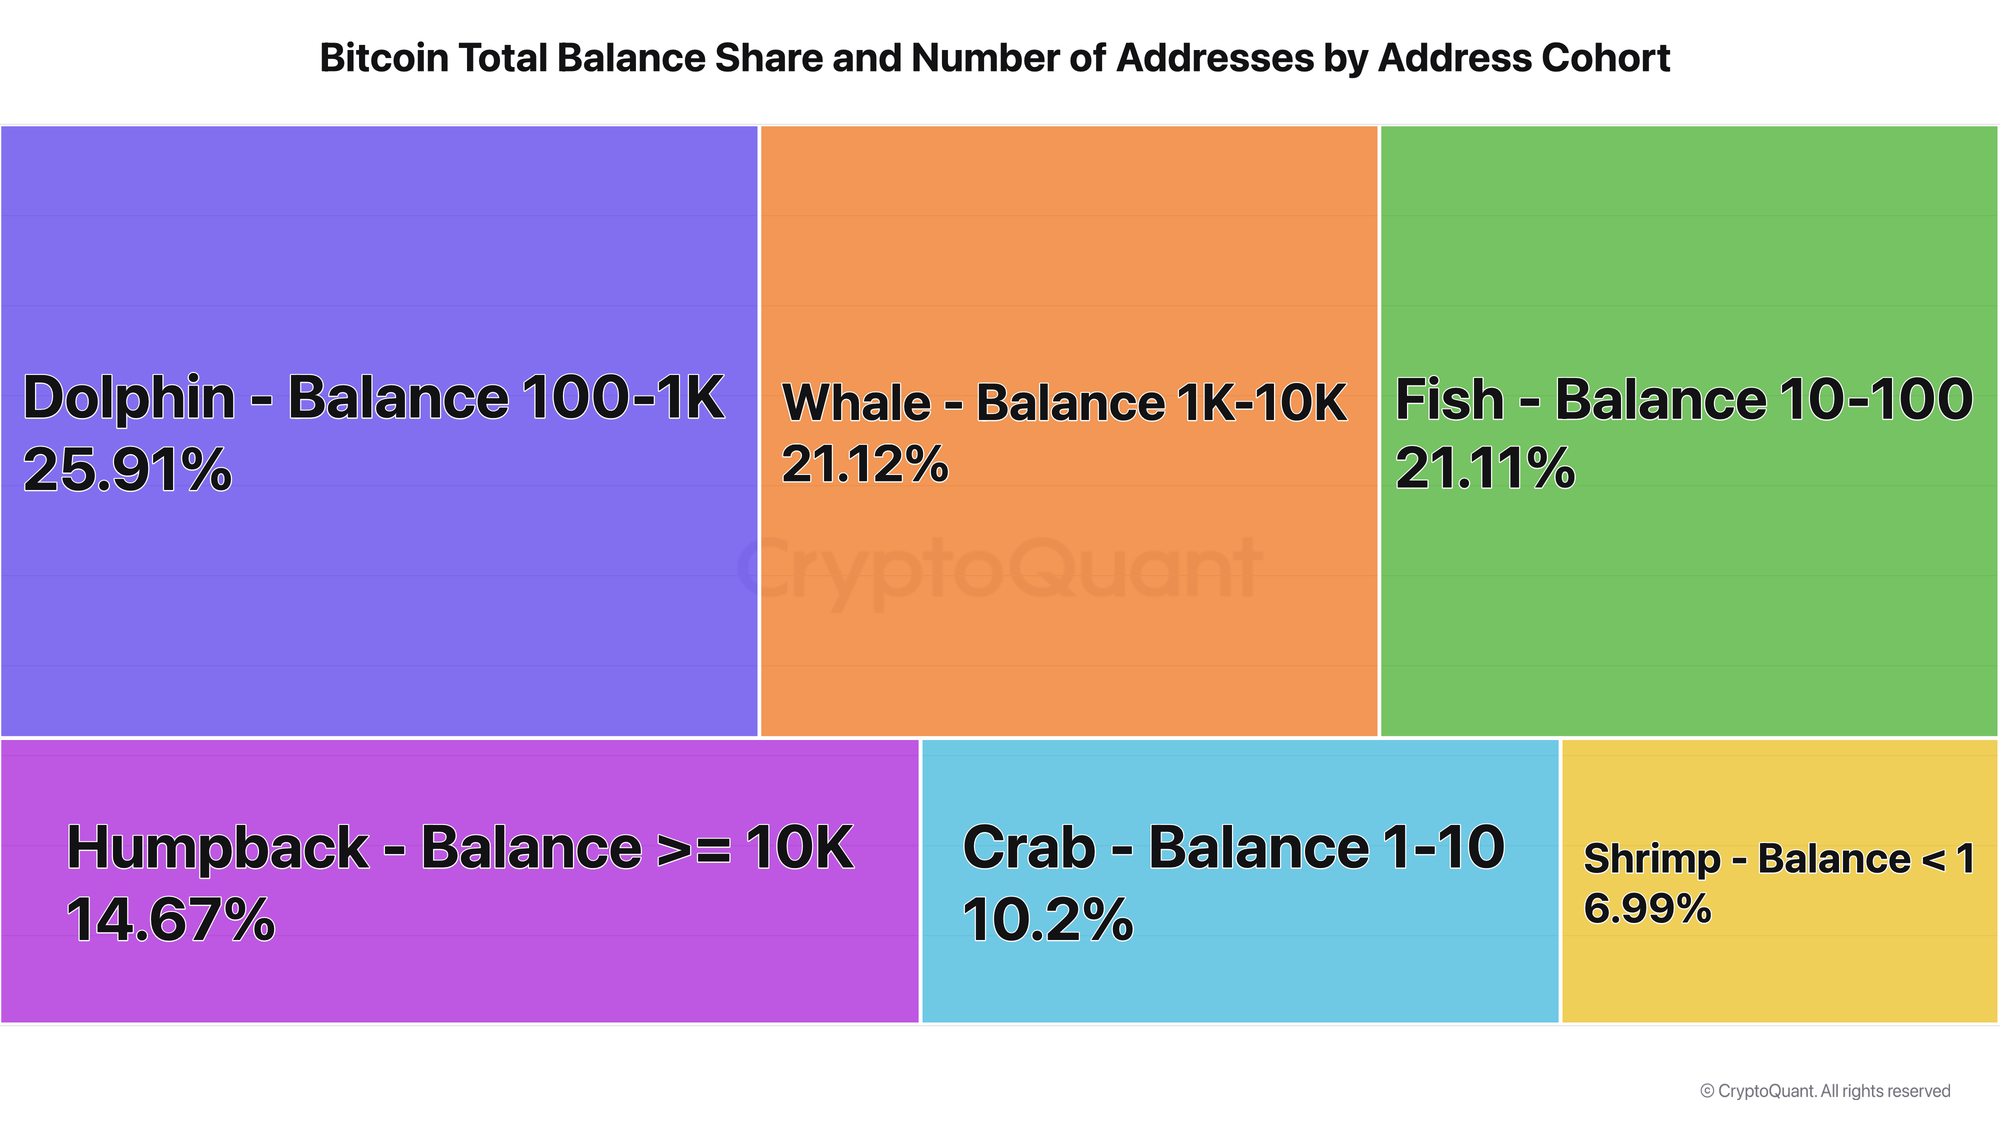
The ownership snapshot confirms: dolphins (100-1K BTC) control 25.91% of total supply - the largest block. Next come whales (1K-10K BTC) with a 21.12% share and fish (10-100 BTC) with nearly identical 21.11%. Humpbacks (>=10K BTC) - just 88 addresses - hold 14.67%. Small participants (crabs 1-10 BTC and shrimp <1 BTC) account for roughly 17% combined.
The top three cohorts collectively control over 68% of supply - indicating that the bulk of coins sits not with retail addresses but with larger holders. The trigger for a structural change will be growth in the share of smaller cohorts, which would signal broader supply redistribution down the address size scale.
Daily Distinct Spending Transactions
The chart reflects the number of unique spending transactions per day and their 30-day average - that is, how intensively network participants are moving already-accumulated coins. On fresh data, activity remains above the short-term trend: the daily value stands at 532,760 transactions versus SMA-30D at 473,452. Context matters: in mid-2025, SMA-30D dropped to around 341K - a zone of notably weaker network activity. Since then the metric has recovered approximately 38%, and current levels are far from those lows.
The network is running above its short-term average, even as BTC price trades notably below recent local highs. This means participants continue to actively move previously accumulated coins, and network usage is not collapsing alongside price. But this signal alone should not be read as unambiguously positive: with price weak, elevated spending activity may reflect not only network engagement but also ongoing supply redistribution. For the market, what would be more concerning is not a slowdown but a renewed acceleration in spending activity against a backdrop of weak price - if SMA-30D turns higher again while the correction continues, it would indicate intensifying coin redistribution and a rising probability of sell-side pressure.
The two charts together form a coherent picture: the bulk of supply remains with large and mid-size cohorts, while spending activity holds above trend despite the price decline. This does not confirm a network fading scenario, but it also does not allow current activity to be read as a purely bullish signal without caveats.
Buy and Hold works until the wrong 30% drawdown destroys your confidence. Weekly Engine helps you stay exposed when conditions are healthy and step aside when risk starts rising - so you can follow a process instead of guessing under pressure. Start 7 days free.
FAQ
Why does it matter that dolphins hold 25.91% rather than whales or small participants? Dolphins (100-1K BTC) are a large but not extreme cohort, and it is precisely this cohort that currently holds the largest share of supply. This matters because the center of gravity of the balance structure is shifted neither to the very top of the distribution nor to retail, but to a broad mid-to-large layer of addresses.
What would need to happen for the neutral-constructive signal to turn into a warning? A combination of two factors: SMA-30D of spending transactions begins to rise sustainably against a backdrop of continued price weakness, while the share of smaller cohorts in the balance structure increases. Such a combination would indicate intensifying supply redistribution and a rising probability of sell-side pressure.
CONCLUSIONS
Bitcoin ownership structure and spending activity together paint one picture: the bulk of supply remains concentrated among mid-size and large cohorts, while the network runs above its short-term trend - 532K transactions versus SMA-30D 473K. The regime is neutral with a moderately constructive bias, but without a purely bullish confirmation. The key trigger for scenario deterioration is a renewed SMA-30D acceleration against weak price combined with simultaneous growth in the share of smaller cohorts. The key risk is a transition from stable network activity toward more explicit supply redistribution into the market.
Further Reading
- Coin Days Destroyed (CDD) & Liveliness: Definition, Formula & Cycle Signals - the closest conceptual pair to spending activity: how long coins sit idle before moving
- Realized Price UTXO Age Bands: Definition & HODLer Signals - how UTXO movement maps to holder behavior across cohorts
- Bitcoin LTH vs STH: Supply Dynamics, Cost Basis & Market Structure - supply distribution between long- and short-term holders, direct context for cohort analysis
- Bitcoin Exchange Reserve: Definition, Formula & Cycle Signals - whether coins moving in the network are heading to exchanges or staying off them