
🎧 Morning Brief #128 - audio debate on today’s market setup
Since the October highs, both key on-chain indicators are signaling a clear regime change. The MVRV Z-Score has lost 74% from its peak, and aSOPR has been below 1.0 for 55 consecutive days - realized losses remain the norm, not the exception.
TL;DR
Overheating has been fully removed: the MVRV Z-Score has returned to a neutral zone. But aSOPR has been below 1.0 for 55 days - the market is still selling at a loss. For now this is not a reversal, but a prolonged phase of seller pressure.
Bitcoin MVRV Z-Score: Standard Deviation Upper Bands
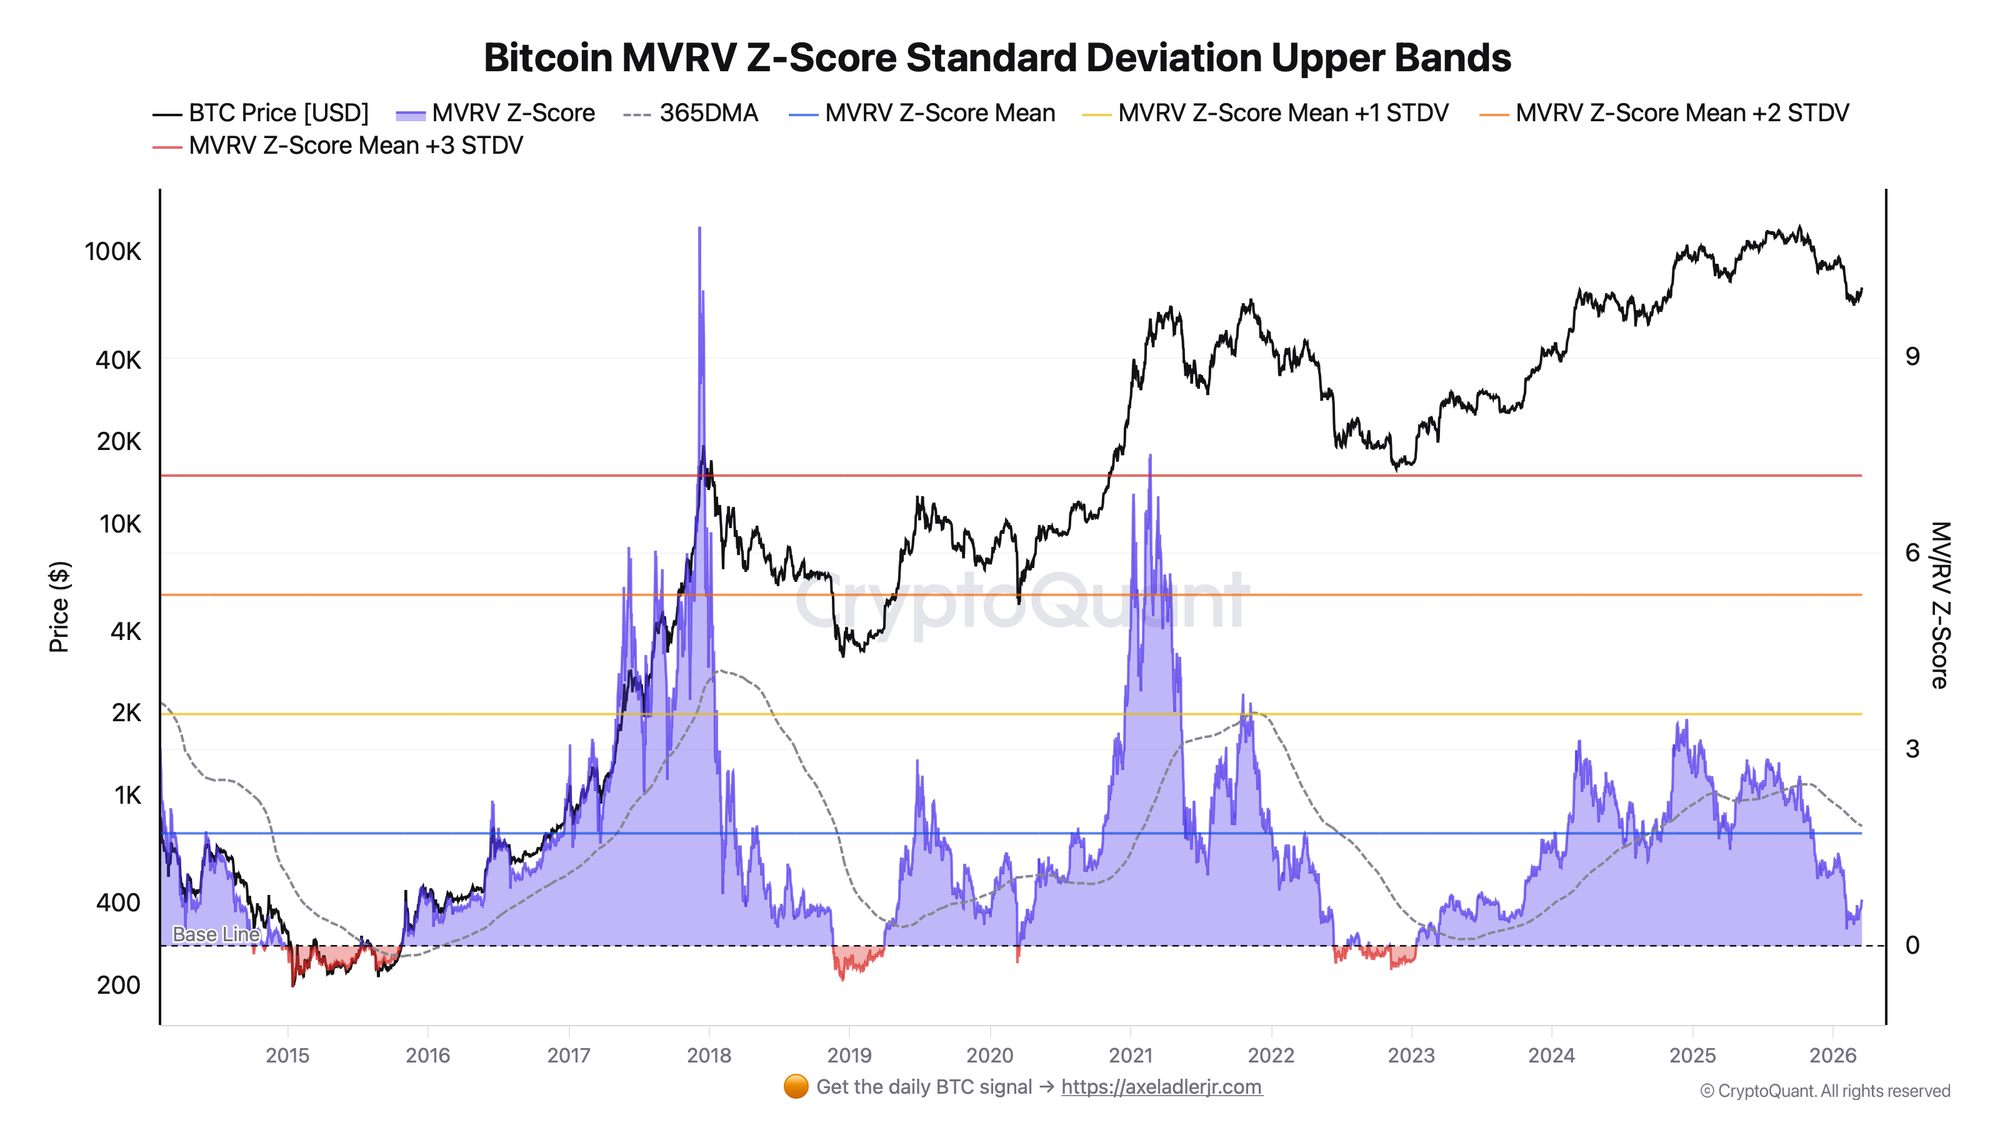
The MVRV Z-Score measures the deviation of Bitcoin's market capitalization from its realized capitalization, normalized for volatility. The +1SD, +2SD, and +3SD bands define historical overheating zones, while the 365DMA in this model acts as a dynamic momentum recovery line rather than a standard deviation band.
On October 6, 2025, the MVRV Z-Score reached a cycle high of 2.603. At that point the metric was in close proximity to its 365-day moving average (2.467), and the 365DMA itself passed near the lower boundary of the upper statistical zone. This reinforced the local overheating signal but did not make the 365DMA a standard deviation band. That was the last day the Z-Score held above its 365DMA. Since then the metric has declined 74%, dropping to 0.674 with BTC priced at $74,386.
The current Z-Score value is well below the Mean (1.72) and noticeably below the first deviation band +1SD (3.55), confirming the complete disappearance of valuation overheating. Historically the 0.5-1.0 range corresponds to the neutral zone of the cycle, where market capitalization only moderately exceeds realized capitalization. A return to the 365DMA, which currently sits around 1.83, would be the first sign of momentum recovery. Until then, MVRV alone does not provide sufficient grounds to speak of a reversal.
Bitcoin Adjusted SOPR (aSOPR) - Day
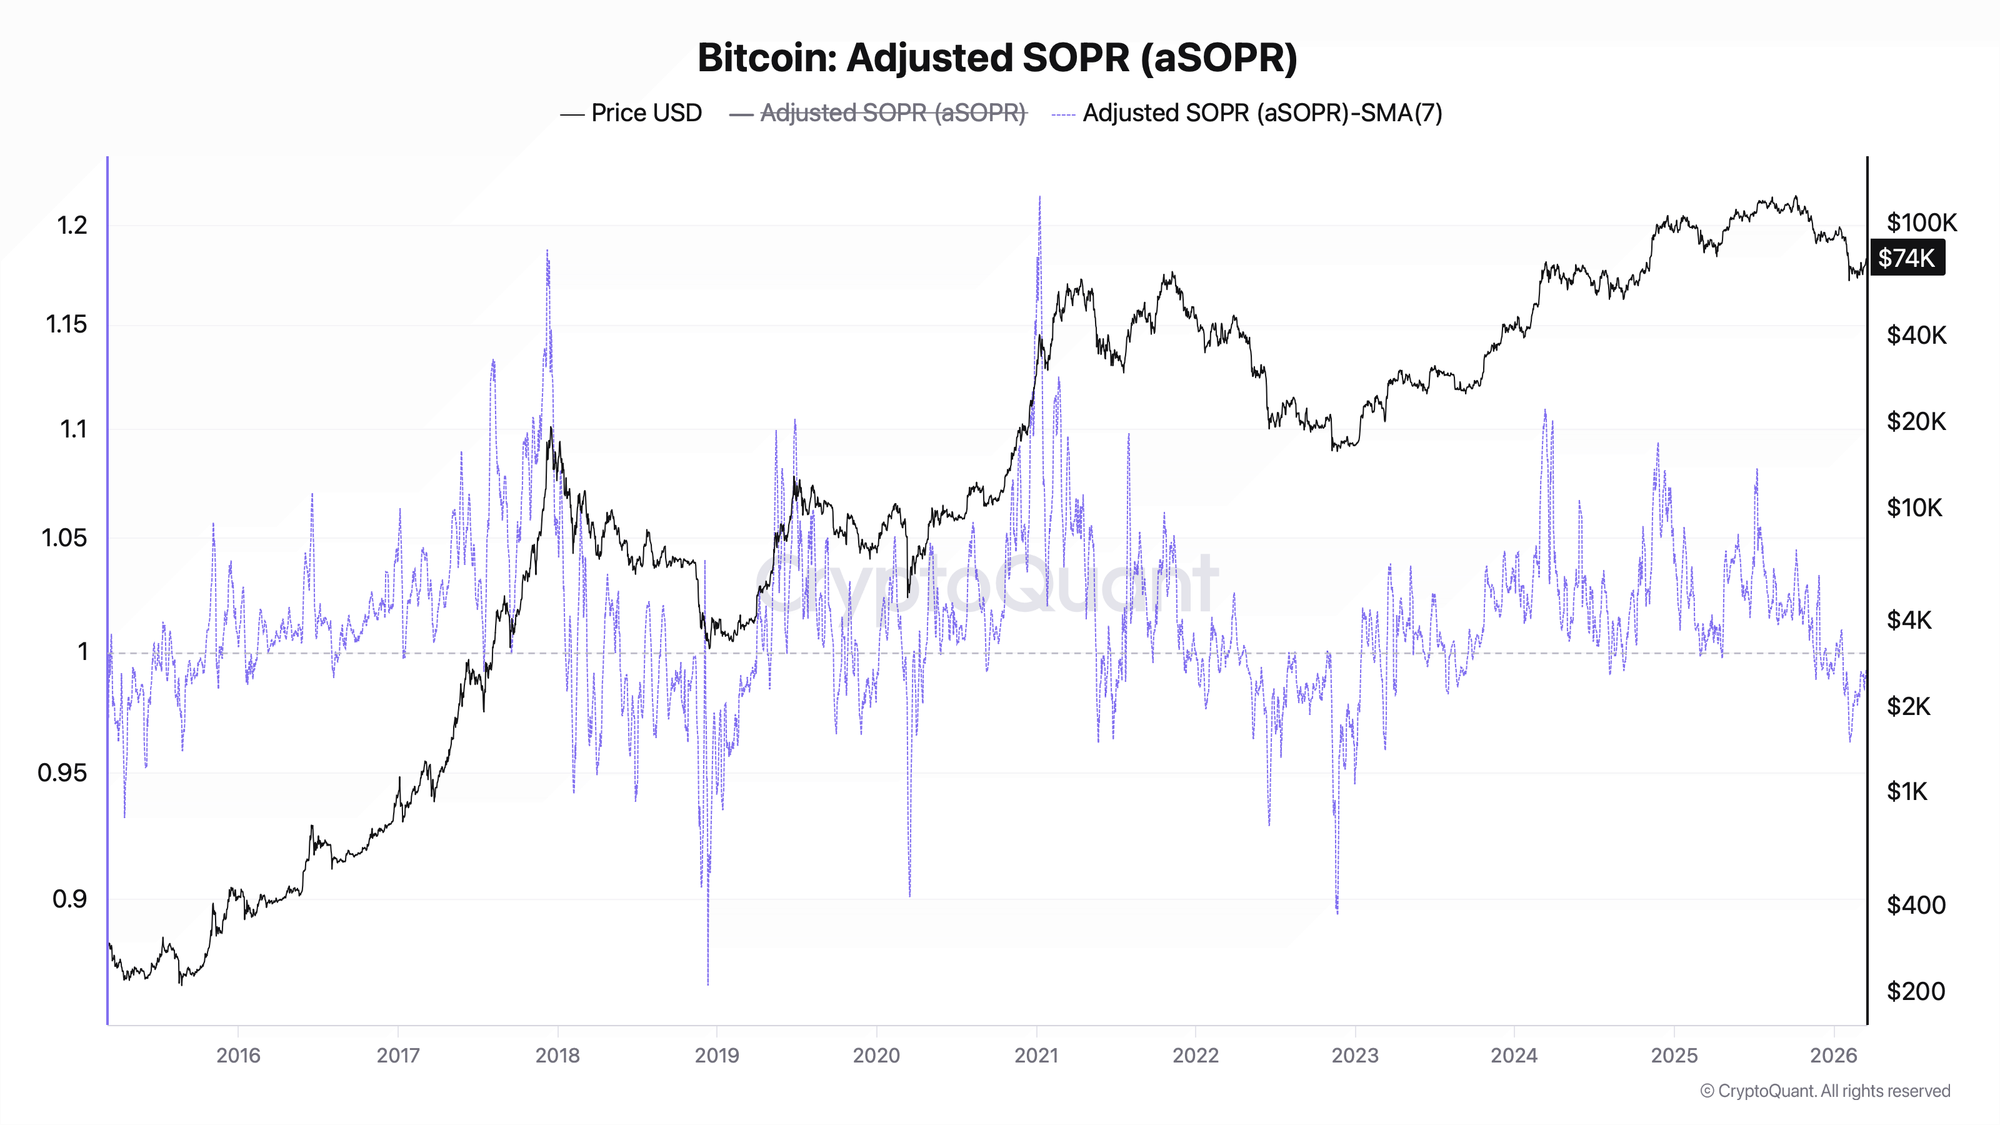
The aSOPR (Adjusted Spent Output Profit Ratio) reflects the ratio of realized to original value of spent outputs. A value above 1.0 means coins are being sold at a profit, below - at a loss.
The aSOPR (7-day SMA) last crossed above 1.0 on January 21, 2026 - the value was 1.0003, literally at the boundary. Since then the metric has not returned above the neutral level: for 55 consecutive trading days the market has closed with aSOPR below 1.0. The period low was recorded on February 7, 2026 at 0.9625 - during the most acute phase of the selloff. The current value of 0.9926 indicates a recovery from the extreme, but the market has still not returned to a regime of profitable selling.
The 1.0 level for aSOPR is the dividing line between selling-at-a-loss and selling-at-a-profit regimes. Until the 7-day SMA holds above 1.0 for at least several sessions in a row, any rally remains vulnerable to selling from participants looking to exit at breakeven.
LINK: The MVRV Z-Score shows the market is no longer overheated - excess overvaluation has already been removed. But aSOPR confirms that participant behavior has not yet changed: the market is still selling at a loss. The key question now is not whether Bitcoin is cheap, but whether seller pressure has been exhausted. For now the answer is no.
🟠 Invest in Bitcoin without guessing. Signals that tell you exactly when to buy and when to wait - no fear, no FOMO, no panic. See how the strategy performed → Return Calculator.
Does an MVRV Z-Score below 1.0 represent a buying opportunity? No. A Z-Score value below the Mean (1.72) indicates neutral valuation, but is not a standalone entry signal. Historically the most effective accumulation occurred when low MVRV was accompanied by signs of seller capitulation completing - aSOPR helps track that transition.
What needs to happen for the regime to shift from bearish to neutral? A double confirmation is needed: the aSOPR (7-day SMA) must hold sustainably above 1.0 for 3-5 sessions in a row, and the MVRV Z-Score must begin moving back toward its 365DMA, which currently sits around 1.83. A price rally by itself may create conditions for such a transition, but without on-chain confirmation from both metrics it will remain an incomplete signal.
CONCLUSIONS
Overheating in Bitcoin has been fully removed: the MVRV Z-Score has returned to the neutral zone and is trading well below its 365DMA. But seller capitulation is not yet complete - aSOPR has been below 1.0 for 55 days, confirming persistent selling at a loss. This is not a reversal, but a phase of prolonged sell-side pressure. The first sign of a regime change is a sustained return of aSOPR above 1.0 together with a recovery of the MVRV Z-Score toward the 365DMA. Until then any rally remains vulnerable to breakeven selling.