
A liquidation cascade is the single most violent mechanism in Bitcoin markets - it turns a 5% dip into a 15% crash in minutes. Understanding the mechanics, the on-chain warning signals, and the historical patterns transforms this market hazard from an unforeseeable disaster into a quantifiable risk. This guide covers exactly how cascades work, which metrics flag them in advance, and what the data shows about every major cascade since 2020.
TL;DR
- A liquidation cascade occurs when forced closures of leveraged positions trigger further price drops, which trigger more liquidations, creating a self-reinforcing crash loop.
- The trigger is a price move that breaches liquidation thresholds of clustered leveraged positions. The amplifier is thin order book liquidity and high aggregate leverage.
- Warning signals: ELR > 0.55, OI at 90-day high, funding rate persistently above 0.03%/8h - when all three align, cascade probability is elevated.
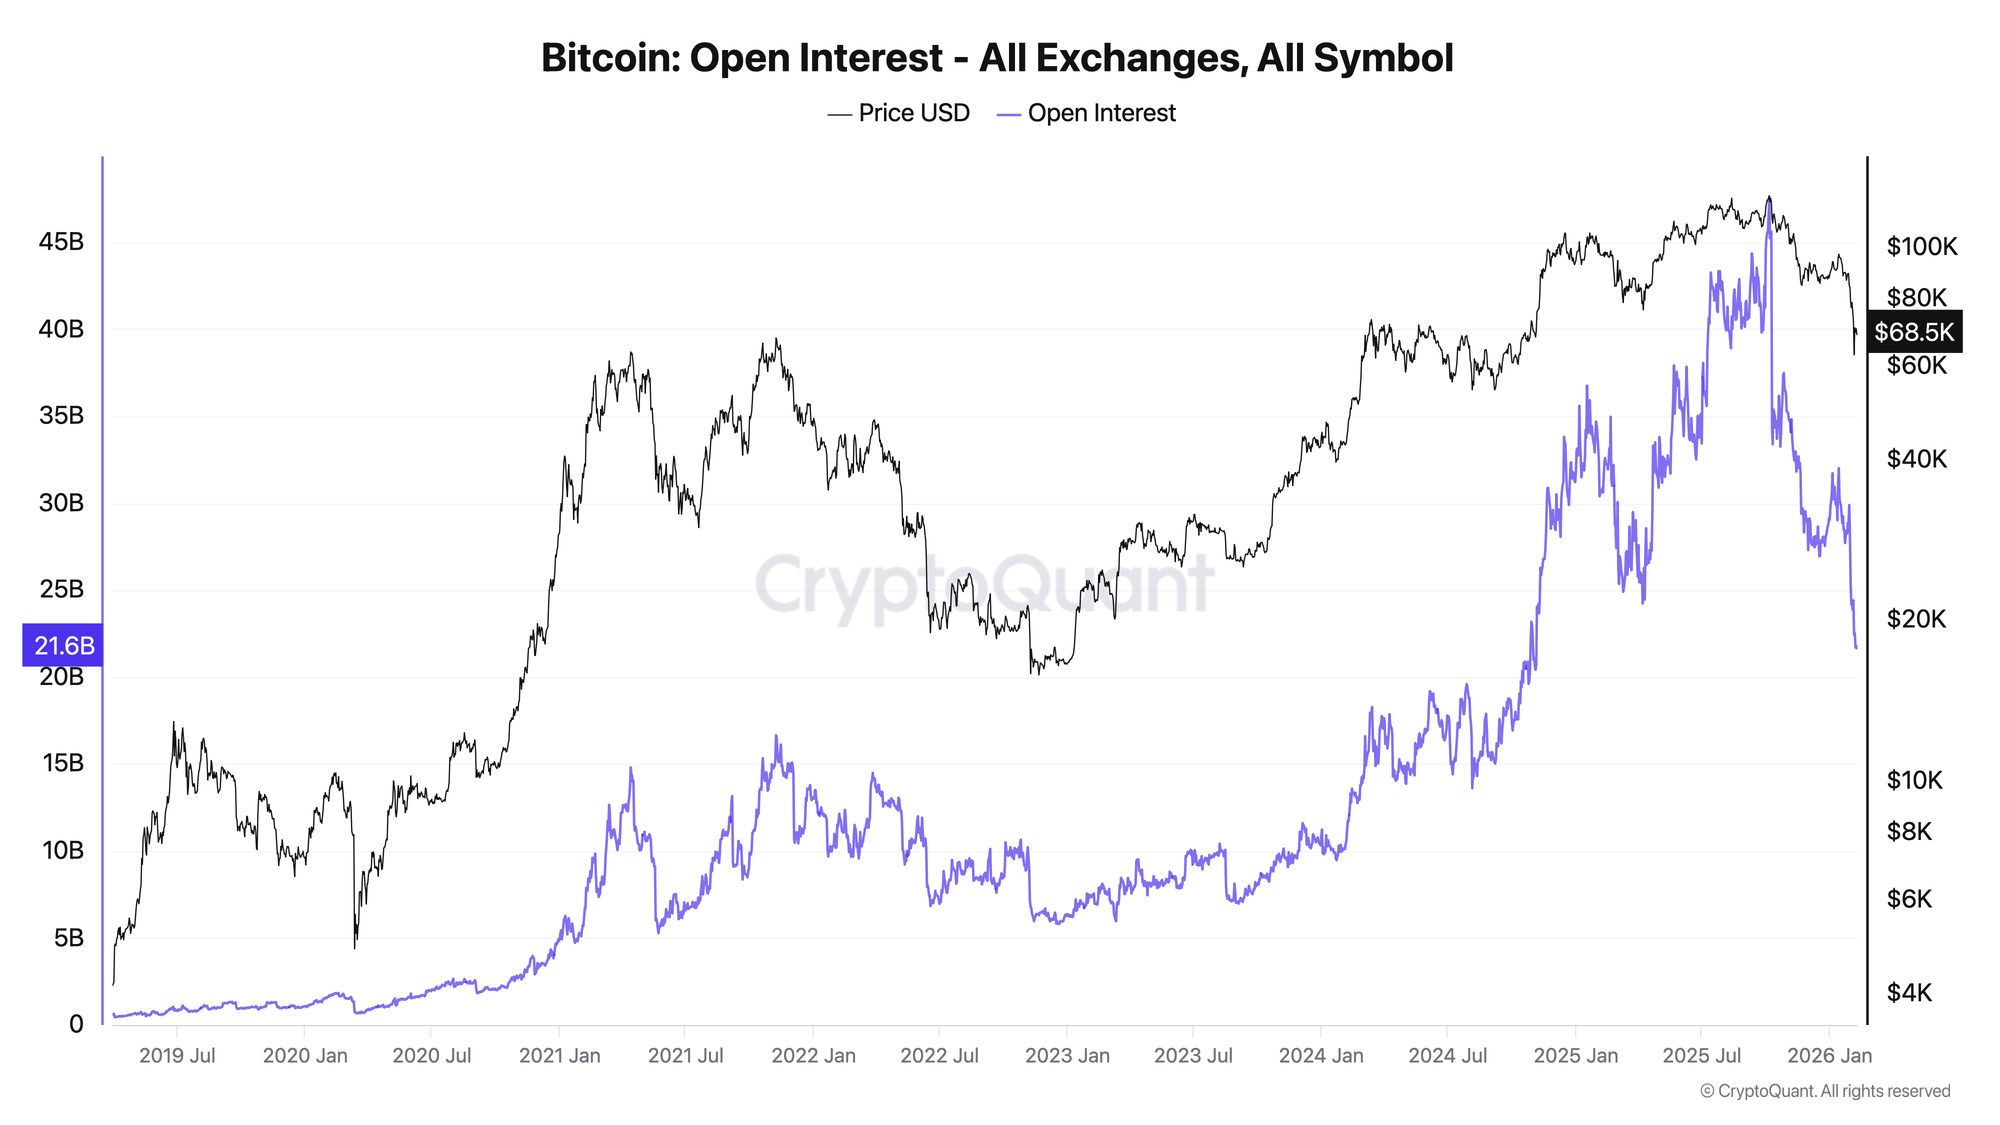
- Every major cascade since 2020 was preceded by Open Interest within 10% of its recent peak and ELR above the 75th percentile (0.52).
- Post-cascade opportunity: OI drops >30% within 7 days consistently mark high-conviction entry zones. The deeper the OI flush, the better the subsequent recovery.
- Signal rule: When aggregate OI drops >15% in 48 hours with simultaneous price drop >8%, a cascade is in progress. The bottom typically forms when OI decline decelerates (hourly OI change flattens).
The Signal Rule
Pre-Cascade Warning (Leading Indicator)
A cascade doesn't appear from nowhere. It requires a loaded market - high leverage, high OI, and crowded positioning. The pre-conditions:
CASCADE RISK = ELEVATED when:
  ELR > 0.55
  AND OI > 90-day moving average
  AND Funding Rate > 0.03% per 8h (sustained 3+ days)
When all three conditions are met simultaneously, the market is in a "loaded gun" state. Any exogenous shock (macro event, exchange failure, regulatory news) can pull the trigger.
During-Cascade Detection (Coincident Indicator)
CASCADE IN PROGRESS when:
  OI drops > 15% in 48 hours
  AND Price drops > 8% in 48 hours
  AND Liquidation volume > $500M in 24 hours
Post-Cascade Entry Signal (Lagging Indicator)
CASCADE COMPLETE (entry zone) when:
  Hourly OI change flattens (no further decline)
  AND ELR drops below its 30-day average
  AND Funding rate turns negative or near zero
Key Definitions
Liquidation: Forced closure of a leveraged position by an exchange when the trader's margin falls below the maintenance requirement. The exchange sells (for longs) or buys (for shorts) at market price to recover collateral.
Cascade: A self-reinforcing loop where liquidations push price further, triggering more liquidations. The mechanism: Liquidation → Market sell order → Price drops → More positions breach maintenance margin → More liquidations.
Maintenance margin: The minimum collateral ratio required to keep a position open. Typically 0.5%–5% depending on leverage and exchange. At 50× leverage, a 2% adverse move can breach maintenance margin.
Auto-deleveraging (ADL): The final backstop: when liquidated positions can't be filled at the bankruptcy price, the exchange forcibly closes profitable positions on the opposite side to balance the books. ADL affected even market makers during the October 2025 event.
Open Interest (OI): Total value of outstanding derivative contracts. During a cascade, OI drops sharply as positions are forcibly closed. The rate and depth of OI decline is the most reliable real-time measure of cascade severity.
How to Interpret Cascade Risk
Elevated Risk (Pre-Cascade)
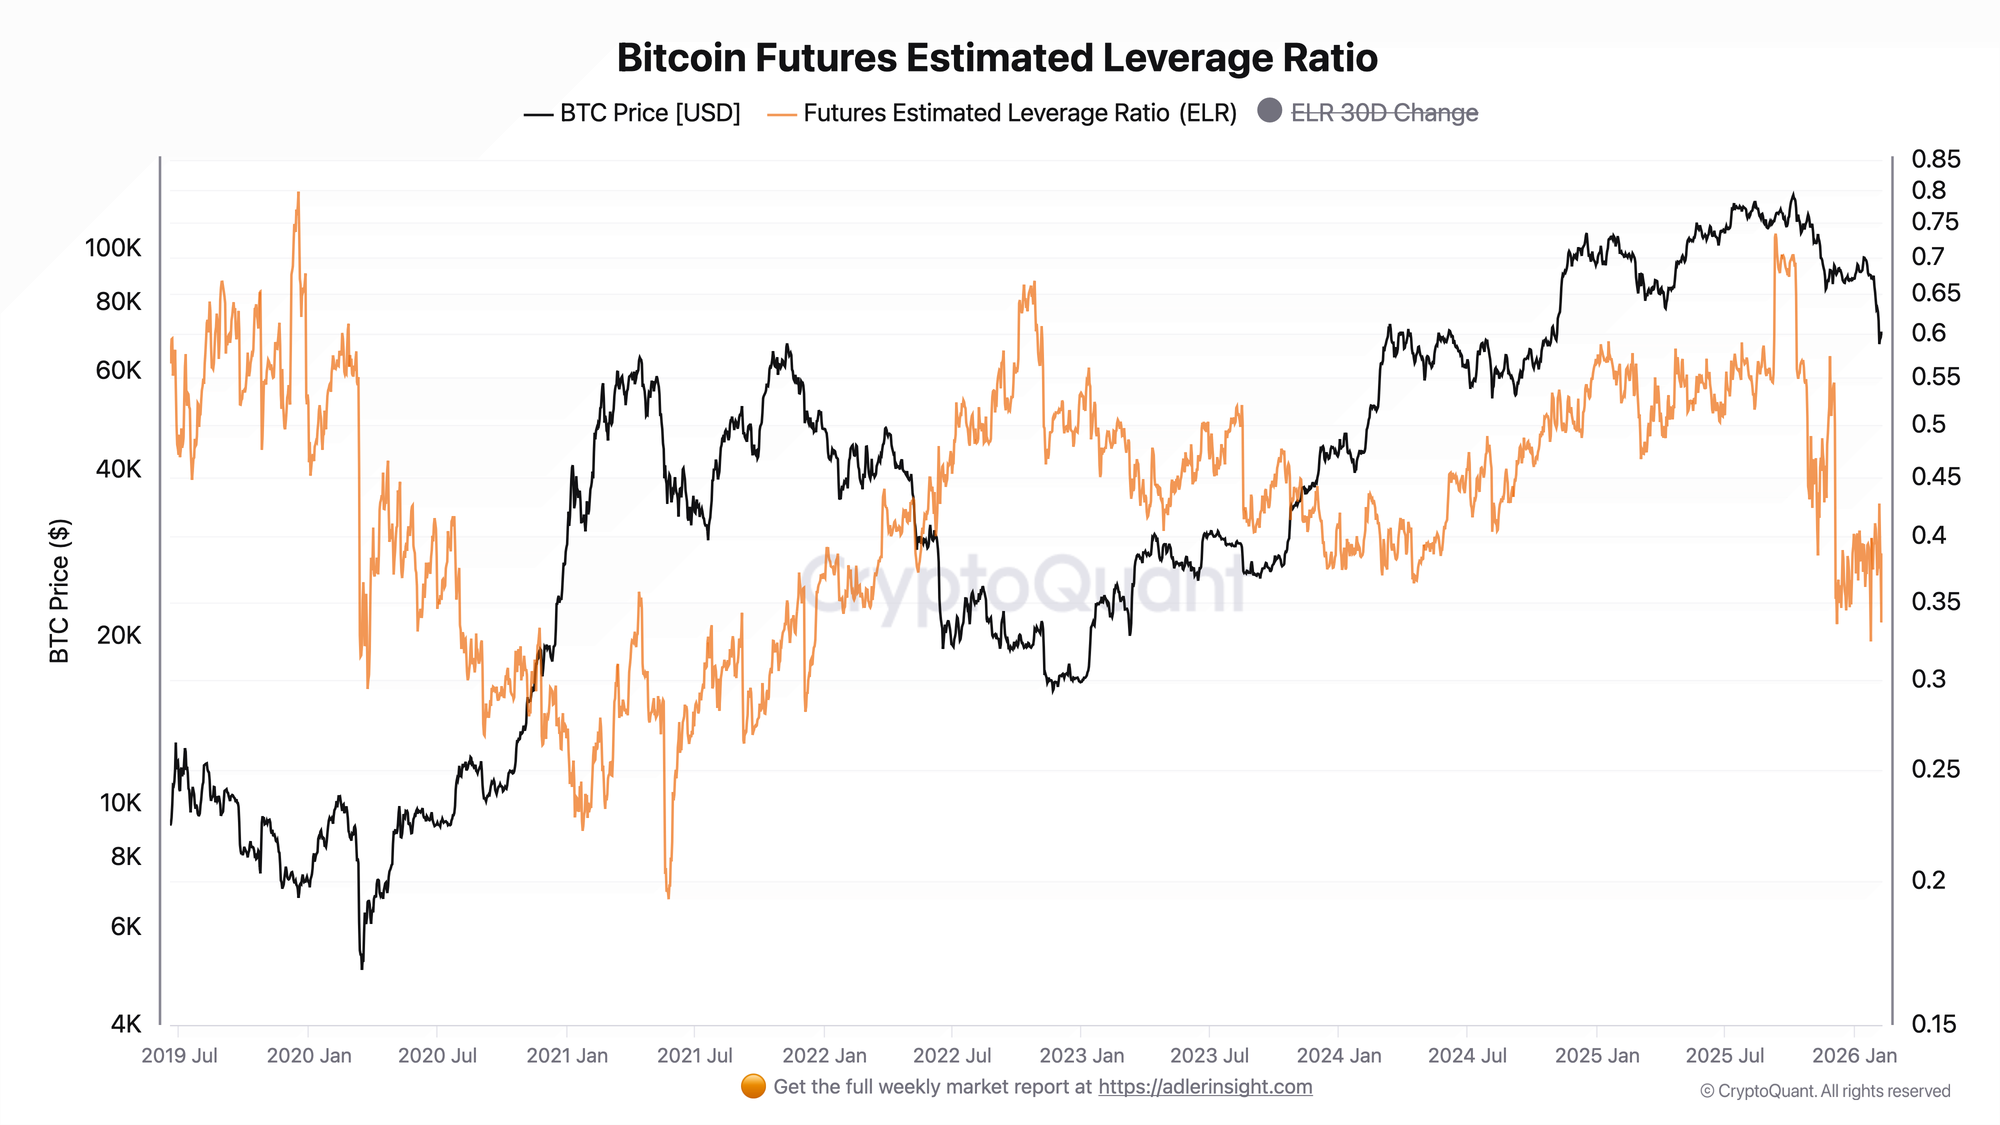
ELR above 0.55 places the market in the top quartile of historical leverage. At this level, every $1 of exchange reserve is supporting $0.55+ of derivative exposure. The buffer between current positions and their liquidation thresholds is thin.
What confirms it: Persistently positive funding rate (>0.03%/8h for 3+ days) means longs are paying a premium to hold positions. This crowding is the fuel - the cascade mechanism is the match.
What it looks like in data: Pre-October 2025 crash: ELR was 0.69, OI was $44.6B (all-time high at that time), BTC was $117K. The market was maximally loaded. When Trump's tariff announcement hit, $19B in positions were liquidated within 36 hours.
Cascade in Progress
OI drops sharply (15%+ in 48h) alongside price. This is NOT a moment for new positions - it's a moment to observe. Cascade dynamics can push price well below any "fair value" level because the selling is mechanical, not fundamental.
What confirms it: Liquidation volume spikes (CoinGlass real-time). Exchange APIs show latency/outages (a reliable secondary signal - when infrastructure strains, volumes are extreme). Funding rate crashes from positive to deeply negative.
Post-Cascade Recovery Zone
The cascade is complete when OI stabilizes - hourly OI change oscillates around zero instead of declining. ELR drops below its 30-day average. Funding rate normalizes to ±0.01%.
What it means: The leveraged players are gone. What remains is a market of conviction holders and fresh capital. This environment has historically produced the best risk/reward entry points.
Historical Examples
Example 1: May 19, 2021 - The Benchmark Cascade
Pre-cascade conditions:
- OI: $9.1B (near 90-day peak)
- ELR: 0.29 (moderate by later standards, but high for the era)
- BTC: $44,466
- Funding: persistently positive through April
The event: No single trigger - a confluence of Elon Musk's anti-Bitcoin tweets, China mining ban rumors, and market structure fragility. BTC dropped from $43K to $30K intraday.
Cascade metrics:
- OI crashed from $10.9B (May 10) to $6.0B (May 19) to $5.6B (May 25): -49% in 15 days
- ELR hit its all-time low: 0.193
- BTC fell from $57,153 to $38,164: -33%
- An estimated $8B+ in liquidations occurred across the event window
What happened after: BTC rallied 119% from the July bottom ($29.8K) to the November ATH ($66.4K). The extreme OI flush and ELR = 0.19 created the cleanest entry signal in the dataset.
Key lesson: The depth of OI destruction predicts the quality of the subsequent recovery. A 49% OI drop + ELR at all-time low = maximum conviction entry.
Example 2: FTX Collapse, November 2022 - The Reserve Shock
Pre-cascade conditions:
- OI: $9.7B
- ELR: 0.59 (elevated - top decile)
- BTC: $21,140
- Funding: mixed, no strong directional signal
The event: FTX, the third-largest exchange, became insolvent. Customer deposits were commingled with Alameda Research's trading losses.
Cascade metrics:
- OI dropped from $9.7B to $6.8B: -30% in 3 days
- ELR dropped from 0.59 to 0.50 - but notably did NOT drop below 0.45
- BTC fell from $21,140 to $17,056: -19%
- Exchange reserves plummeted as users withdrew BTC en masse
Why this cascade was different: OI declined, but ELR didn't reach the extreme lows seen in May 2021 (0.19). Why? Because reserves (the denominator) fell faster than OI (the numerator). Everyone was pulling collateral out of exchanges, which kept ELR elevated even as positions closed. This meant the market remained relatively leveraged post-crash - and indeed, BTC spent another 2 months grinding near $16.5K before recovering.
Key lesson: ELR post-crash matters more than the OI drop. If ELR stays elevated after a cascade (>0.45), the deleveraging is incomplete. Full recovery takes longer. Only when ELR drops to the lower quartile (<0.35) is the flush comprehensive.
Example 3: October 10, 2025 - The Record Cascade
Pre-cascade conditions:
- OI: $45.6B (within 5% of ATH)
- ELR: 0.70 (highest reading of the post-2019 era)
- BTC: $122,391
- Funding: elevated positive for weeks
The event: Trump announced 100% tariffs on Chinese goods. Global risk assets sold off. BTC dropped from $122.6K high.
Cascade metrics:
- OI crashed from $45.6B to $33.4B: -27% in one week
- ELR dropped from 0.70 to 0.56
- BTC fell from $122,391 to $111,569: -9% at the daily level (intraday much worse - briefly below $105K)
- $19 billion in liquidations - the largest single-day event in crypto history
- Market makers withdrew liquidity, creating the thinnest order books since 2022
- Multiple exchanges experienced outages; ADL was triggered on profitable positions
What happened after: BTC initially recovered to ~$112K but continued declining over the following months. By February 2026, BTC was trading near $70K. The reason: ELR remained above 0.50 post-crash, indicating the deleveraging was partial. The market needed months to fully unwind the excess.
Key lesson: The absolute size of the cascade ($19B in liquidations, $12B OI decline) is less important than whether ELR reaches its lower quartile. October 2025's cascade was the largest ever in dollar terms but did NOT produce an immediate V-recovery because ELR stayed elevated at 0.56.
How to Use It in Practice
Setup
Monitor three metrics daily: aggregate OI (CoinGlass), ELR (CryptoQuant), and weighted average funding rate (CoinGlass or Coinalyze). Flag when all three enter their danger zones simultaneously.
Trigger: Pre-Cascade Risk Alert
IF ELR > 0.55
AND OI > 90-day SMA
AND Funding Rate > 0.03% per 8h for 3+ consecutive days
THEN → Reduce leveraged exposure by 50%. Move stop-losses to breakeven.
        Consider small hedge via put options (Deribit).
Confirm: Cascade in Progress
IF OI drops > 10% in 24 hours
AND Liquidation volume > $500M in 24h (CoinGlass)
AND Funding rate reverses from positive to negative
THEN → Do NOT open new positions. Cascade dynamics can push price
        well beyond any support level. Wait for OI stabilization.
Post-Cascade Entry
IF OI has declined > 25% from pre-cascade peak
AND Hourly OI change has been flat (±1%) for 12+ hours
AND ELR < 0.40
AND Funding rate is between -0.01% and +0.01%
THEN → Begin DCA into spot. Initial position: 25% of target allocation.
        Scale to full over 7-14 days as OI stabilizes.
Invalidates When
- Pre-cascade risk alert is invalidated if ELR drops below 0.50 without a cascade occurring (organic deleveraging - bullish).
- Post-cascade entry is invalidated if ELR starts rising again before price stabilizes (re-leveraging into weakness - Regime 2 bearish divergence restarting).
Common Pitfalls
1. Trying to trade the cascade itself. Cascades are 10–40 minute events at their violent core. By the time you identify it, it's too late to short. By the time you try to buy the bottom, it may not be the bottom. The actionable signals are before (reduce risk) and after (re-enter). Filter: Trade the setup (pre-warning) and the aftermath (post-flush), never the event itself.
2. Assuming every OI drop is a cascade. OI declines 5–10% routinely during consolidation as traders take profit or rotate. A genuine cascade requires simultaneous OI drop >15%, price drop >8%, and spiking liquidation volume. Without all three, it's orderly deleveraging. Filter: Use the triple-criteria definition. If liquidation volume is moderate, it's profit-taking, not a cascade.
3. Buying the first bounce. Cascades often produce a "dead cat bounce" - a 5–10% recovery within hours that traps buyers before the second leg down. October 2025 showed this: BTC briefly recovered from $105K to $112K before resuming the decline toward $70K over months. Filter: Wait for ELR to drop below 0.40 before entering. If ELR is still >0.50 after the initial crash, the deleveraging is incomplete and further downside is probable.
4. Using leverage to "buy the dip" during a cascade. This is the single most common way traders get wiped out. During a cascade, even "good" entries can be liquidated by the next wave. Spot-only entries during and after cascades are the only risk-appropriate approach. Filter: Absolute rule: post-cascade entries are spot only. No leverage until ELR has been below 0.40 for 7+ consecutive days.
5. Ignoring exchange-level concentration. Aggregate OI may look manageable, but if 50%+ is concentrated on one exchange (typically Binance), the cascade risk is exchange-specific. The October 2025 event hit Binance disproportionately hard, triggering ADL on market makers. Filter: Check per-exchange OI breakdown on CoinGlass. If any single exchange holds >45% of aggregate OI, apply a risk premium to your assessment.
6. Treating ELR as a timing signal. ELR > 0.55 means the market is fragile, but it cannot tell you when the trigger will arrive. ELR stayed above 0.55 for weeks in late 2024 to early 2025 before the eventual correction. It's a regime indicator, not a timing tool. Filter: Use ELR for position sizing (reduce when high). Use funding rate spikes and sudden OI drops for timing.
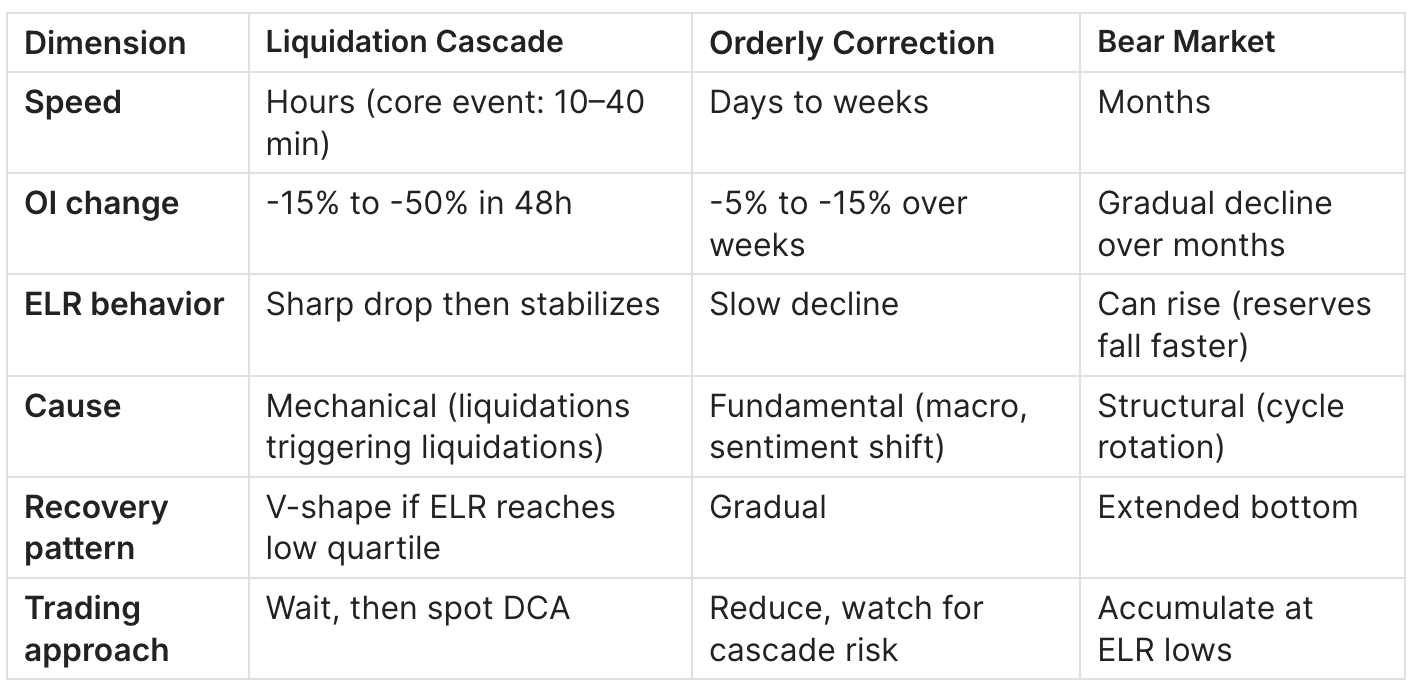
Liquidation Cascade vs. Orderly Correction vs. Bear Market
FAQ
What causes a Bitcoin liquidation cascade?
The proximate cause is a price move that breaches the liquidation thresholds of many leveraged positions simultaneously. The structural cause is excessive aggregate leverage (high ELR), concentrated positioning (high funding rate), and thin order book liquidity. Any exogenous shock - macro event, exchange failure, regulatory action - can trigger the cascade in a loaded market.
How much is typically liquidated in a major cascade?
In dollar terms: the May 2021 event was ~$8B+, the October 2025 event was $19B. But dollar amounts scale with market size. A more meaningful measure is the percentage OI decline: major cascades typically wipe 25–50% of aggregate OI within 48 hours.
Can liquidation cascades be predicted?
The conditions for a cascade can be identified with high reliability (ELR > 0.55, high OI, extreme funding). The exact timing cannot - the trigger is typically an unpredictable event. The practical approach is to reduce risk when conditions are present, not to predict the date.
Where can I monitor liquidation data in real time?
CoinGlass provides real-time aggregate and per-exchange liquidation data. CryptoQuant includes liquidation data in its derivatives dashboard. Coinalyze provides historical liquidation charts.
What ELR level signals that a cascade is complete?
Historically, ELR dropping below 0.35 post-cascade signals a comprehensive flush (May 2021: ELR hit 0.19). If ELR stays above 0.45 after a cascade (like post-October 2025), the deleveraging is partial and further downside risk remains. The lower the ELR floor, the higher the conviction in subsequent recovery.
Do cascades happen in both directions (long squeeze and short squeeze)?
Yes. Long liquidation cascades (price drops, longs liquidated) are more common and more violent because leveraged longs tend to cluster more densely than shorts. Short squeezes (price rises, shorts liquidated) also occur but are typically less severe because short positioning is usually more dispersed.
How is the ETF era changing cascade dynamics?
ETF-era OI includes significant non-directional positions (basis trades). This means: higher absolute OI levels (structural inflation), but the leveraged portion of OI may be a smaller percentage. Cascades still occur but the OI-to-liquidation ratio may be different. ELR remains the best filter because it measures leverage relative to collateral regardless of OI composition.
What's the relationship between cascades and market maker behavior?
During severe cascades, market makers withdraw liquidity to protect their own positions (or because ADL forces them out). This creates a feedback loop: thinner order books → larger price impact per liquidation → more liquidations. The October 2025 event left the thinnest order books since 2022 according to BitMEX analysis. This liquidity withdrawal is why cascade price drops are often far more extreme than the fundamental news would justify.
Related Guides
- Bitcoin Open Interest & Leverage Ratio: Definition, Formula & Cycle Signals - Complete reference for OI and ELR fundamentals, calculation, and historical ranges.
- Bitcoin OI vs Price: 4 Divergence Patterns - Regime 2 (OI↑Price↓) is the pre-cascade divergence pattern. This guide covers all four regimes.
- Bitcoin Funding Rate Guide - How extreme funding confirms cascade risk conditions.
- Bitcoin Exchange Flows - On-chain reserve changes that drive ELR and cascade recovery signals.
- MVRV Ratio Guide - Spot-market valuation context for post-cascade entry timing.
Conclusion
- Liquidation cascades are mechanical, not random - they require a loaded market (high ELR + high OI + crowded funding) and an exogenous trigger.
- The pre-cascade signal (ELR > 0.55, OI at 90-day high, funding > 0.03%) is detectable days to weeks before the event. This is the window for risk reduction.
- The post-cascade signal (OI down 30%+, ELR < 0.35, funding neutral) marks the highest-conviction entry zones in Bitcoin's cycle. The deeper the flush, the stronger the recovery.
Next step: Read the OI vs Price Divergence guide to learn how to identify Regime 2 (bearish divergence) - the pattern that sets up cascades before they happen.