
Has the 4-year Bitcoin cycle broken? Discover why Global M2 liquidity and structural ETF demand now overpower the mechanical halving supply shock.
TL;DR
- What it is: An analytical framework showing that fiat liquidity expansion (Global M2) increasingly dominates Bitcoin cycle tops and bottoms relative to the 210,000-block halving schedule.
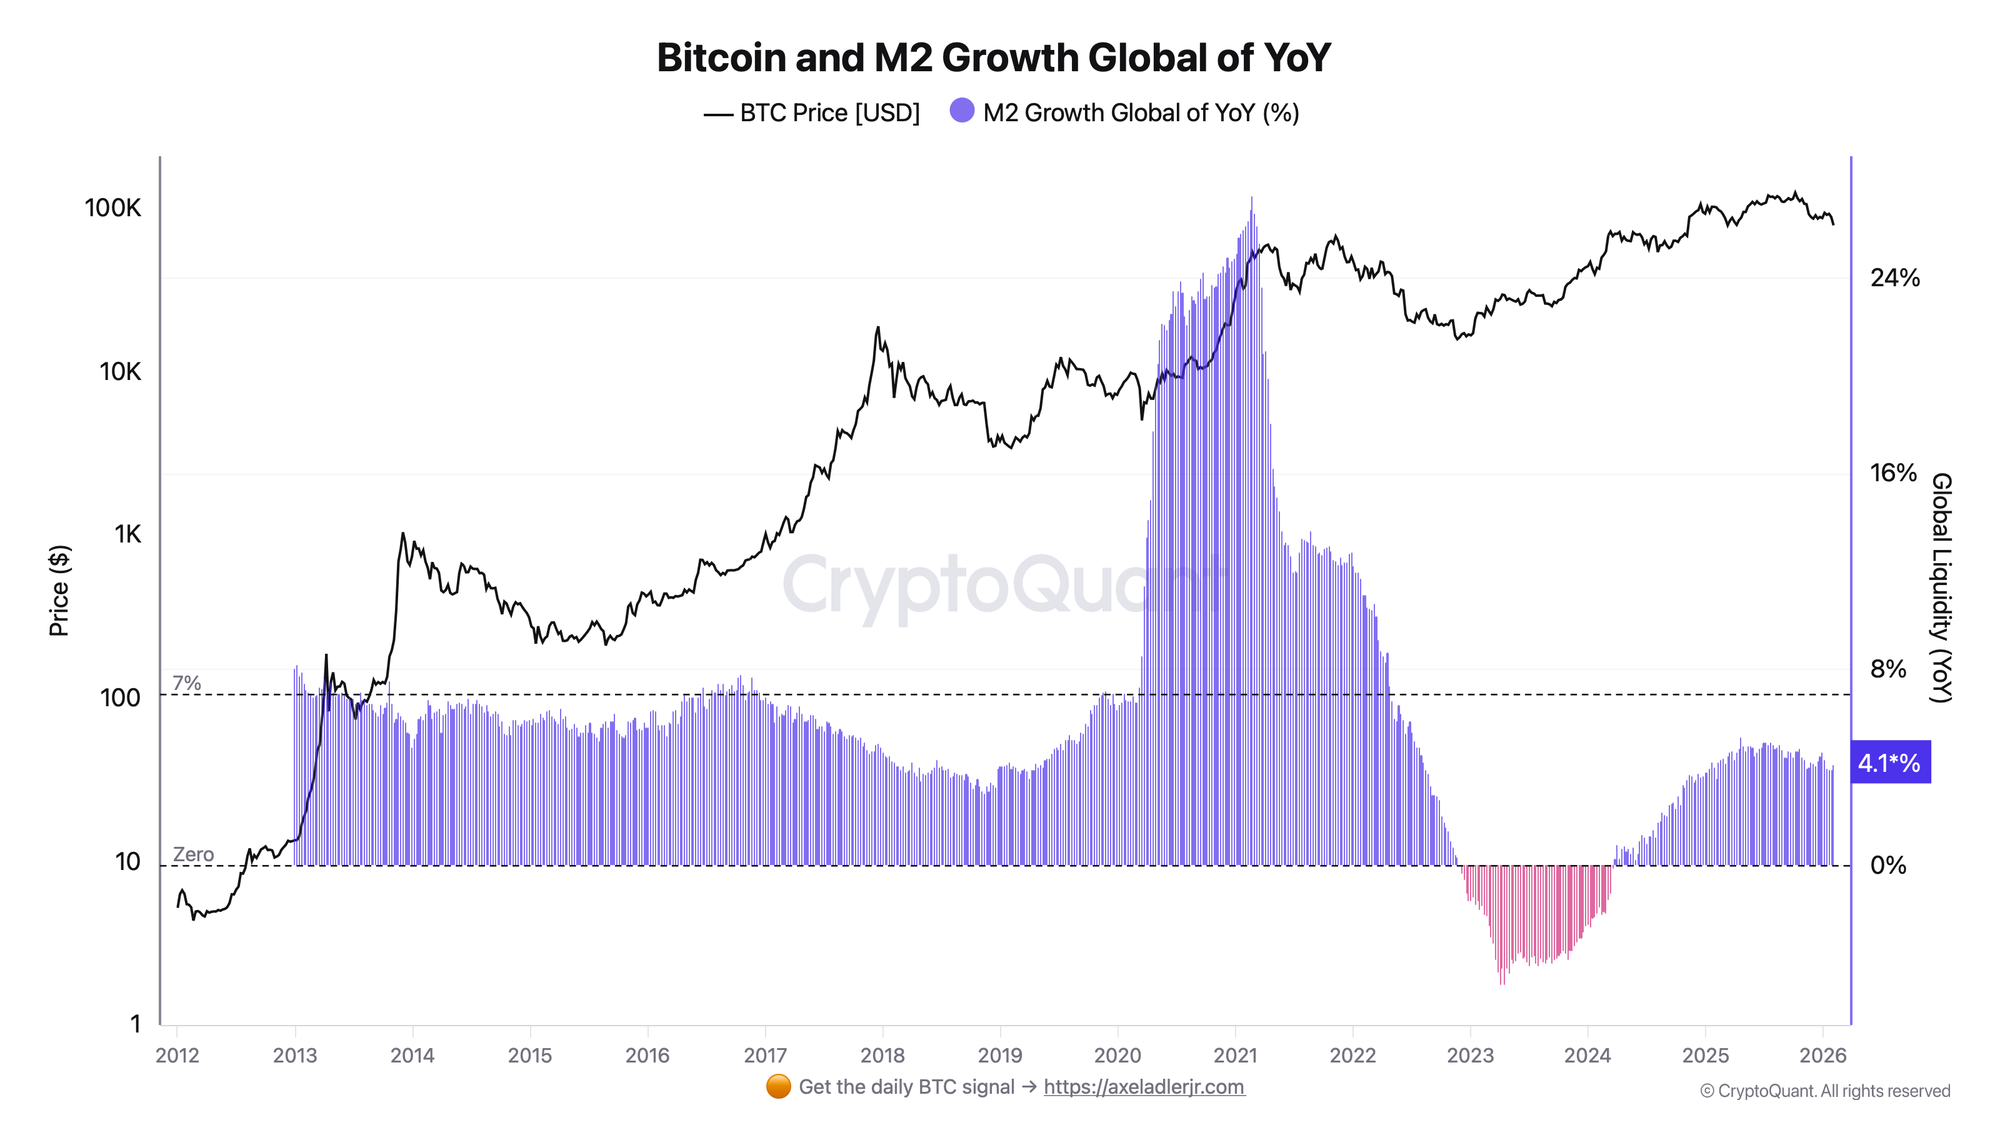
- How it’s calculated: By comparing Bitcoin’s historical ROI from halving dates against the Year-over-Year (YoY) percentage change in Global M2.
- What "Up/Down" means: Rising M2 YoY = fiat liquidity expansion (debasement), typically supporting BTC. Contracting M2 YoY = macro tightening, suppressing BTC regardless of halving phase.
- Core practical takeaway: Buying blindly based on
days_since_halvingis degraded as a standalone strategy; post-halving peak ROI has compressed materially as Bitcoin’s market cap has grown. - Context/false signals: The cycle isn’t "dead" in phase structure, but it is weaker as a mechanical price-multiplier. Relying on historical timing without checking liquidity conditions can produce severe drawdowns.
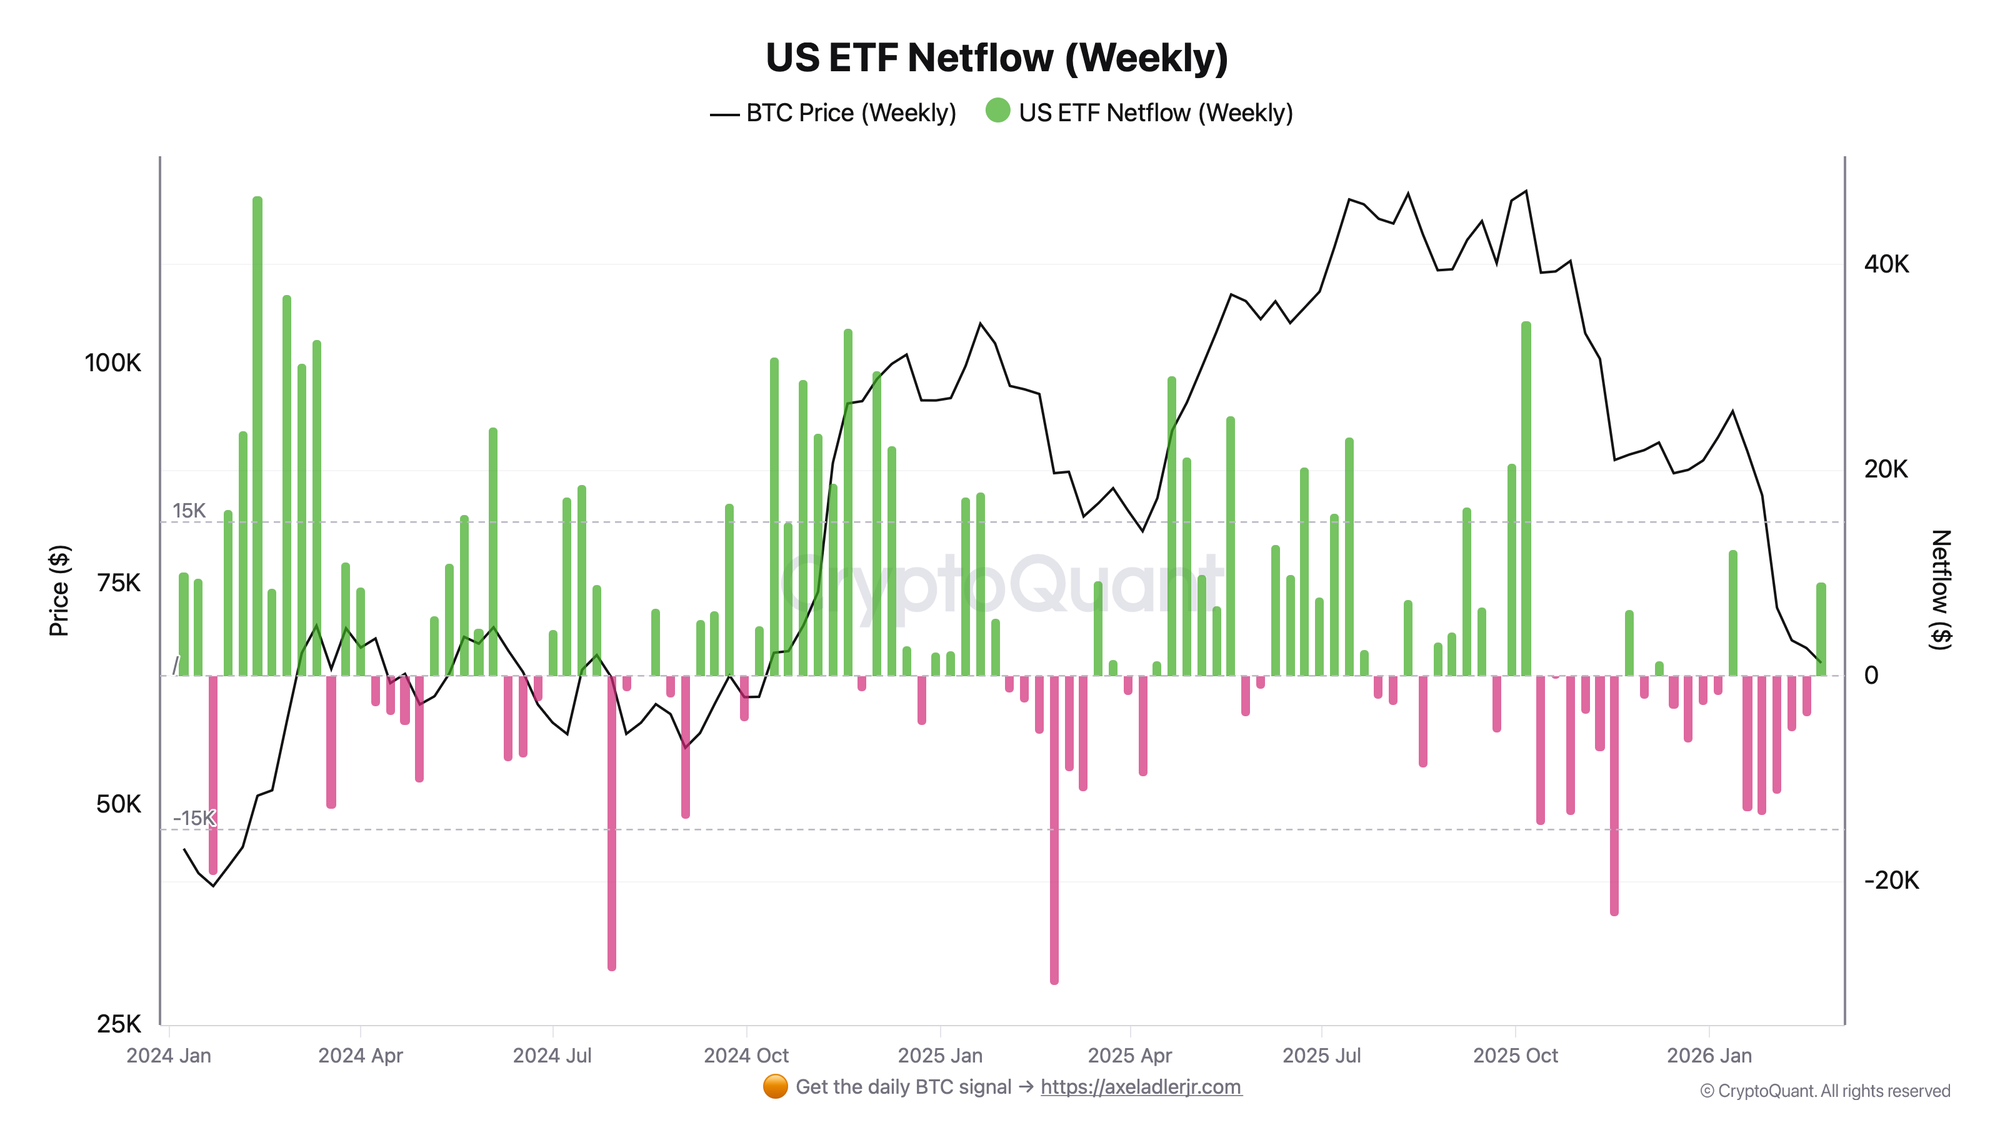
- The mini-rule: A macro regime shift is more likely when Global M2 YoY is above 2% and improving while US spot ETFs maintain positive 30-day netflows.
The signal rule
Formula:
Macro Dominance = Global M2 YoY Acceleration + Sustained Institutional Inflows
Thresholds and window:
- Bullish (cycle extension): M2 YoY > 3.0% and accelerating. Liquidity is expanding, raising the probability of new highs regardless of
days_since_halving. - Bearish (cycle suppression): M2 YoY < 0%. Liquidity contraction caps risk appetite and can force deep drawdowns (-60% or worse) even if on-chain accumulation looks healthy.
- Neutral: M2 YoY is flat (0% to 1.5%). Bitcoin becomes more sensitive to endogenous crypto drivers and miner supply dynamics.
Examples:
- If global liquidity contracts sharply (for example, M2 YoY dropping below 0% as in late 2022), then Bitcoin can break its typical cycle accumulation floors and print severe YoY losses.
- If fiat liquidity front-runs the halving (as seen with $10B+ ETF inflows in Q1 2024), then the market can print an ATH earlier than historical post-halving timing, weakening the "post-halving surge" rule.
SQL / Code snippet
Tracking the macro liquidity engine: Global M2 YoY vs Bitcoin YoY (BigQuery). This version aggregates to weekly data so LAG(52) is consistent.
-- Weekly (Sunday) aggregation + YoY change (52 weeks)
WITH price_daily AS (
  SELECT
    DATE(datetime) AS day,
    c AS price
  FROM `tech-web3-analytics-prod.abstraction_price.btc_usd_index-price_day`
  WHERE DATE(datetime) >= '2012-01-01'
),
m2_daily AS (
  SELECT
    DATE(event_timestamp) AS day,
    AVG(value) AS m2_value
  FROM `poc_stage.tradfi_fred_dataset`
  WHERE type = 'm2' AND DATE(event_timestamp) >= '2012-01-01'
  GROUP BY 1
),
price_weekly AS (
  SELECT
    DATE_TRUNC(day, WEEK(SUNDAY)) AS week,
    AVG(price) AS price
  FROM price_daily
  GROUP BY 1
),
m2_weekly AS (
  SELECT
    DATE_TRUNC(day, WEEK(SUNDAY)) AS week,
    AVG(m2_value) AS m2_value
  FROM m2_daily
  GROUP BY 1
)
SELECT
  w.week,
  100 * SAFE_DIVIDE(p.price - LAG(p.price, 52) OVER (ORDER BY w.week),
                    LAG(p.price, 52) OVER (ORDER BY w.week)) AS btc_yoy,
  100 * SAFE_DIVIDE(m.m2_value - LAG(m.m2_value, 52) OVER (ORDER BY w.week),
                    LAG(m.m2_value, 52) OVER (ORDER BY w.week)) AS m2_yoy
FROM (SELECT week FROM m2_weekly UNION DISTINCT SELECT week FROM price_weekly) w
LEFT JOIN price_weekly p USING (week)
LEFT JOIN m2_weekly m USING (week)
ORDER BY 1 DESC;
Key definitions
- Global M2 YoY: The rate of change in broad money across major economies (Fed, ECB, BOJ, PBOC). A practical proxy for global liquidity conditions.
- Diminishing returns: The long-term compression of cycle-to-cycle upside multiples as Bitcoin’s market cap scales (large assets require more marginal capital to move).
- Macro dominance: A regime where external liquidity conditions outweigh Bitcoin’s internal supply mechanics in determining timing and magnitude of major moves.
How to interpret this metric
- Bullish case: M2 YoY forms a macro bottom and accelerates. Bitcoin behaves like a high-beta liquidity sponge. The halving becomes more of a psychological tailwind than the primary driver.
- Bearish case: Central banks tighten (QT), liquidity contracts, and negative M2 YoY removes risk capital. In this state, the 4-year timing model becomes unreliable.
- Neutral case: Central banks pause. Bitcoin becomes more responsive to crypto-native supply shocks (miner capitulation, LTH distribution).
- What matters most: Direction and momentum of M2 YoY, not the nominal level.
Historical examples (what worked, what didn’t)
- Late 2022 (the cycle breaker):
- Date: December 2022.
- What the indicator showed: Broad money growth rolled over and liquidity conditions tightened aggressively.
- What the market did: Bitcoin reached the bear-market low around ~$15,900 after a deep drawdown.
- Context: Macro liquidity dominated cycle timing during the fastest tightening regime in decades.
- Q1 2024 (the pre-halving ATH):
- Date: January to March 2024.
- What the indicator showed: Liquidity conditions improved while US spot ETFs introduced a structural demand shock.
- What the market did: Bitcoin printed ~$72,000+ before the halving.
- Context: Structural demand compressed the historical "post-halving" timeline, showing demand shocks can outpace supply shocks.
How to use it in practice
- Setup: You want to allocate capital over the next 12 to 24 months but don’t want to rely on cycle timing alone.
- Trigger: Track Global M2 YoY. If it is crossing from negative to positive and accelerating, macro tailwinds are improving.
- Confirm: Use Bitcoin Exchange Netflow: What It Is and How to Use It to confirm coins are leaving exchanges (supply tightening) while liquidity improves.
- Invalidates when: Inflation re-accelerates and central banks pivot back to aggressive hikes, tightening liquidity.
- Action: When M2 is accelerating, treat "late-cycle" timing warnings as lower signal. When M2 is contracting, prioritize risk management even if the halving just occurred.
Common pitfalls
- Expecting Cycle 1 multiples: Projecting 10x to 20x returns from early-cycle charts is often a category error. Filter: larger market caps require more marginal liquidity - watch M2 dynamics, not 2016 analogs.
- Ignoring the cost of capital: A halving under ZIRP behaves differently than a halving when risk-free rates are high. Filter: overlay policy rates (or financial conditions) on cycle timing.
- Assuming the cycle is "dead" forever: The mechanical multiplier is weaker, but behavioral phases still exist. Filter: use the 4-year structure for mapping regimes, not for deterministic price targets.
Halving supply shock vs macro liquidity
- Halving supply shock: Cuts issuance mechanically (for example, ~900 to ~450 BTC/day). Material in smaller markets; less dominant as Bitcoin matures.
- Macro liquidity: Global money growth and ETF flows can represent multi-billion-dollar demand shocks, often dominating marginal price-setting in an institutional market.
FAQ
- Q: Is the 4-year Bitcoin cycle completely dead?
- A: No. Phase structure (accumulation, bull, distribution, bear) still appears, but its mechanical ability to generate exponential returns purely via halving is weaker.
- A: No. Phase structure (accumulation, bull, distribution, bear) still appears, but its mechanical ability to generate exponential returns purely via halving is weaker.
- Q: Why does Global M2 matter to Bitcoin?
- A: Bitcoin is priced in fiat. When broad fiat liquidity expands, risk appetite and nominal valuation support typically improve for scarce assets.
- A: Bitcoin is priced in fiat. When broad fiat liquidity expands, risk appetite and nominal valuation support typically improve for scarce assets.
- Q: Can Bitcoin hit a new ATH if M2 is shrinking?
- A: It is historically less likely in sustained contraction regimes, but not impossible. Treat shrinking M2 as a headwind rather than a hard rule.
- A: It is historically less likely in sustained contraction regimes, but not impossible. Treat shrinking M2 as a headwind rather than a hard rule.
- Q: Will the next halving trigger a bull market?
- A: It is more likely to produce a durable bull market if it coincides with, or is preceded by, improving liquidity conditions.
- A: It is more likely to produce a durable bull market if it coincides with, or is preceded by, improving liquidity conditions.
Related guides
- Overview: The 4-Year Bitcoin Cycle: Definition, Mechanics & Historical Evidence
- Confirmations: Bitcoin Funding Rates: Definition, Formula & Cycle Signals
- Confirmations: Bitcoin Open Interest & Leverage Ratio
- On-chain sentiment: Bitcoin LTH vs STH: Supply Dynamics, Cost Basis & Market Structure
- Top signals: Bitcoin VDD Multiple: Cycle Top Signals & Probability Zones
Minimal conclusion
- The 4-year cycle has mutated: structural demand (ETFs) and fiat liquidity (M2) increasingly dictate outcomes, compressing post-halving ROI.
- A halving during a liquidity drain (contracting M2) does not prevent deep bear markets.
- For modern cycles, track liquidity regimes alongside on-chain metrics.
- Next step: Learn how to track "smart money" exits during macro tops with Coin Days Destroyed (CDD) & Liveliness: Definition, Formula & Cycle Signals.