
NUPL (Net Unrealized Profit/Loss) is one of the key on-chain indicators for determining the phase of the Bitcoin market cycle and measuring overall market sentiment. In this guide, we'll cover how NUPL is calculated, how to interpret its values, and how to apply it in trading strategies.
TL;DR
- What it measures: The proportion of unrealized profit/loss relative to market capitalization
- How to read it: NUPL > 0 = market in profit, NUPL < 0 = market in loss
- Key zones: < -0.25 (capitulation), -0.25–0 (fear), 0–0.25 (hope/fear), 0.25–0.50 (optimism), 0.50–0.75 (greed), > 0.75 (euphoria)
- What it does NOT do: Does not provide precise timing and is not a standalone buy/sell signal
- Confirmation indicators: STH SOPR, Funding Rate, Exchange Netflow
What Is NUPL?
NUPL shows the proportion of unrealized profit or loss relative to Bitcoin's market capitalization. Essentially, it's a "market sentiment" indicator that measures what portion of market value represents participants' "paper profit."
Formula:
NUPL = (Market Cap - Realized Cap) / Market Cap
Or in alternative notation:
NUPL = 1 - (Realized Cap / Market Cap) = 1 - (1 / MVRV)
Where:
- Market Cap — current market capitalization (price × number of coins)
- Realized Cap — sum of all UTXOs valued at their last movement price
Why Is NUPL Important?
NUPL transforms absolute profit/loss values into a relative metric, which allows you to:
- Compare different cycles on a unified scale
- Identify psychological market phases (fear, hope, euphoria)
- Detect extremes that historically coincided with cycle tops and bottoms
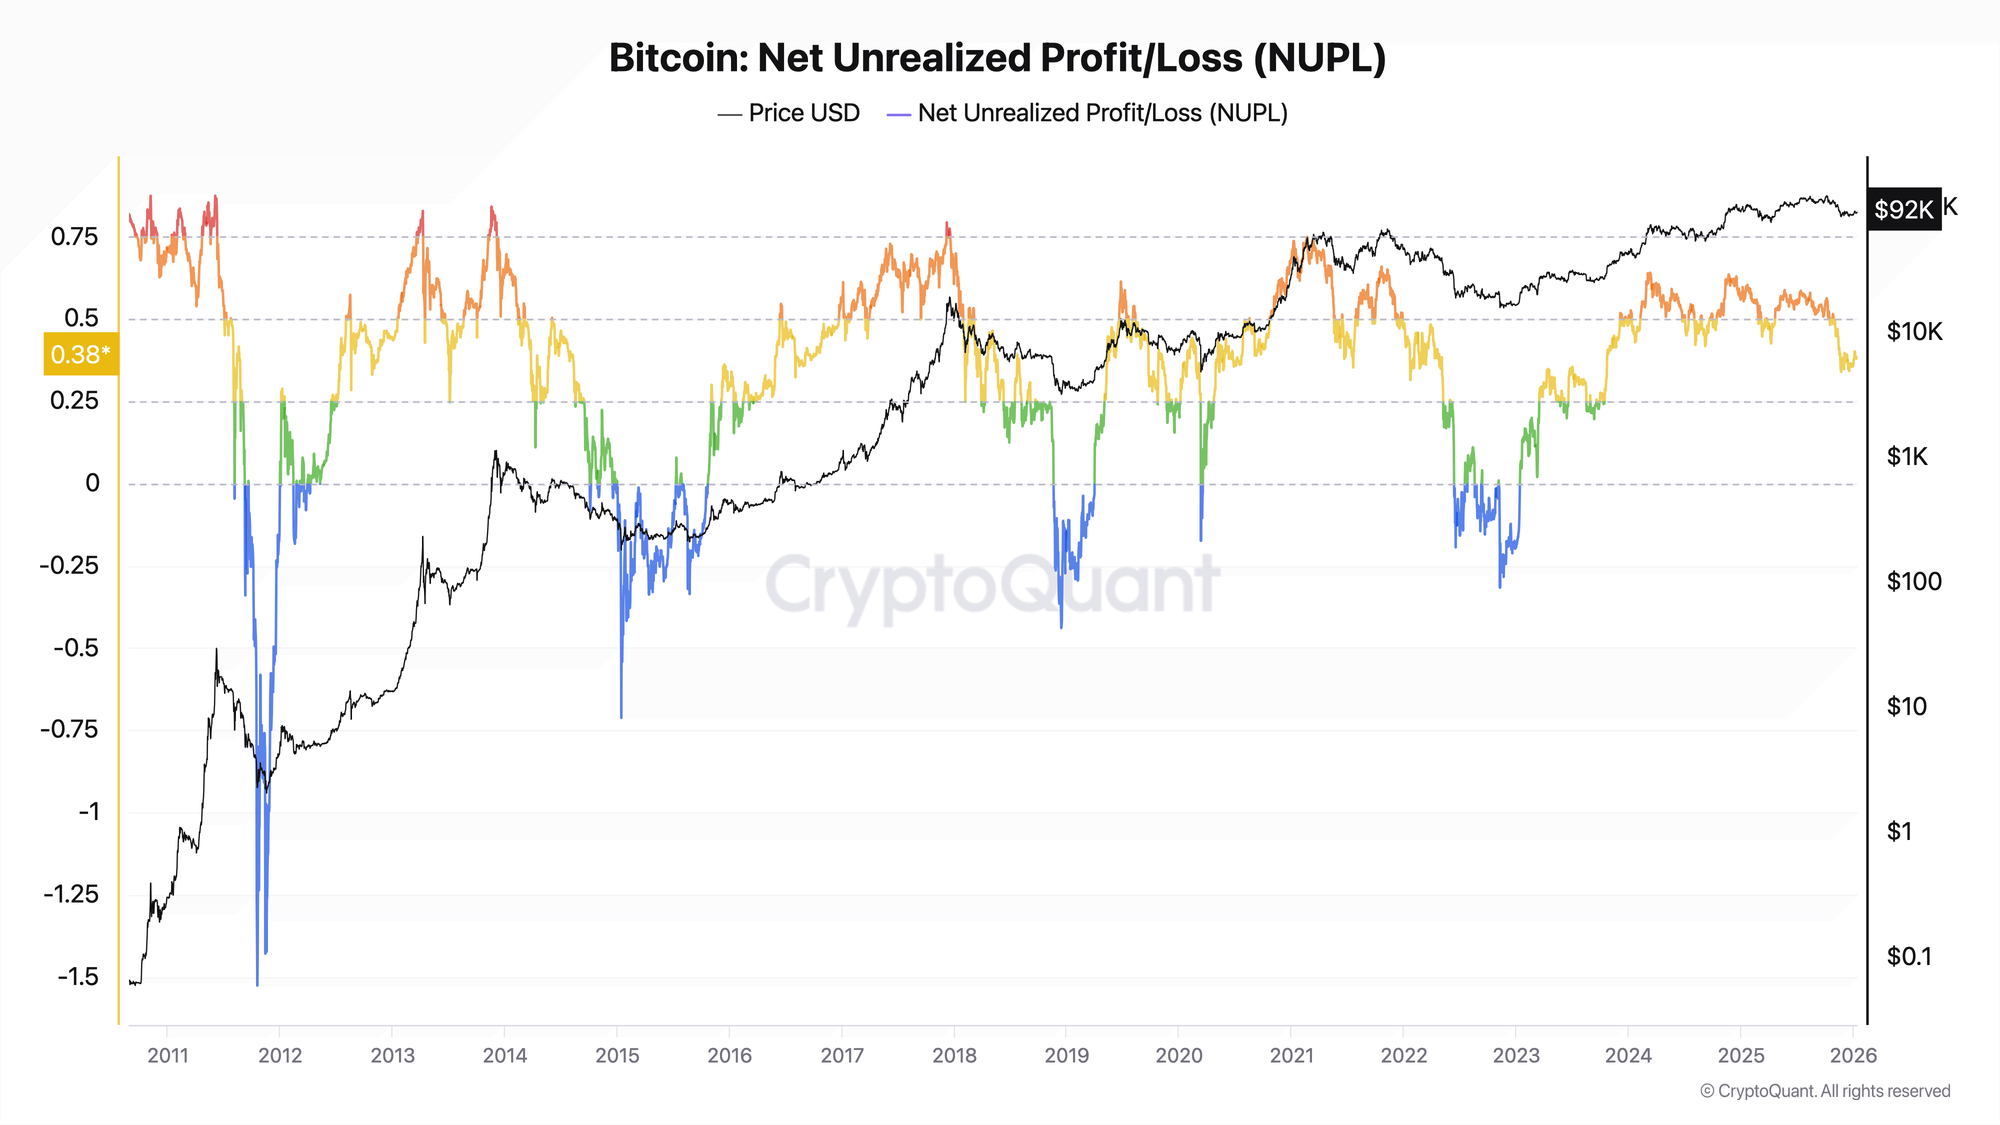
Historical range: In practice, under mature market conditions (since 2015), NUPL has fluctuated roughly between -0.7 and +0.8. In Bitcoin's early years (2009–2011), the metric showed more extreme values due to low market liquidity. Mathematically, NUPL's lower bound is not fixed.
Data sources:
- Glassnode — original source of the metric
- CryptoQuant — alternative provider
- LookNode — free charts
- Bitcoin Magazine Pro — free access
How NUPL Is Calculated
Step 1: Calculate Market Capitalization (Market Cap)
Market Cap = Current BTC Price × Circulating Supply
Example: At a price of $100,000 and 19.8M BTC: Market Cap = $1.98 trillion
Step 2: Calculate Realized Capitalization (Realized Cap)
For each UTXO, the price at the time of last movement is determined:
Realized Cap = Σ (UTXO_amount × Price_at_last_movement)
Example: With Realized Cap = $800 billion
Step 3: Calculate Unrealized Profit/Loss
Unrealized Profit/Loss = Market Cap - Realized Cap
                       = $1.98 trillion - $800 billion
                       = $1.18 trillion (unrealized profit)
Step 4: Normalize to Market Cap
NUPL = $1.18 trillion / $1.98 trillion = 0.596 (59.6%)
Process visualization:
[Market Cap: $1.98T] - [Realized Cap: $800B] = Unrealized P/L ($1.18T)
                              ↓
              NUPL = $1.18T / $1.98T = 0.596
                              ↓
        ~60% of market capitalization = unrealized profit
                              ↓
                    Market phase: "Greed"
Relationship Between NUPL and MVRV
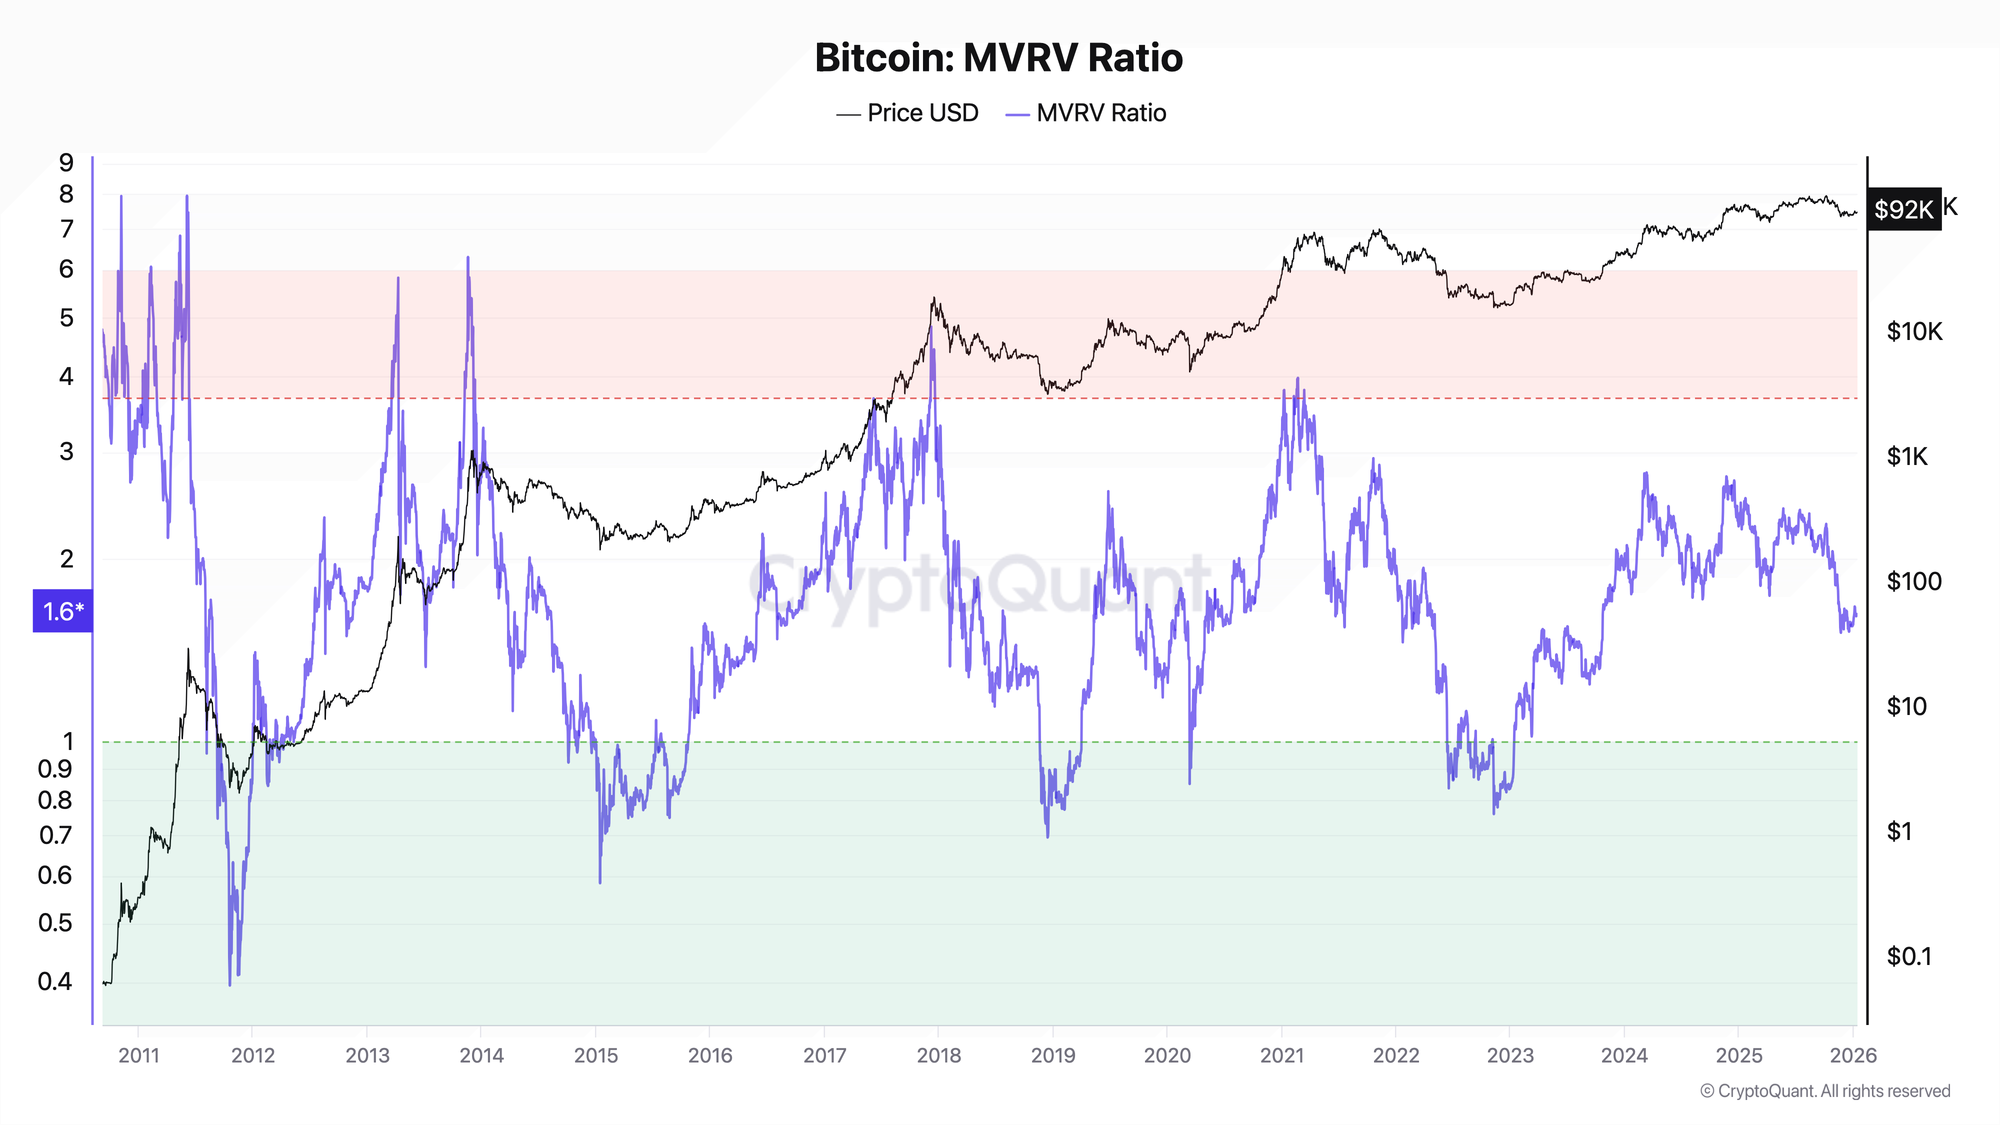
NUPL and MVRV are mathematically linked and show the same information in different formats:
Conversion formula:
NUPL = 1 - (1 / MVRV)
Correspondence table:
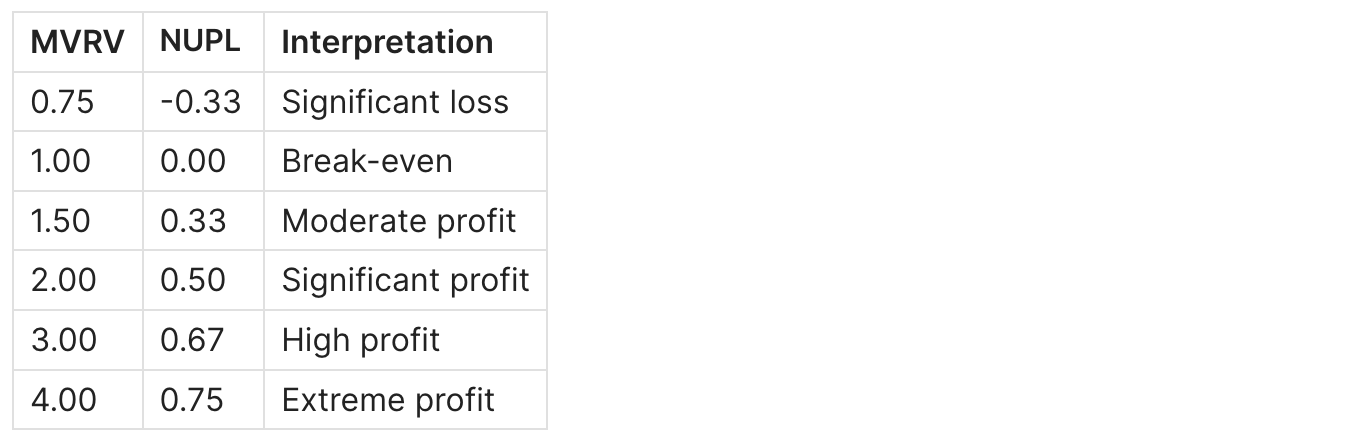
Note: For the mature BTC market (since 2015), practical NUPL extremes typically ranged from approximately -0.7 to +0.8.
When to Use NUPL Instead of MVRV?
NUPL is better for:
- Visualizing market sentiment (phase names are intuitive)
- Analysis in percentage terms
- Comparison with classic sentiment indicators
MVRV is better for:
- Understanding the multiplier relative to cost basis
- Quantitative trading systems
- Quick assessment of "how many times the market is overvalued"
Read more about MVRV in the guide Bitcoin MVRV Ratio: What It Is and How to Use It.
How to Interpret NUPL Values
NUPL Zones and Psychological Market Phases
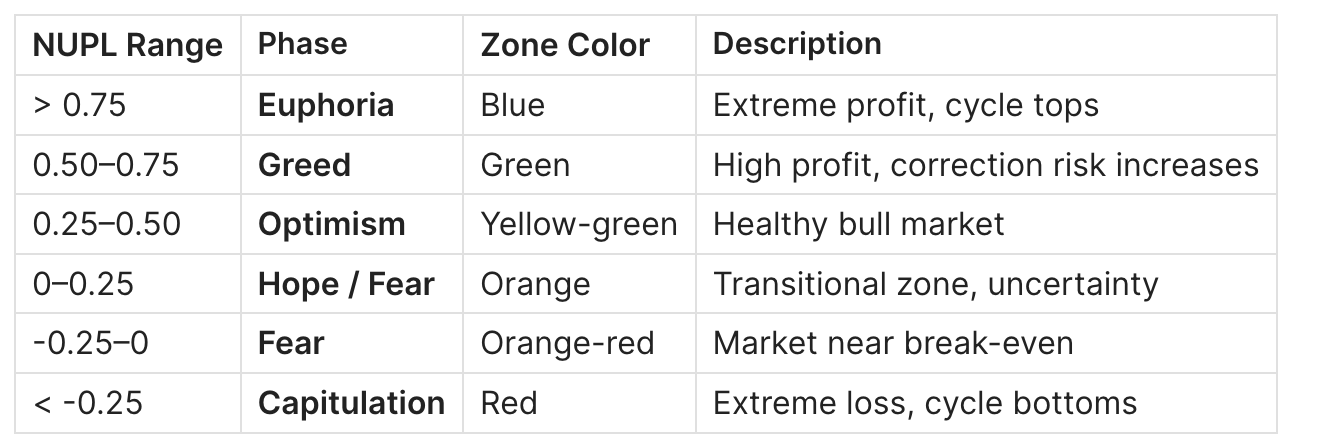
Note: Zone names are an interpretive model, not a standard. Different analysts may use other names and boundaries.
NUPL > 0.75 — Euphoria
What it means:
- More than 75% of market capitalization is unrealized profit
- Virtually all participants are in significant profit
- Historically coincides with cycle tops
Market context:
- Probability of increased distribution and volatility rises
- Media is full of optimism, newcomers enter at highs
- Elevated risk of sharp correction
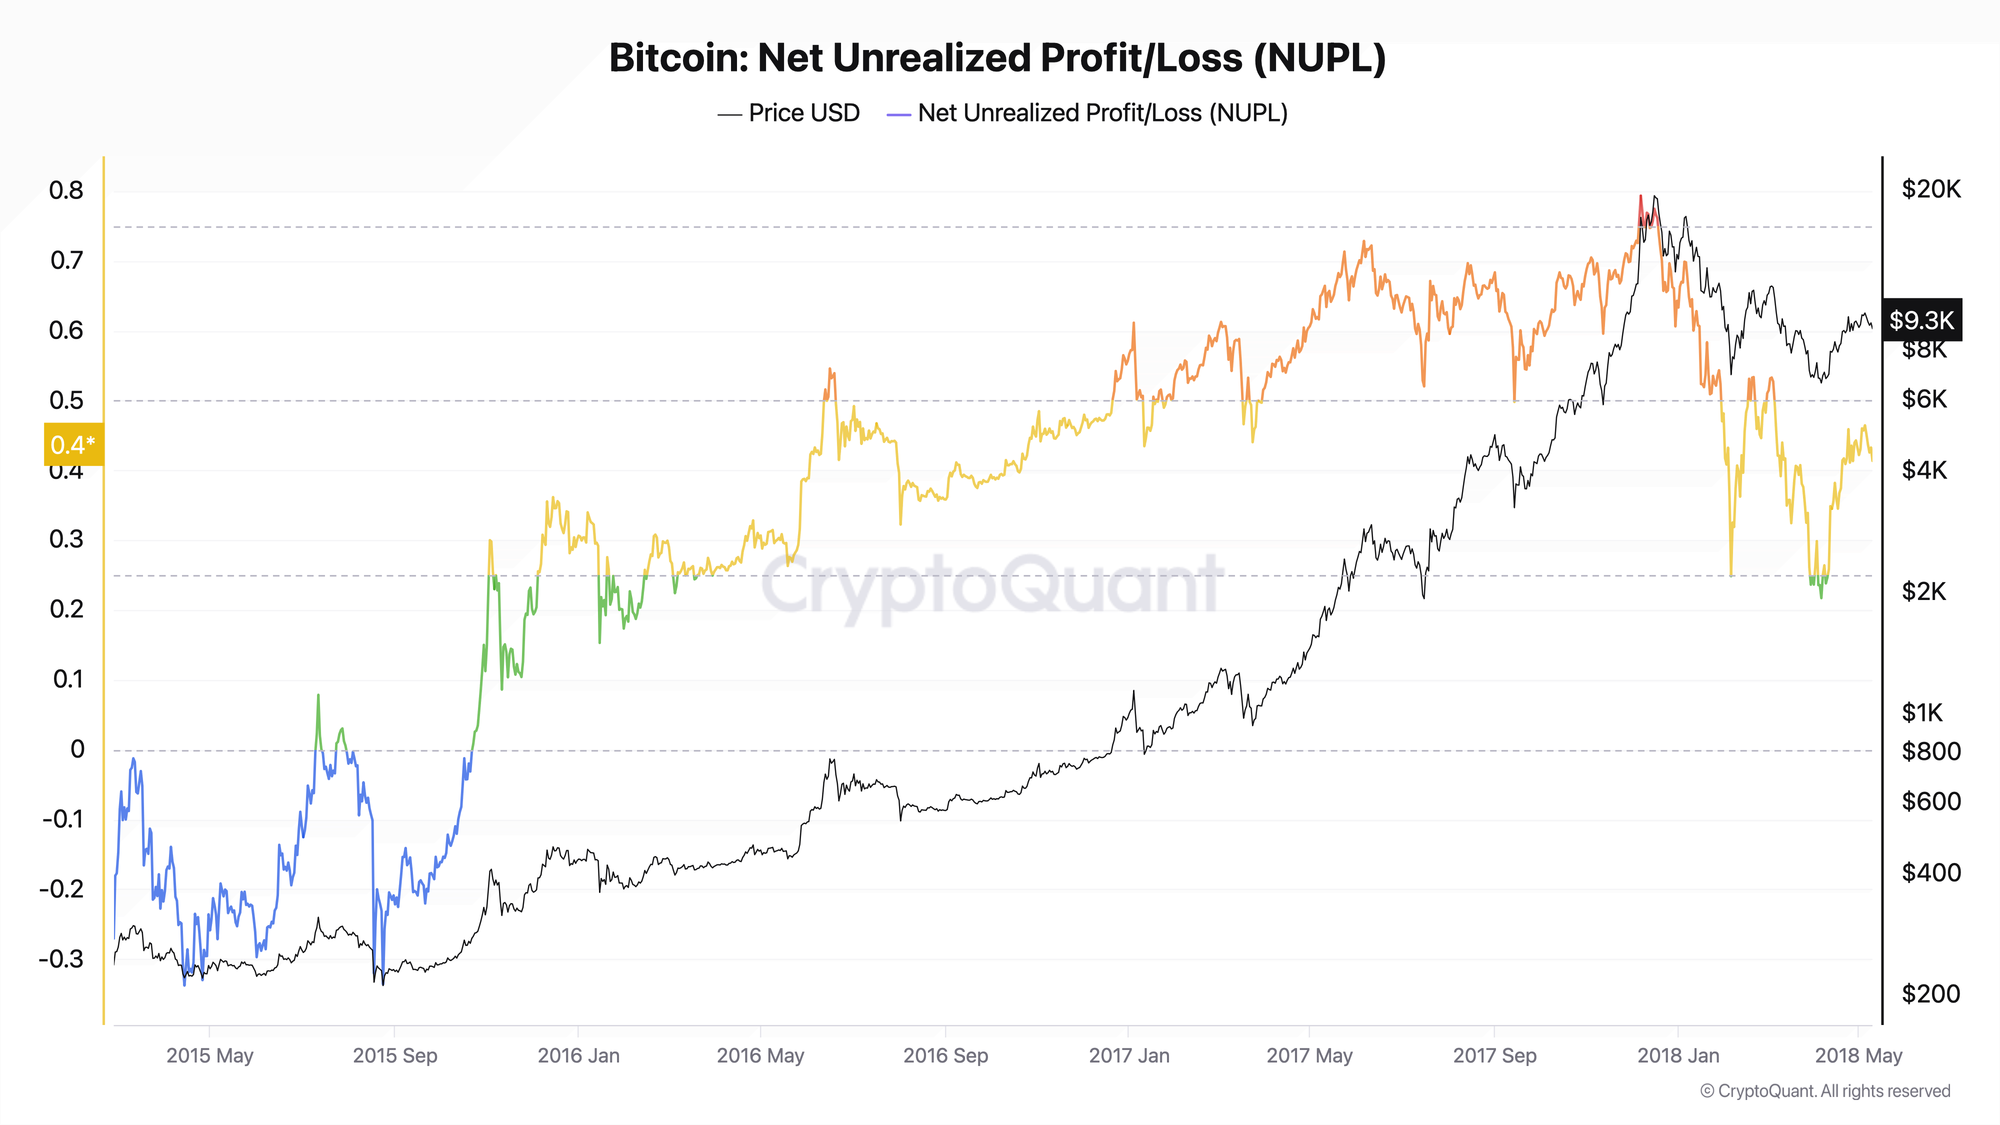
Historical NUPL peaks (CryptoQuant data, daily):
- November 2013: ~0.84 (early market, low liquidity — extreme higher than typical values)
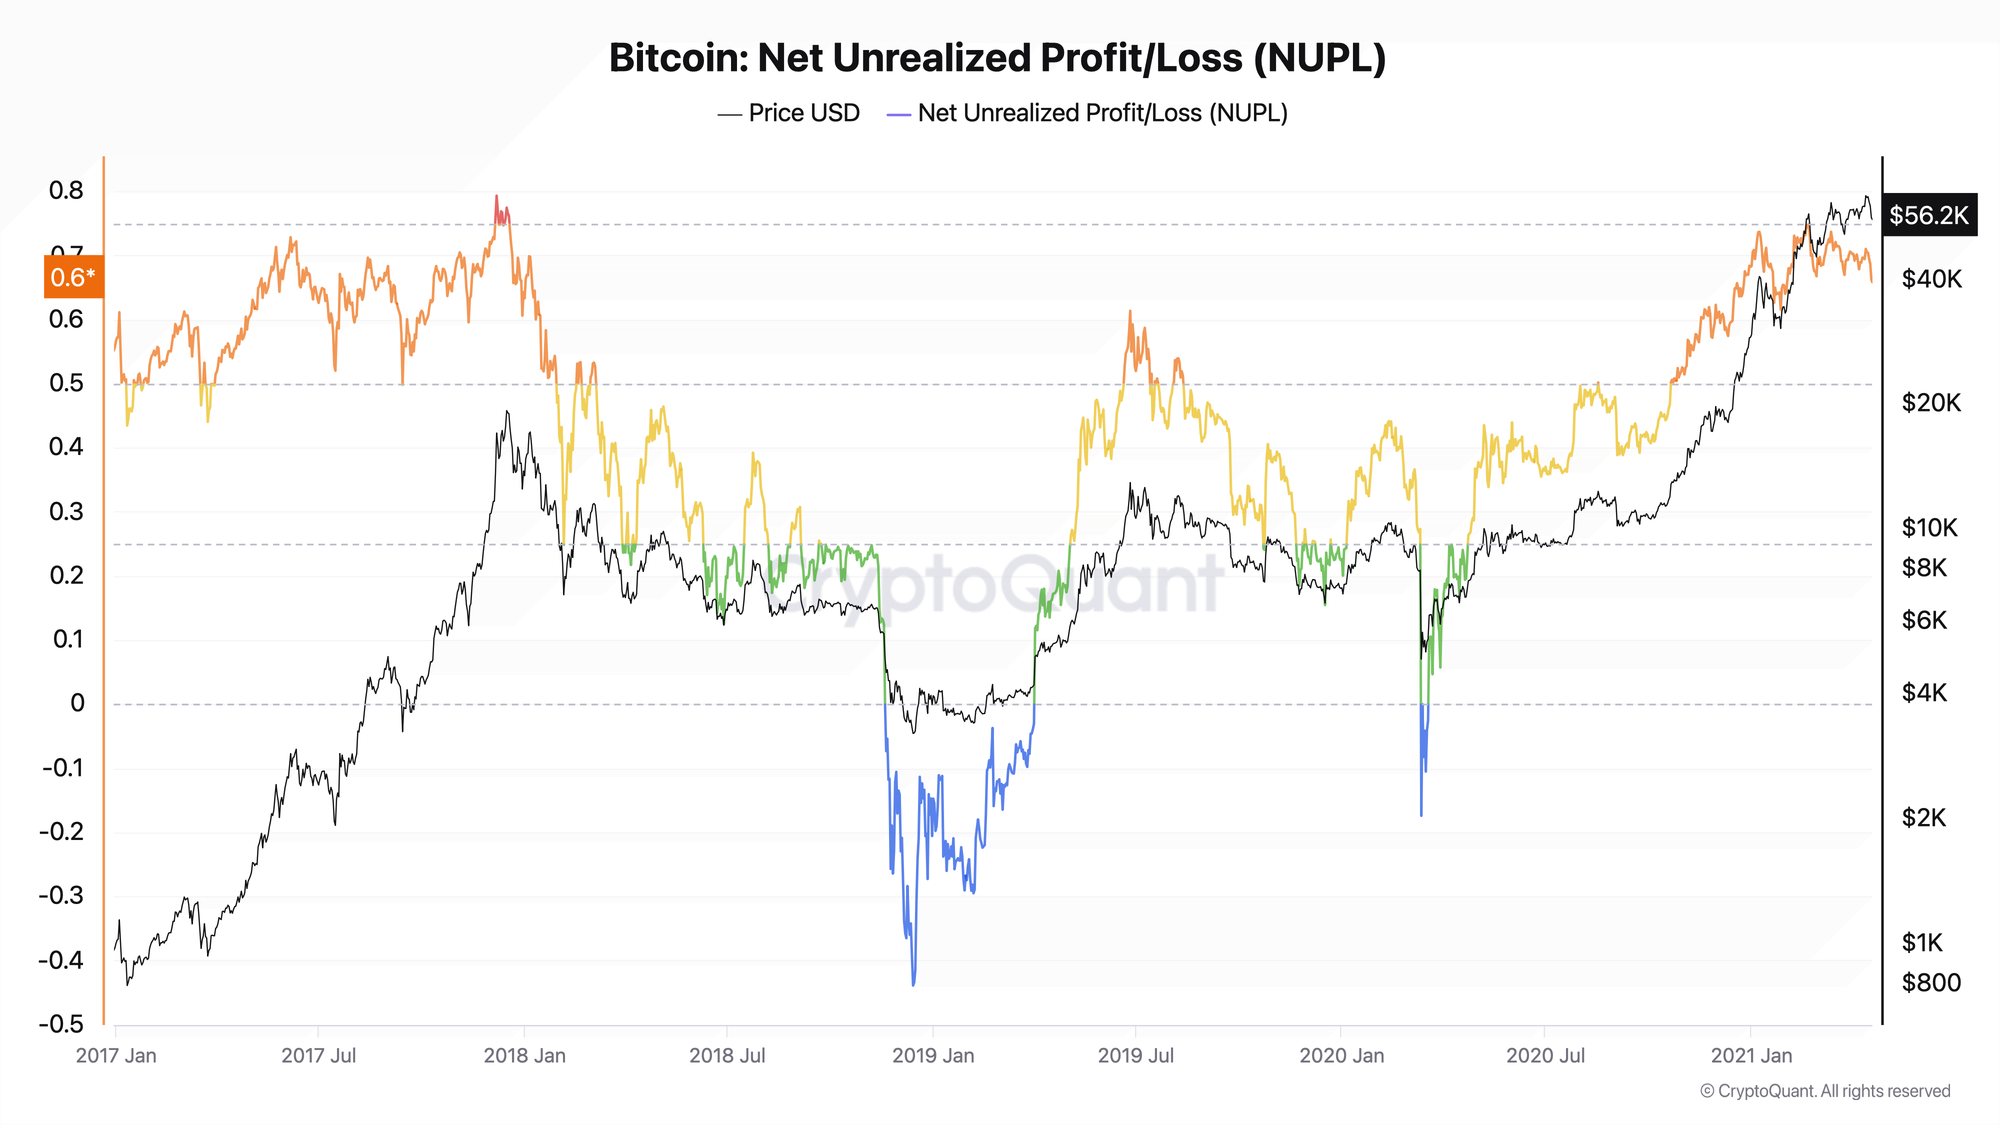
- December 2017: ~0.79
- February 2021: ~0.75
- October 2021: ~0.66
Note: Values may differ depending on data provider and calculation methodology.
NUPL 0.50–0.75 — Greed
What it means:
- 50–75% of market capitalization is unrealized profit
- Most participants are in good profit
- Market is at an advanced stage of the bull cycle
Market context:
- Optimal zone for partial profit-taking
- Corrections become more likely
- Long-term holders begin distribution
NUPL 0.25–0.50 — Optimism
What it means:
- 25–50% of market capitalization is unrealized profit
- Healthy bull market state
- Balance between buyers and sellers
Market context:
- Typical state during active bull trend stage
- Bull market corrections often find support in this zone
- Good zone for holding positions
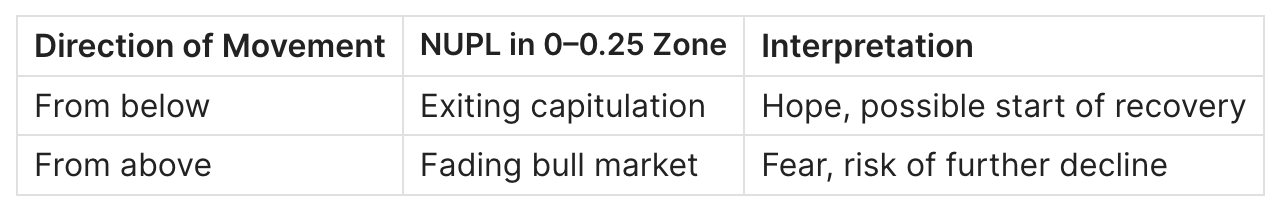
NUPL 0–0.25 — Hope / Fear
What it means:
- 0–25% of market capitalization is unrealized profit
- Market near break-even point
- Transitional phase with high uncertainty
Market context:
NUPL from -0.25 to 0 — Fear
What it means:
- Market in slight aggregate loss
- Average participant near break-even or slightly "underwater"
- Tense state, but not yet capitulation
Market context:
- Often precedes either an upward reversal or deepening decline
- Critical zone for observing STH and LTH behavior
- Bull market corrections can reach this zone
NUPL < -0.25 — Capitulation
What it means:
- Market in significant aggregate loss
- Realized Cap substantially exceeds Market Cap
- Average participant is "deeply underwater"
Market context:
- Historically rare state (occurs only at cycle bottoms)
- Potentially attractive zone for long-term investors
- Long-term holders (high-conviction cohort) have historically accumulated in these zones
Historical NUPL minimums (CryptoQuant data, daily):
- January 2015: ~-0.71
- December 2018: ~-0.44
- November 2022: ~-0.32
Note: Values may differ significantly between Glassnode and CryptoQuant due to different methodologies.
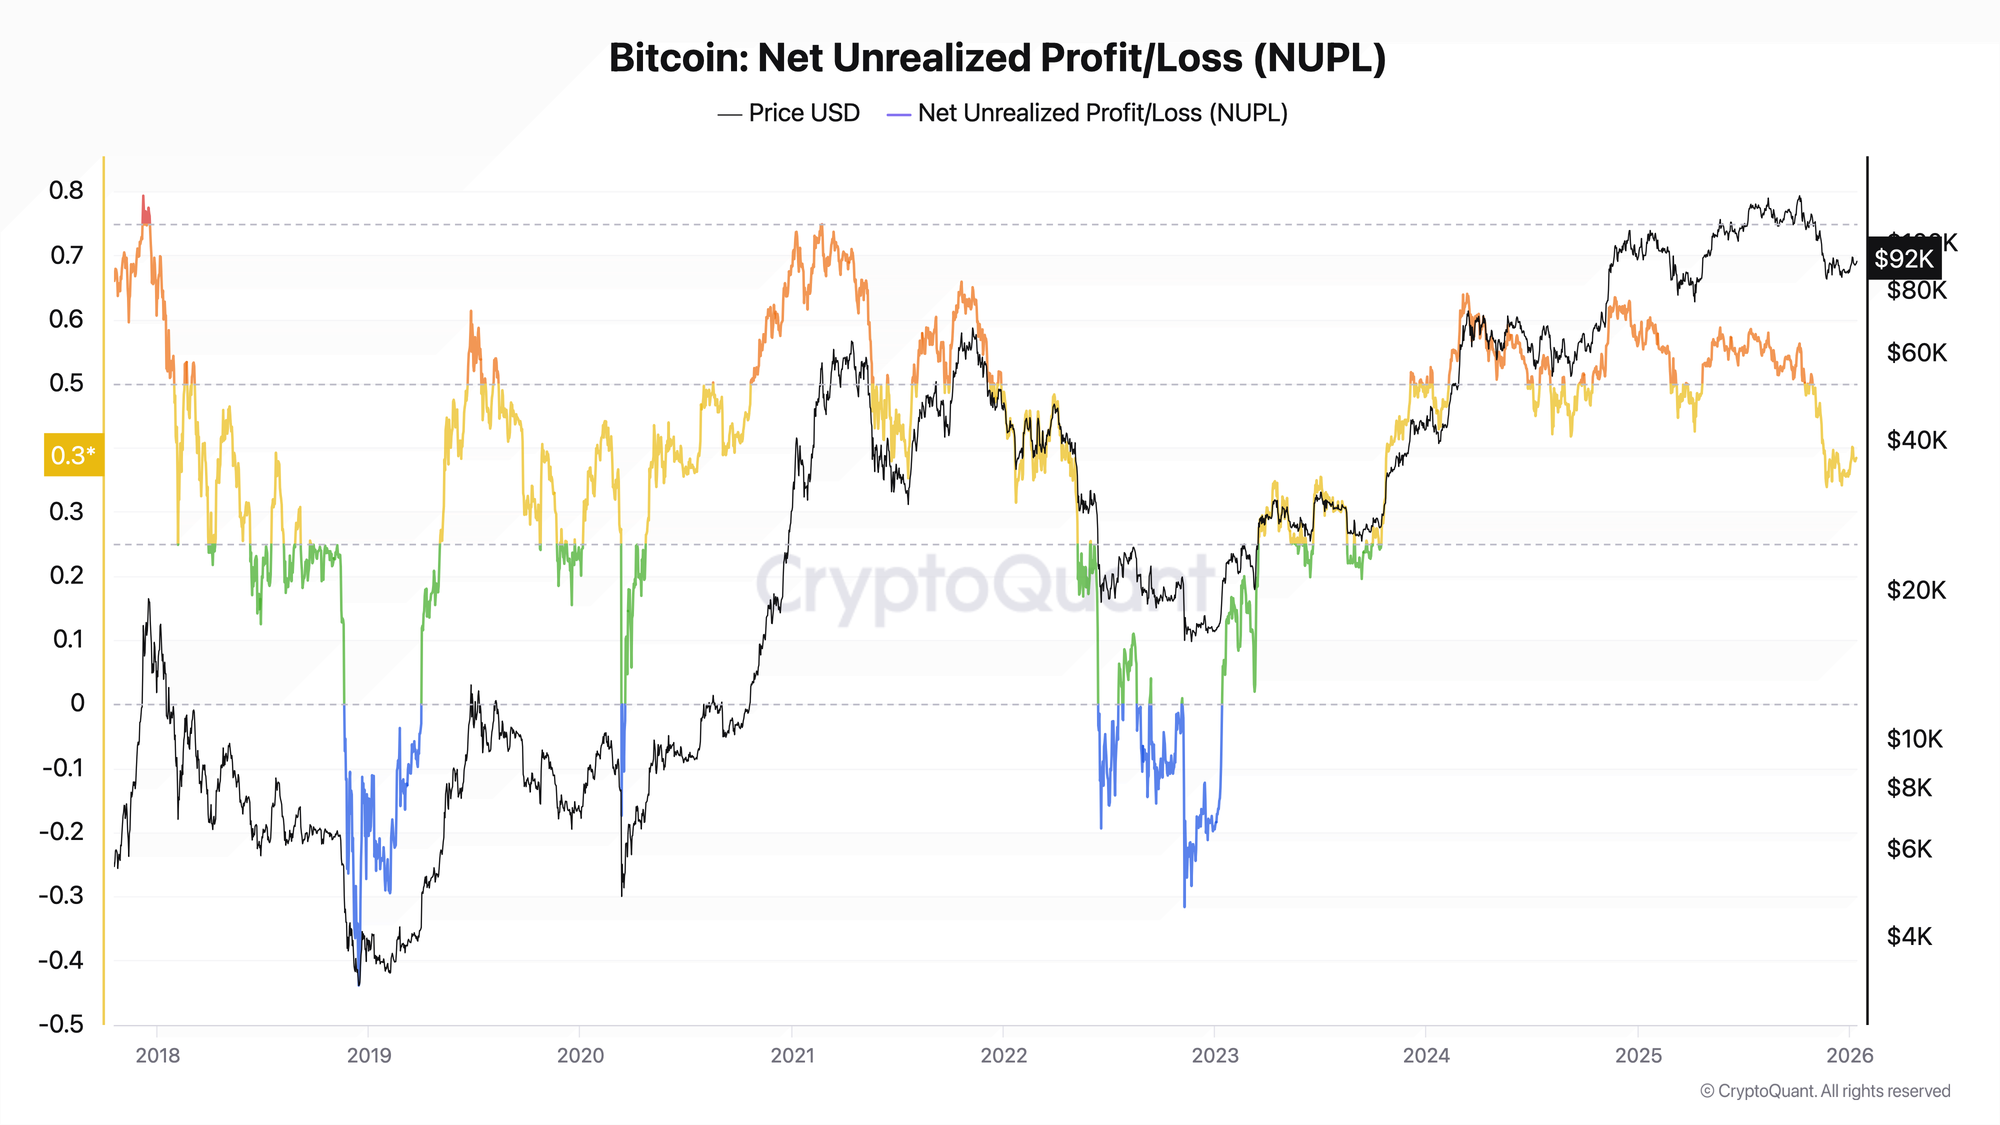
NUPL Trading Signals
Historical Example 1: 2017 Top
Situation: December 2017, BTC reaches $20,000
NUPL behavior:
- NUPL reached ~0.79 (December 7)
- Remained in euphoria zone for several weeks
- Retail investors were entering en masse at highs
Result: An 84% correction to $3,200 followed.
Conclusion: NUPL zones above 0.75 have historically coincided with late bull market stages and elevated risk of major corrections.
Historical Example 2: 2018–2019 Bottom
Situation: December 2018, BTC falls to $3,200
NUPL behavior:
- NUPL dropped to ~-0.44 (December 14)
- Remained in negative territory for about 4 months
- Long-term holders were actively accumulating
Result: A multi-fold increase (~15–20x) to $64,000 by April 2021 followed.
Conclusion: Negative NUPL values have historically coincided with attractive zones for long-term accumulation, although precise bottom timing requires confirmation from other indicators.
Historical Example 3: 2021 Double Top
Situation: February and November 2021
NUPL behavior:
- February 2021: NUPL reached ~0.75 at ~$58,000 level
- Correction to $29,000, NUPL dropped to ~0.40
- October 2021: NUPL reached only ~0.66 at $69,000 (divergence)
Conclusion: Declining NUPL peak values while price rises is a possible sign of cycle weakening. A second top with lower NUPL may signal macro-top formation.
Historical Example 4: FTX Capitulation 2022
Situation: November 2022, FTX collapse
NUPL behavior:
- NUPL dropped to ~-0.32 (November 9)
- Quick spike down and recovery
- Panic was acute but short-lived
Result: Cycle bottom formation around $15,500, subsequent rise to $70,000+.
Conclusion: Sharp NUPL drops into negative territory during force majeure events have historically created attractive entry points for long-term investors.
Practical Application
Buy signal:
- NUPL falls below 0 or into the -0.25–0 zone
- Confirmation: STH SOPR < 1, negative Funding Rate
- Extended time in negative zone (weeks-months) strengthens the signal
Caution/sell signal:
- NUPL reaches 0.70+ zone and above
- Confirmation: LTH distributing, high Open Interest
- Divergence (price rises, NUPL doesn't make new highs)
NUPL by Holder Cohorts
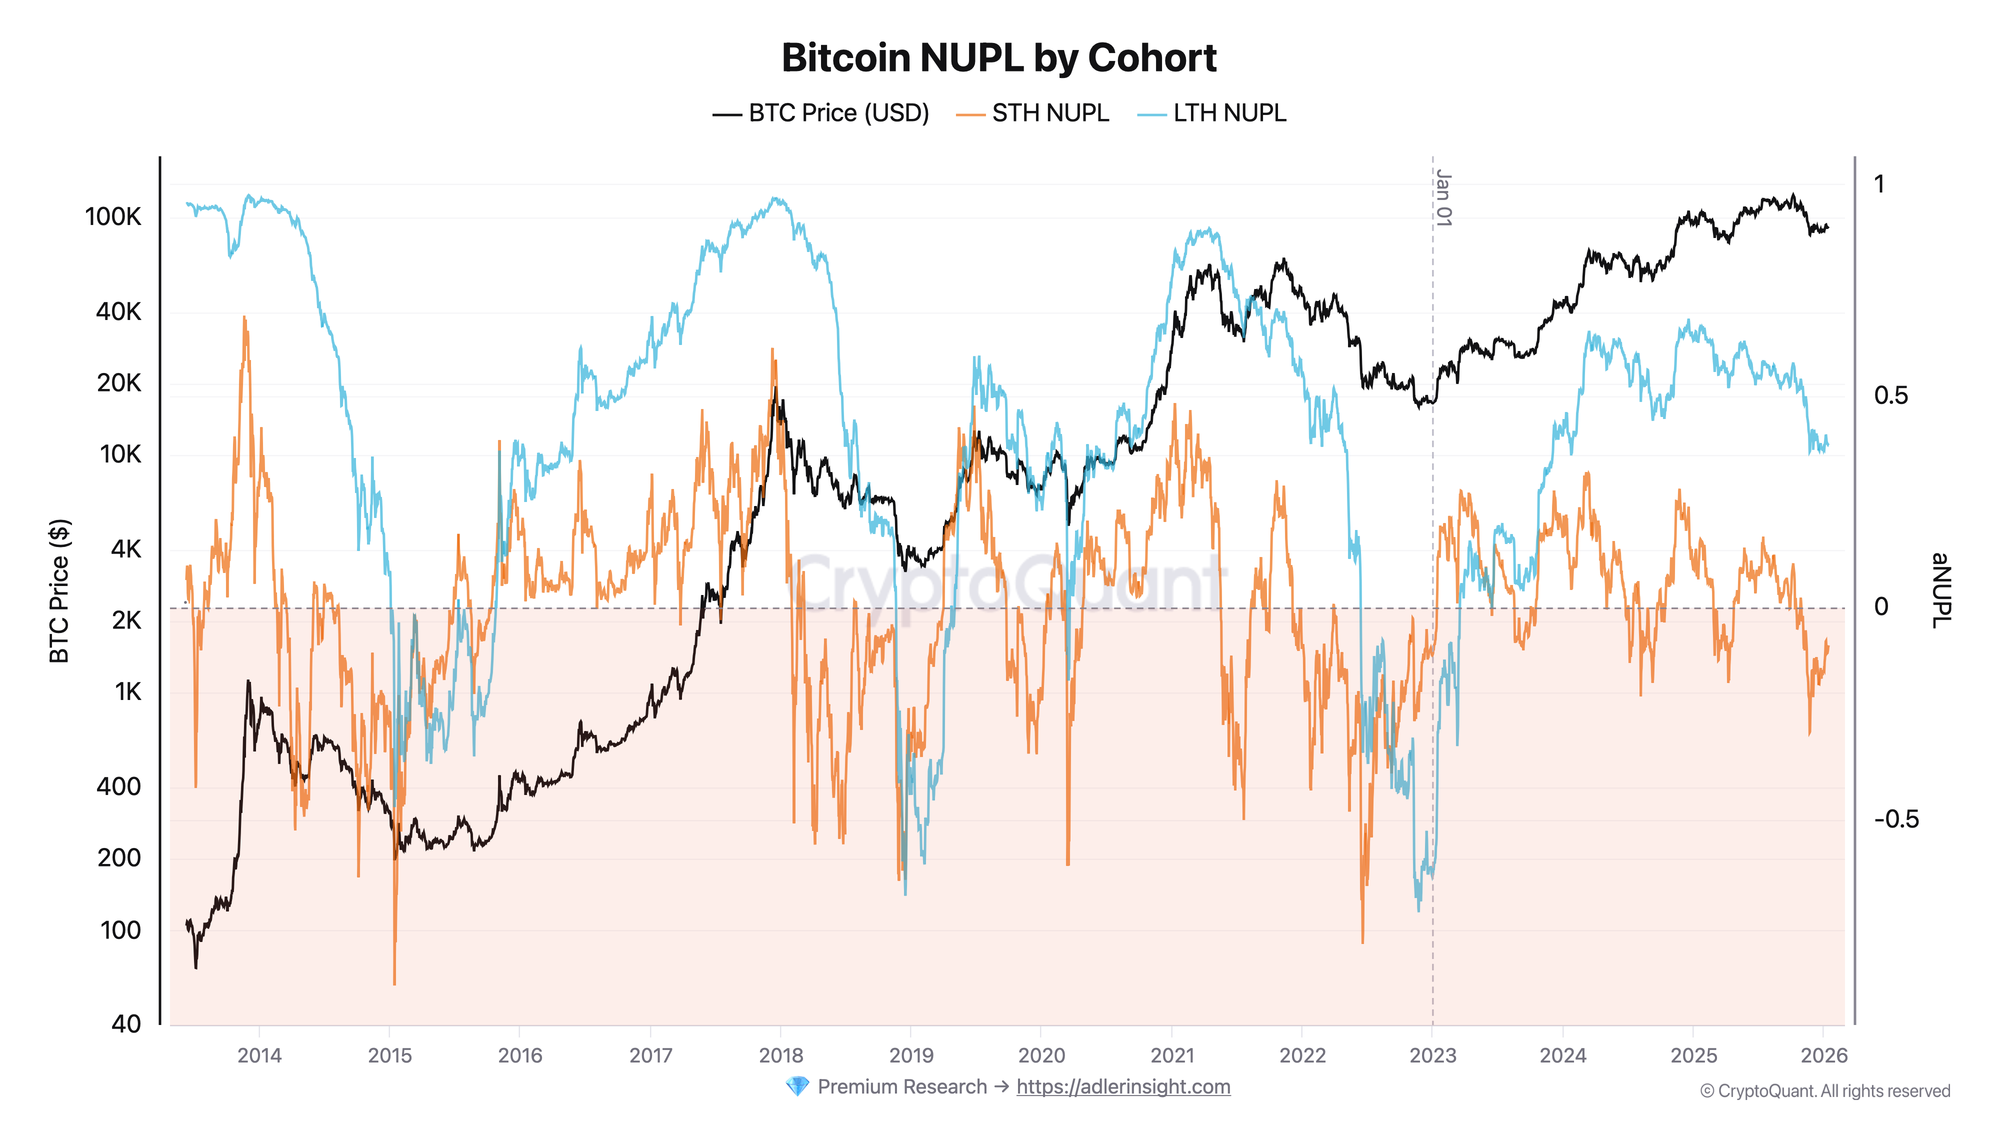
In addition to overall NUPL, there are versions of the metric for different participant categories:
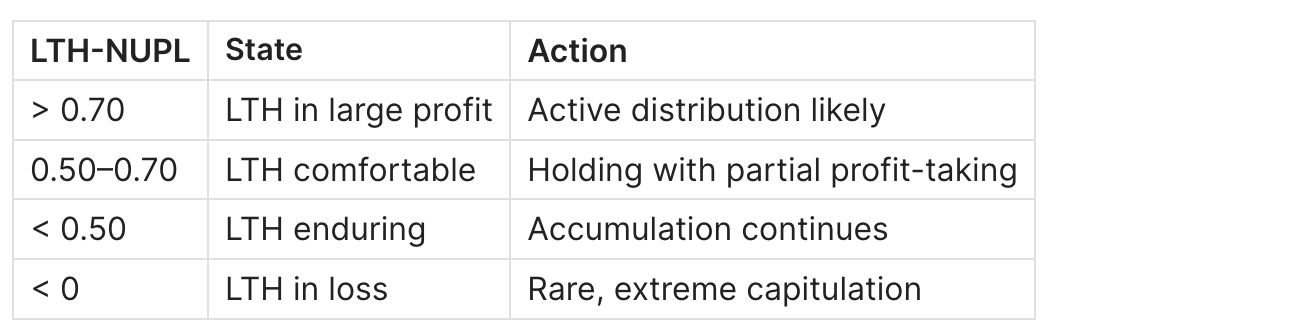
LTH-NUPL (Long-Term Holder NUPL)
What it shows: Unrealized profit/loss of long-term holders (coins older than 155 days).
Features:
- Less volatile than overall NUPL
- Shows sentiment of long-term participants
- Extremes form earlier than price extremes
Interpretation:
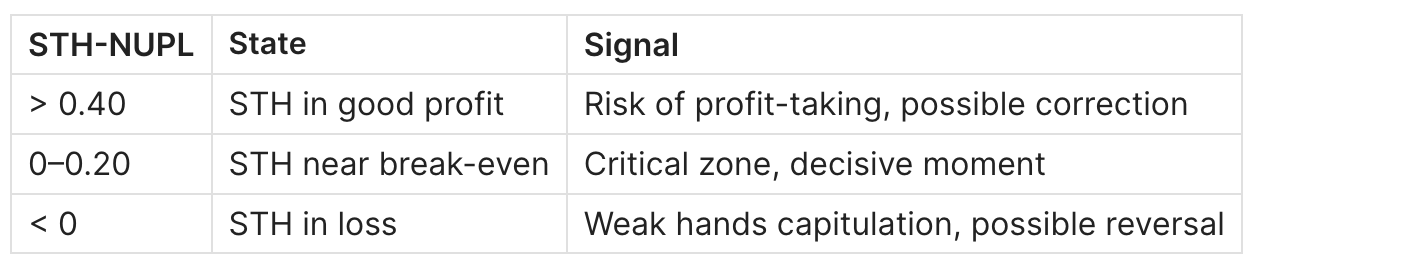
STH-NUPL (Short-Term Holder NUPL)
What it shows: Unrealized profit/loss of short-term holders (coins younger than 155 days).
Features:
- Highly volatile
- Reacts to every price movement
- Good indicator of short-term sentiment
Interpretation:
Combined Cohort Analysis
The strongest signals occur when indicators diverge:
LTH-NUPL high + STH-NUPL dropping < 0
= LTH distributing to newcomers at the top
→ Bearish signal

LTH-NUPL stable + STH-NUPL rising from negative values
= LTH holding, new buyers entering cheap
→ Bullish signal
NUPL vs MVRV vs Realized Price Bands
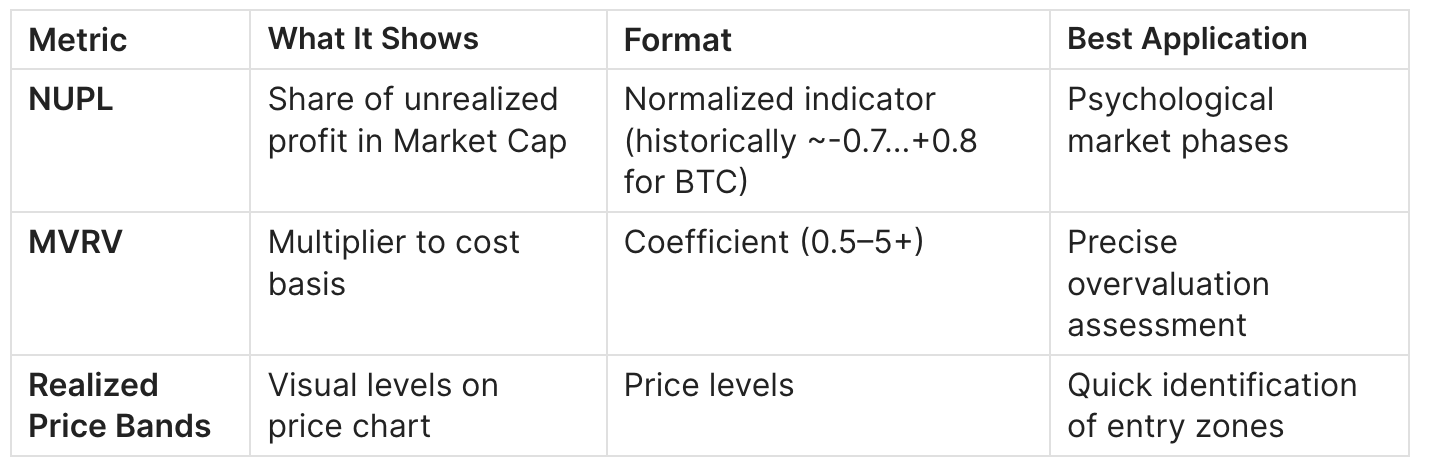
When to Use Which
NUPL is better for:
- Determining psychological market phase
- Comparing cycles on a unified scale
- Analyzing sentiment in percentage terms
- Building sentiment indicators
MVRV is better for:
- Quantitative trading systems
- Quick assessment of "how many times the market is overvalued"
- Calculating target levels (e.g., "waiting for MVRV 3.5")
Realized Price Bands are better for:
- Visual analysis on price charts
- Determining specific entry/exit price levels
- Quick assessment without calculations
Combined Analysis
All three metrics are mathematically linked:
NUPL = 0.50 ←→ MVRV = 2.0 ←→ Price = 2.0× Realized Price
NUPL = 0.00 ←→ MVRV = 1.0 ←→ Price = Realized Price
NUPL = -0.50 ←→ MVRV = 0.67 ←→ Price = 0.67× Realized Price
The most reliable signals occur when all three metrics point in the same direction.
Read more about Realized Price Bands in the guide Bitcoin Realized Price Bands: What It Is and How to Use It.
NUPL Limitations
When the Indicator Doesn't Work
1. New market structures
- ETFs and institutions are changing cycle dynamics
- There's a tendency toward declining NUPL peak values from cycle to cycle (possible structural shift)
- Solution: adapt threshold values, follow research
2. Extended periods at extremes
- Market can remain in the "Greed" zone for months without correction
- NUPL > 0.6 doesn't mean immediate sell
- Solution: use as a risk filter, not precise timing
3. Different cycles — different thresholds
- Historical NUPL maximums are declining
- The "euphoria" threshold of 0.75+ may be difficult to reach in new cycles
- Solution: analyze relative changes rather than absolute values
4. Lost coins
- Realized Cap includes Satoshi's coins and lost keys
- This understates the real NUPL of active participants
- Solution: use adjusted versions (Adjusted NUPL)
Which Indicators to Combine With
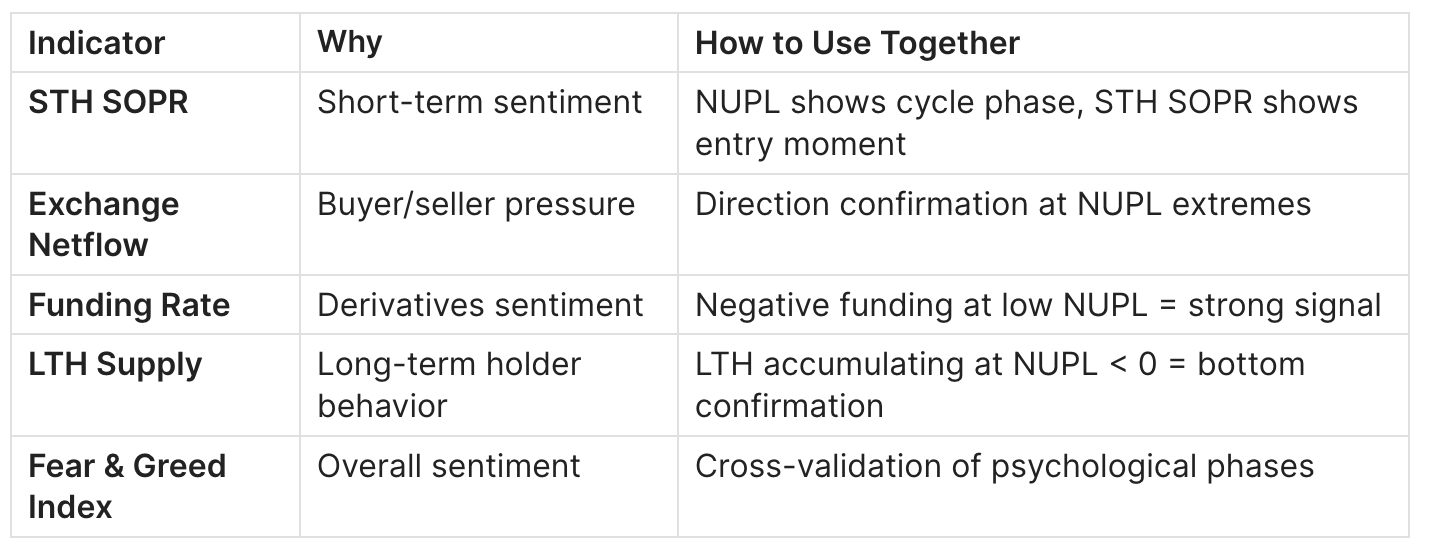
Read more about STH SOPR in the guide Bitcoin STH SOPR: What It Is and How to Use It.
Read more about Exchange Netflow in the guide Bitcoin Exchange Netflow: What It Is and How to Use It.
FAQ
What Is the Current NUPL Value?
NUPL changes dynamically. Current data is available on Glassnode, LookIntoBitcoin, and CryptoQuant.
Current NUPL analysis and other on-chain metrics are published in ADLER AM — daily morning briefs on the Bitcoin market. Detailed Bitcoin market analysis is published on Substack, subscribe via AdlerInsight.
Where to Find NUPL Data?
Free:
- LookNode — NUPL with zones
- Bitcoin Magazine Pro — basic charts
- CryptoQuant — requires registration
Paid (extended data):
- Glassnode Studio — from $39/month (NUPL by cohorts)
- CryptoQuant Pro — from $29/month
How Does NUPL Differ from MVRV?
NUPL and MVRV show the same information in different formats:
- MVRV — multiplier (how many times the market is valued above cost basis)
- NUPL — profit share as a percentage of market capitalization
Linking formula: NUPL = 1 - (1/MVRV)
The choice depends on preference: NUPL is more intuitive for understanding sentiment, MVRV — for quantitative analysis.
Why Do NUPL Peaks Decline Each Cycle?
There's a tendency toward declining NUPL peak values. Possible reasons:
- Market maturation — participants take profits earlier
- Institutionalization — ETFs and corporations distribute risks
- More liquidity — market has become more efficient
- Realized Cap growth — more transactions at high prices in history
This is a possible structural shift requiring calibration of indicator threshold values.
How Reliable Is the Indicator?
NUPL is one of the most widely used macro-indicators for Bitcoin:
- Historically, NUPL zones > 0.70 coincided with late bull market stages and elevated risk of major corrections
- Negative NUPL values historically corresponded to attractive zones for long-term accumulation
- Works since 2011, but early data is less representative
Important to understand:
- NUPL is not a precise timing tool
- Signal requires confirmation (STH SOPR, Funding Rate, Exchange Flows)
- Threshold values may shift under new market conditions
- Different data providers give different values
Common Mistakes When Using NUPL
❌ "NUPL > 0.6 = time to sell" → Market can remain in the "Greed" zone for months. NUPL shows cycle phase, not reversal point.
❌ "NUPL < 0 = bottom is here" → Negative NUPL can last weeks and months. The 2018 bottom formed with NUPL from -0.44 to -0.20 over 4+ months.
❌ Looking only at absolute value → NUPL trend and divergences with price matter more. Price rises but NUPL doesn't make new highs — potential warning.
❌ Ignoring data source → Glassnode and CryptoQuant can show different values. Always specify provider when comparing.
❌ Using as the only indicator → NUPL is a filter for determining cycle phase, not a standalone trading system. Combine with short-term metrics.
Conclusion
NUPL is a useful tool for determining the psychological phase of the Bitcoin market cycle. Key principles:
- NUPL = share of unrealized profit. Shows what portion of market capitalization is participants' "paper profit"
- NUPL < 0 = capitulation zone. Historically coincided with attractive points for long-term accumulation, but doesn't guarantee immediate reversal
- NUPL > 0.70 = elevated risk zone. Requires caution but is not an automatic sell signal
- Psychological phases are intuitive. Zone names (Fear, Hope, Optimism, Greed) help quickly assess market state
- NUPL is linked to MVRV. Use whichever metric is more convenient for your analysis — they are mathematically equivalent
- Context matters more than absolute value. Watch NUPL trend and divergences, combine with STH SOPR, Exchange Netflow, and Funding Rate
- Adapt to new conditions. Market structures are changing (ETFs, institutions) — this is a possible structural shift requiring threshold value calibration
This material is for educational purposes only and is not investment advice.