


Over the past ten days, two profit-and-loss metrics have reversed in tandem as Bitcoin recovered to $78K. The 90-day realized profit-to-loss ratio returned above 1, while unrealized losses fell from 18% to 7%. Loss pressure has declined sharply, but the first signal has only just crossed the neutral threshold and still requires confirmation.
TL;DR
Loss realization is no longer dominant, while the volume of losses still embedded in the supply has also declined. Both metrics confirm that financial stress has eased, but the reversal still needs to prove sustainable.
Bitcoin Realized Profit/Loss Ratio
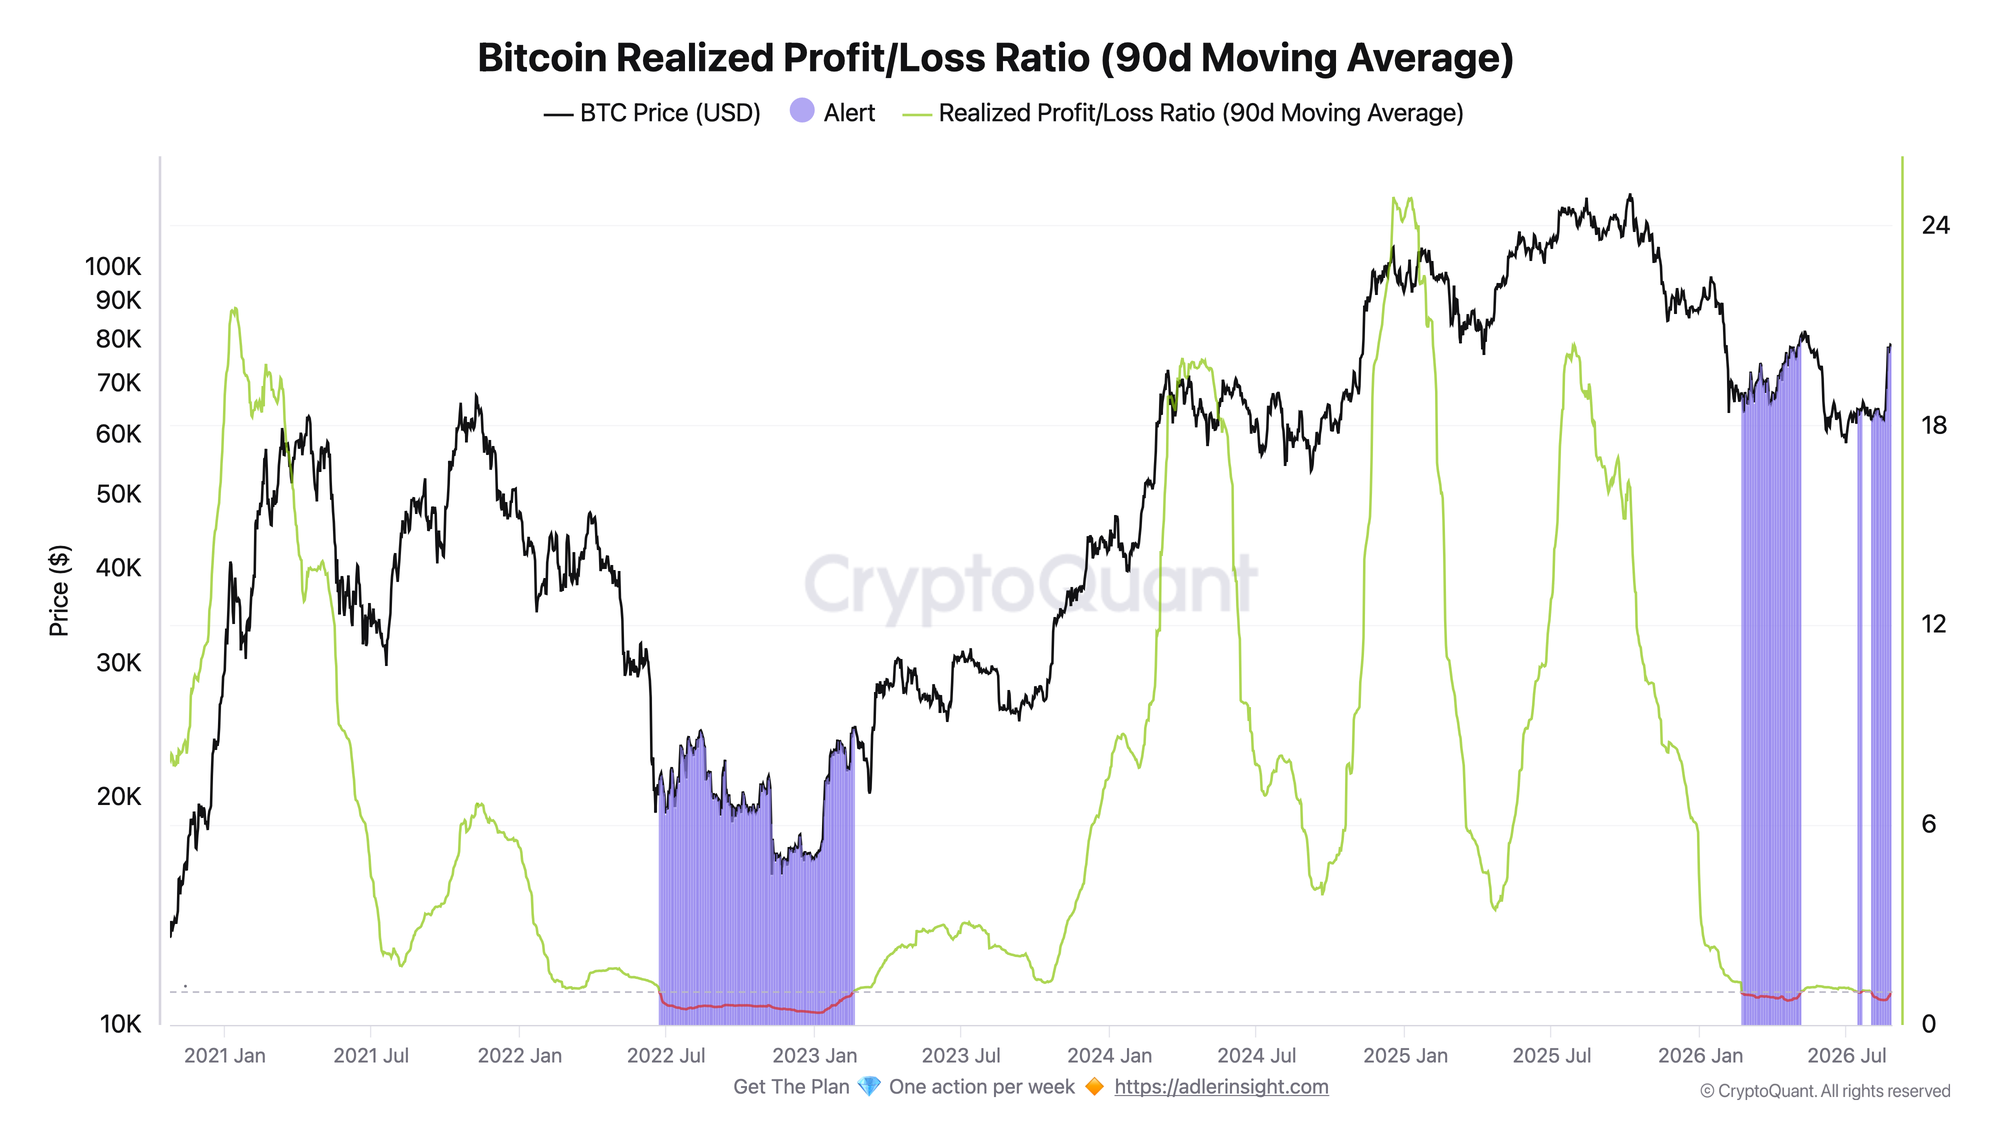
The metric compares realized profits with realized losses and smooths the ratio over 90 days. A reading above 1 means profit realization dominates, while a reading below 1 means loss realization dominates.
The ratio fell below 1 again on July 31 and remained there for 26 consecutive days. It bottomed on August 16 at 0.747, with Bitcoin trading at $62.8K. Bitcoin's subsequent recovery quickly shifted the balance: by August 25, the ratio had risen to 0.977, and on August 26 it moved back above the neutral threshold for the first time since late July, reaching 1.003 with Bitcoin at $78.9K.
This is an important transition because realized losses no longer exceed realized profits over the 90-day horizon. The current episode was also much milder than the 2022-2023 capitulation phase, when the ratio remained below 1 for 241 days and fell as low as 0.368.
The current reading is 1.003, almost exactly at the threshold. The move above 1 alone is therefore not strong confirmation of a new regime. The ratio must hold above the neutral level and continue rising instead of falling back into loss-dominated territory.
Bitcoin: Net Unrealized Loss (NUL)
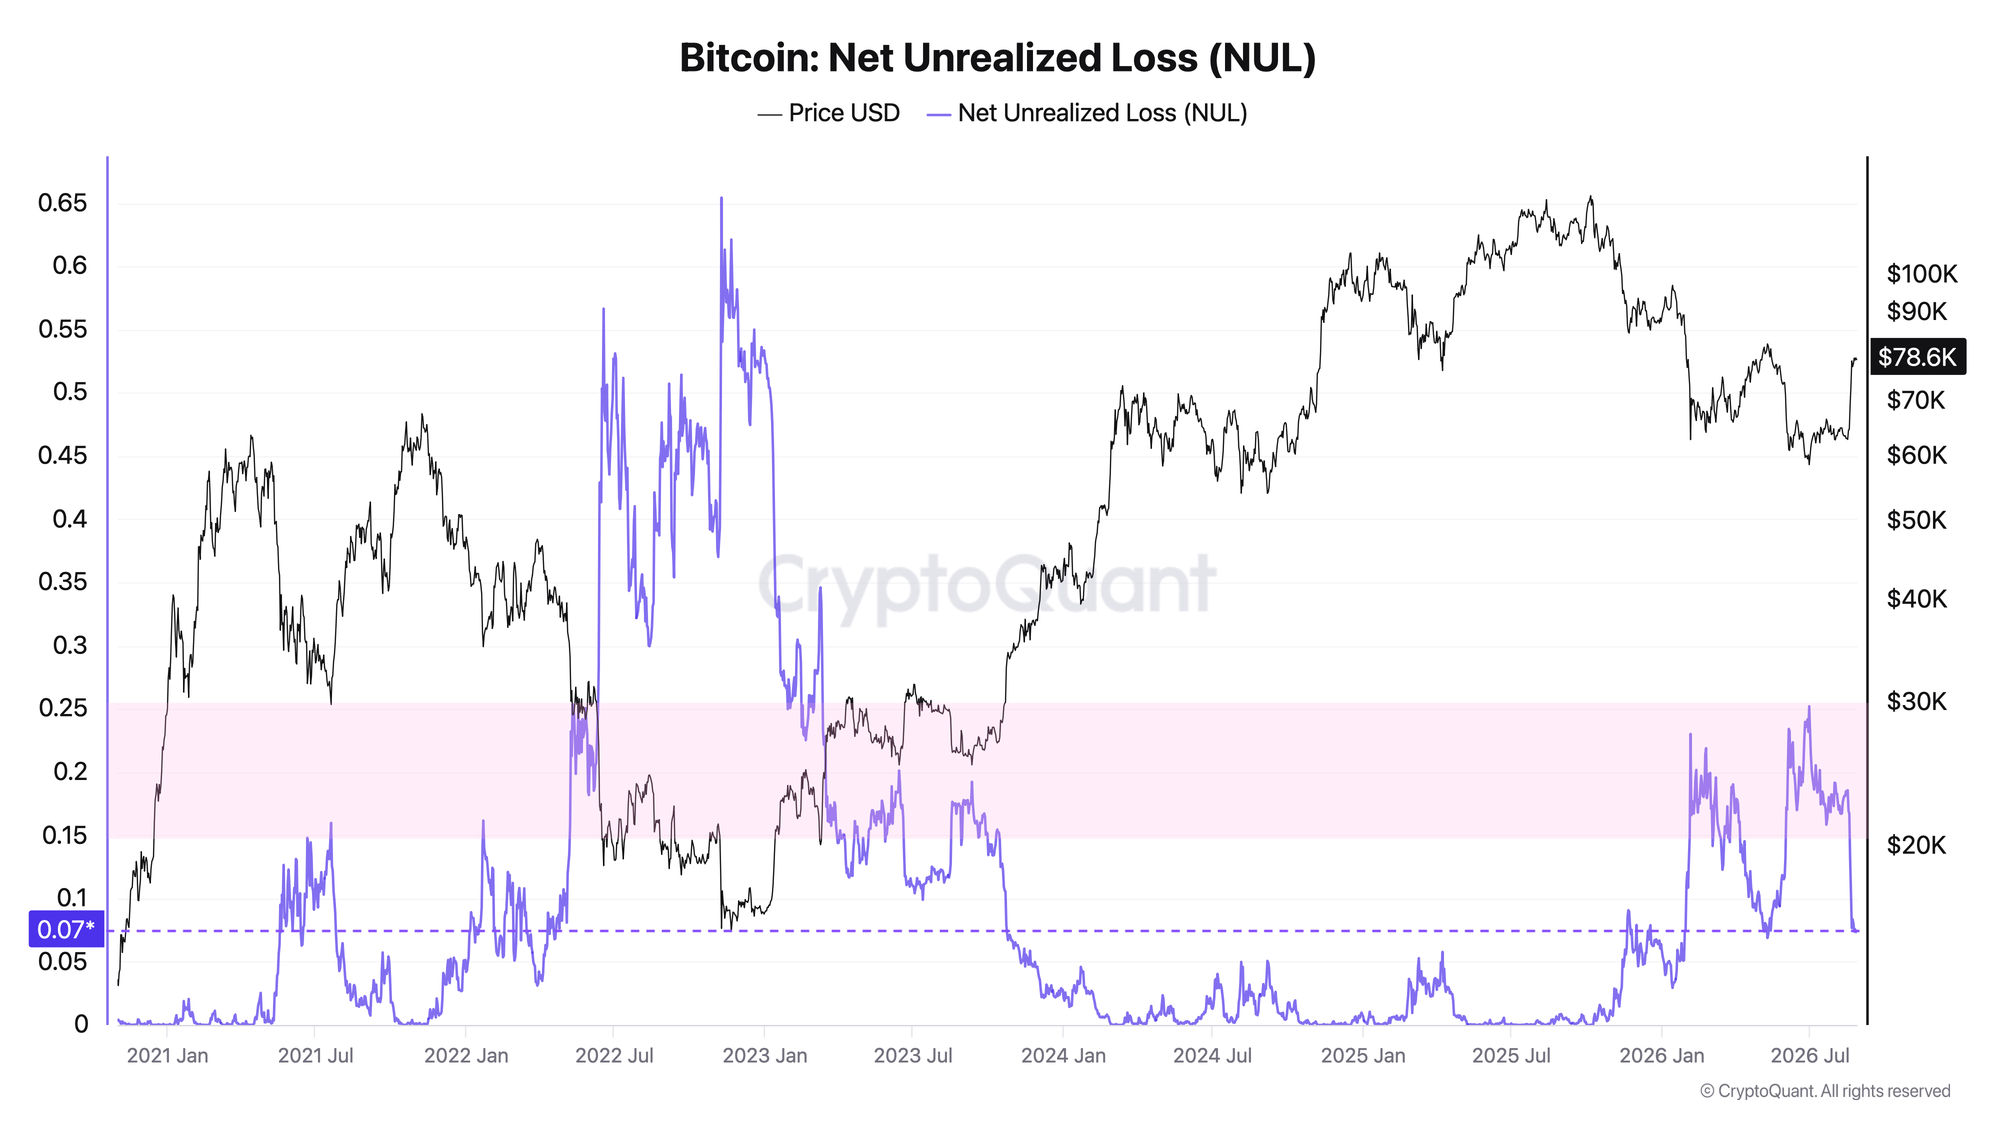
The metric shows unrealized losses as a share of market capitalization. The higher the reading, the larger the share of the current supply held below its cost basis and the greater the financial stress on holders.
The metric reached a local high of 25.21% on June 30, when Bitcoin was trading at $58.5K. Unrealized losses began to decline as the market recovered, but still stood at 18.57% on August 16.
The picture changed over the next ten days. As Bitcoin rose, the metric fell to 7.35%. That is a 60% decline from the August 16 level and nearly 71% below the late-June peak. The current reading is also the lowest since May 11.
Historical context shows that current stress is no longer close to deep capitulation. In November 2022, for example, unrealized losses reached 65.44% of market capitalization. Bitcoin's price recovery has now removed most of the pressure accumulated during the summer correction.
The second chart strengthens the signal from the first. Realized losses no longer dominate over the 90-day horizon, while the pool of unrealized losses that could sustain further pressure from supply held at a loss has also contracted sharply. This means holders' financial position has improved significantly since the August lows.
Outperform Buy & Hold with a rules-based strategy - Start here.
FAQ
Does the profit-to-loss ratio moving above 1 mean the bear phase is over?
No. The metric shows that, on a smoothed 90-day basis, realized profits once again slightly exceed realized losses. The current reading is almost exactly at the threshold, so confirmation requires a sustained period above 1.
What would be the main confirmation of further improvement?
The realized profit-to-loss ratio must continue rising above 1, while unrealized losses must not return to the levels seen before the August rebound. A move back below 1 in the first metric, combined with another increase in unrealized losses, would signal the return of financial pressure.
CONCLUSIONS
Financial stress among holders has declined significantly since the August low. Over ten days, unrealized losses fell from 18% to 7%, while the 90-day realized profit-to-loss ratio recovered from 0.747 to 1.003 and moved above the neutral threshold for the first time since late July. Based on these two metrics, the regime has shifted from clear loss dominance to a more constructive state, but confirmation remains weak because the ratio is only marginally above 1. The main trigger for further improvement is a sustained move higher above 1 while unrealized losses remain low. The main risk is a rapid drop back below the threshold alongside renewed financial stress.
Live Charts
Explore the metrics behind this brief with live, auto-updating charts:
Supply in Loss - Share of supply held at a loss to flag stress and capitulation zones.
SOPR - Spent Output Profit Ratio shows whether moved coins realize profit or loss.
NUPL - Net unrealized profit/loss across holders, mapped into cycle sentiment phases.
Supply in Profit - Share of circulating supply in profit as a cycle-phase and euphoria gauge.
Holder Behavior - All holder profitability and supply-cohort charts in one view.