


Outflows from miner wallets have increased significantly after several months of subdued activity. In late August, the MPI remained above zero for a third consecutive day for the first time since early February. At the same time, fees account for only 0.74% of miner revenue and have remained below 1% for 377 consecutive days. The two charts show rising miner sell-side pressure amid a weak fee market.
TL;DR
Miner selling has increased from the July lows, and the MPI has returned to positive territory for the first time in more than six months while fee revenue remains extremely low.
Miners' Position Index (MPI)
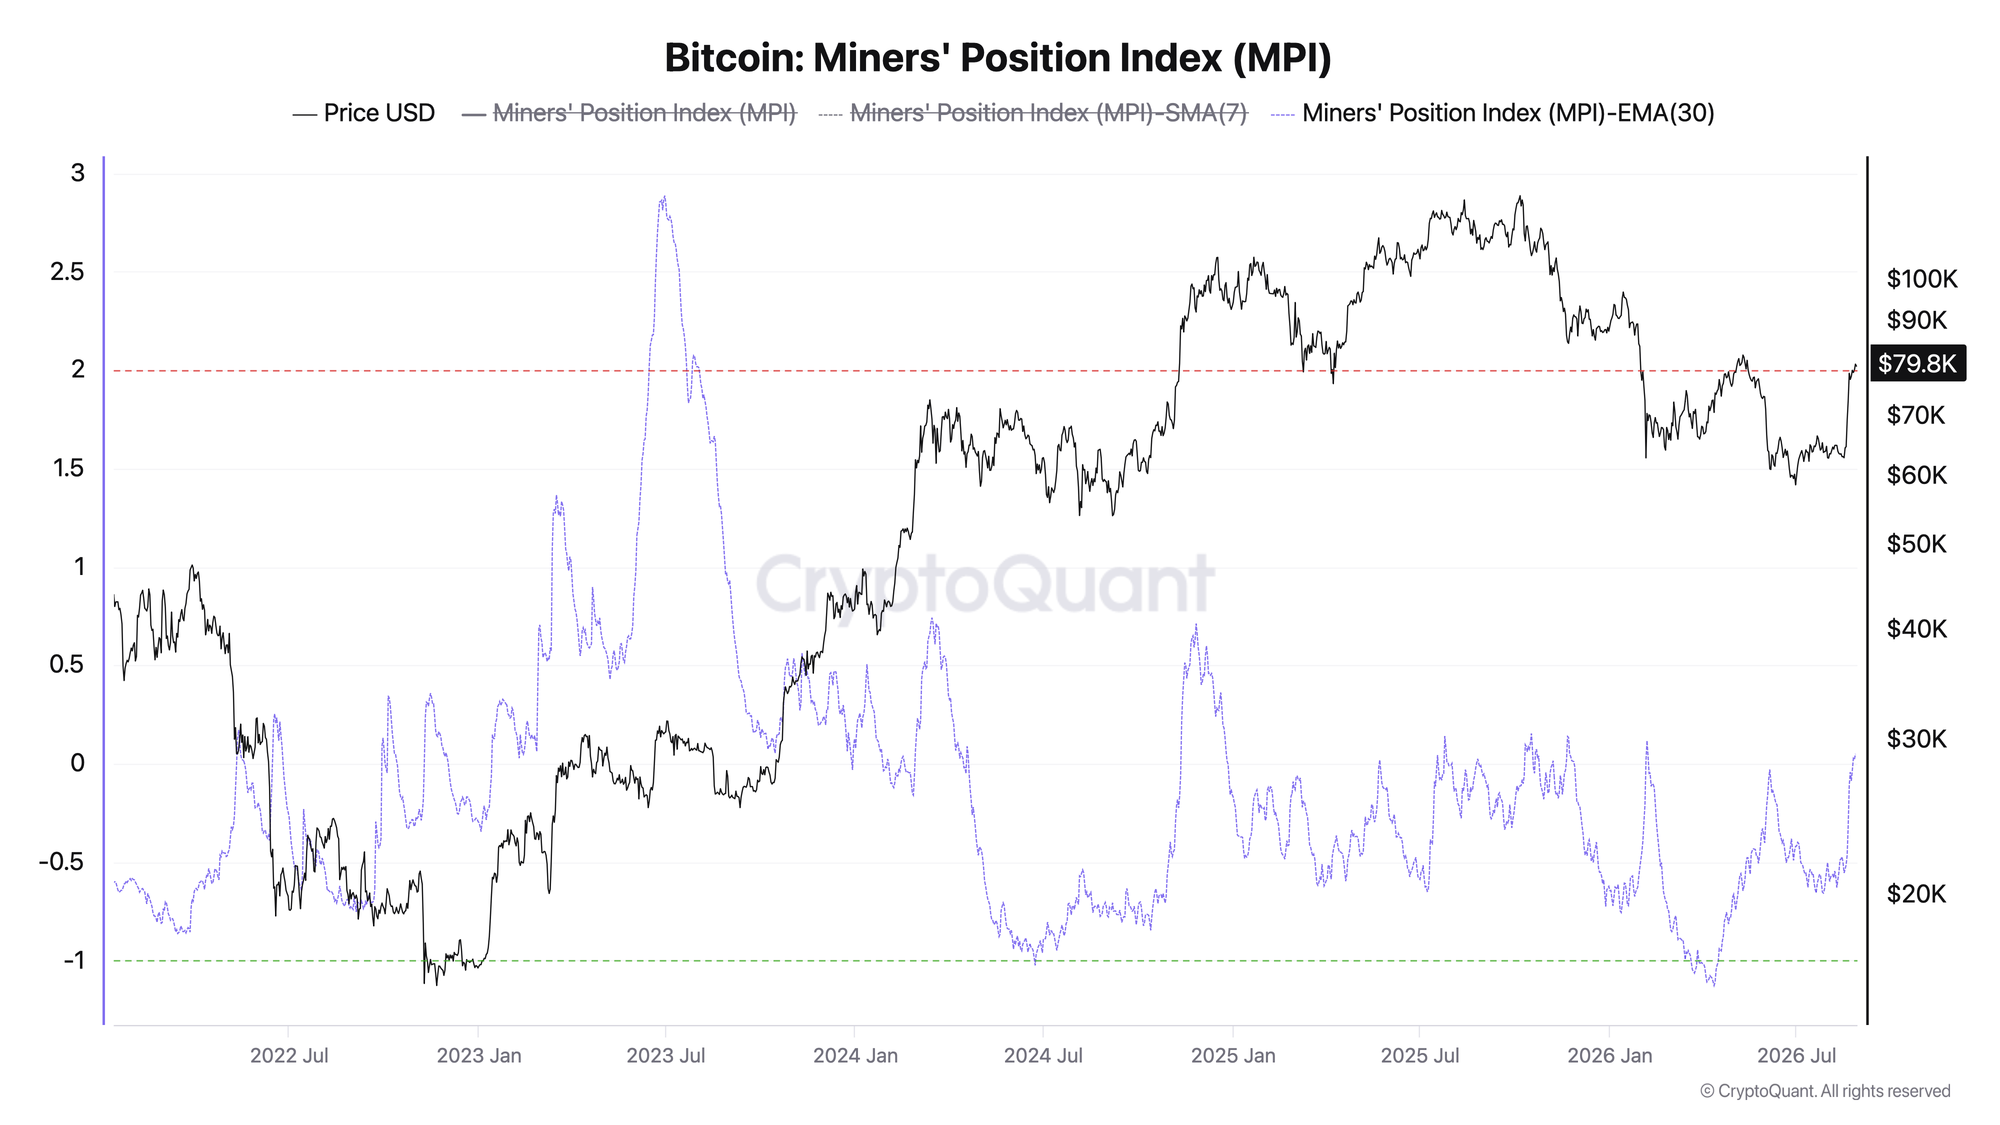
The MPI normalizes dollar-denominated outflows from miner wallets relative to their annual baseline. The chart uses a 30-day smoothed index: a rising reading means miner selling is increasing relative to its recent historical norm.
As of August 27, the MPI had reached +0.049 and remained above zero for a third consecutive day. Positive readings were last seen on February 7, making this the first move above zero in more than six months. Just 30 days ago, the index stood at -0.64, marking a monthly increase of +0.69 points.
After several months of weak outflows, miner selling has begun to rise. Further growth in the MPI within positive territory would confirm increasing pressure.
Bitcoin Miner Fee Revenue Share
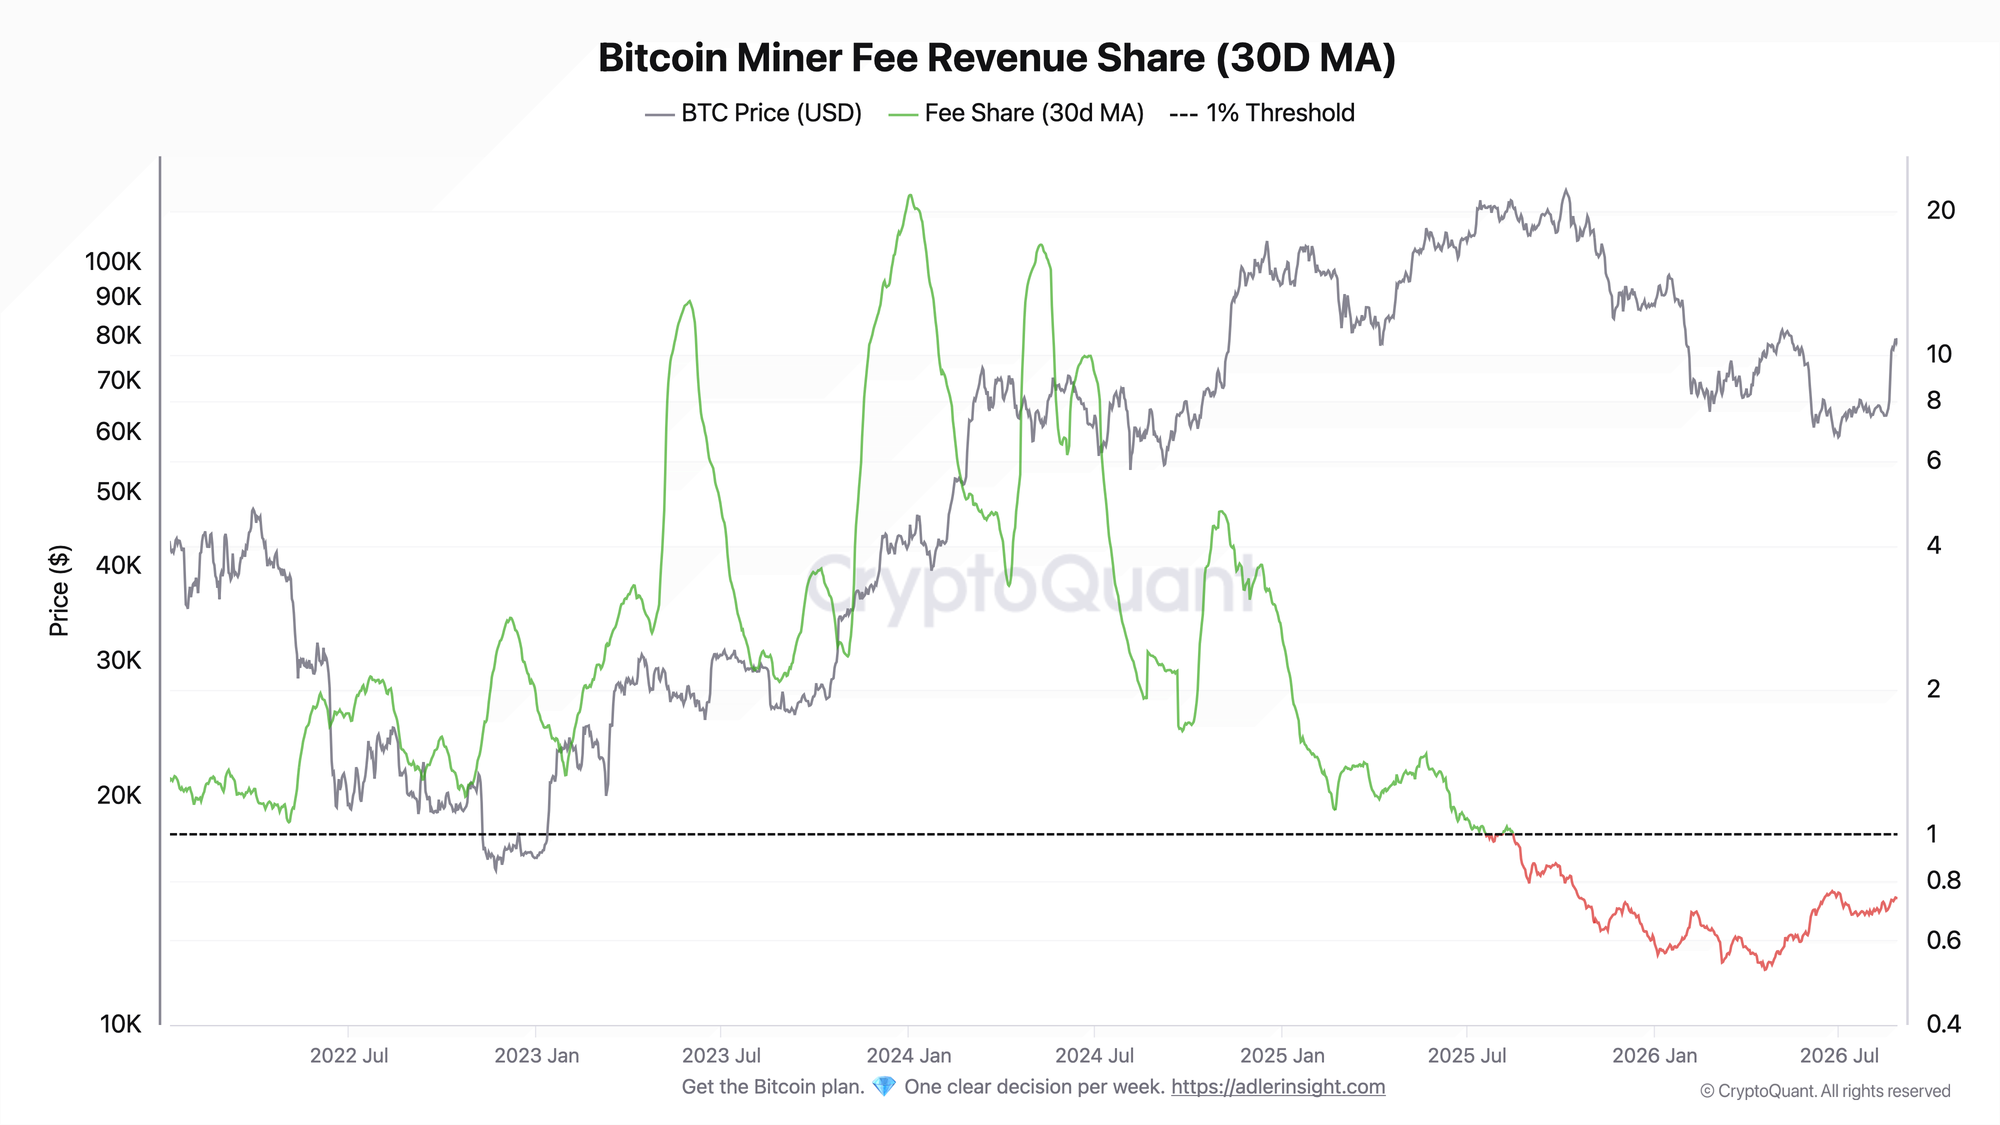
The metric shows the share of miner revenue generated by transaction fees. The 1% threshold is used as a working benchmark for an extremely weak contribution from fees.
As of August 27, fees accounted for 0.735% of miner revenue. The last day above 1% was August 15, 2025, and the metric has remained below that level for 377 consecutive days.
The divergence from price is especially clear. Over the past two weeks, Bitcoin has risen 25%, while the fee share has barely changed, moving from 0.72% to 0.74%. The price increase has not been matched by a comparable recovery in fee revenue or network activity.
This means the miner revenue structure remains almost entirely dependent on the block subsidy. The second chart provides context for the first: fee revenue remains extremely weak just as miner selling begins to rise.
One decision per week. A defined exposure cap. Weekly Engine replaces fear, FOMO, and guesswork with a rules-based Bitcoin strategy you can follow. Start here.
FAQ
Why does the MPI returning above zero matter now? Because this is the first sustained positive reading since February, and it coincides with an extremely low fee share. Miner selling is beginning to rise while fee revenue remains weak.
What would signal stronger pressure? The MPI holding in positive territory and continuing to rise while the fee share remains below 1%. A return below zero or a significant recovery in fee revenue would reduce the risk.
CONCLUSIONS
The two charts point to a deterioration in miner flow conditions. The MPI returned above zero for the first time since February and rose from -0.64 to +0.05 over 30 days. At the same time, fees account for only 0.74% of miner revenue and have remained below 1% for 377 consecutive days.
Together, the charts show that miner outflows are beginning to increase precisely when the contribution of fees to miner revenue remains extremely low.
Live Charts
Explore the metrics behind this brief with live, auto-updating charts:
Puell Multiple - Miner revenue stress and expansion relative to the 365-day average.
Exchange Netflow - Net BTC moving to and from exchanges across positive and negative flow regimes.
Reserve Risk - Long-term holder conviction relative to price to gauge risk/reward at cycle extremes.
MVRV Ratio - Market value vs realized value to identify valuation regimes and cycle risk.