
TL;DR
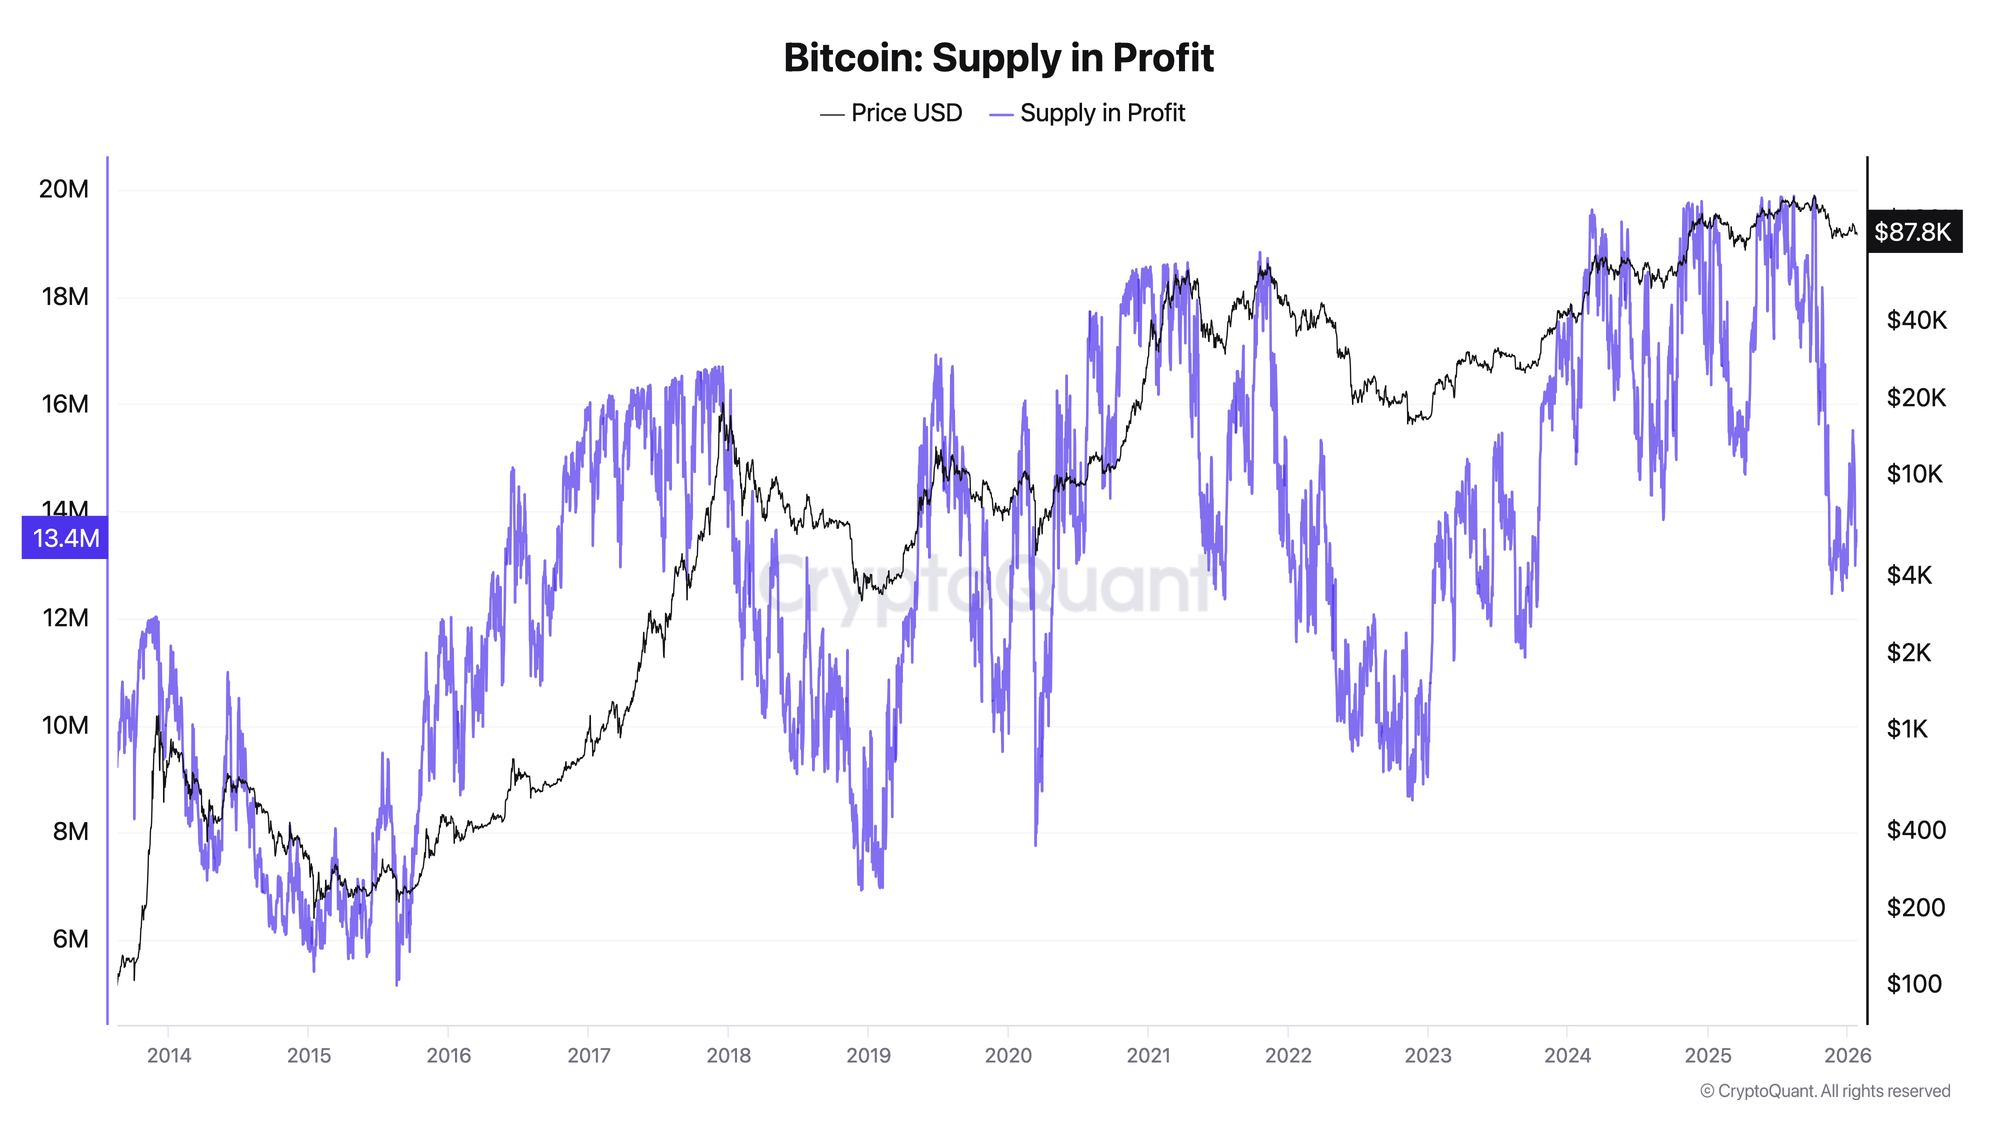
Supply in Profit measures the percentage of Bitcoin supply currently above its on-chain cost basis (last moved price).
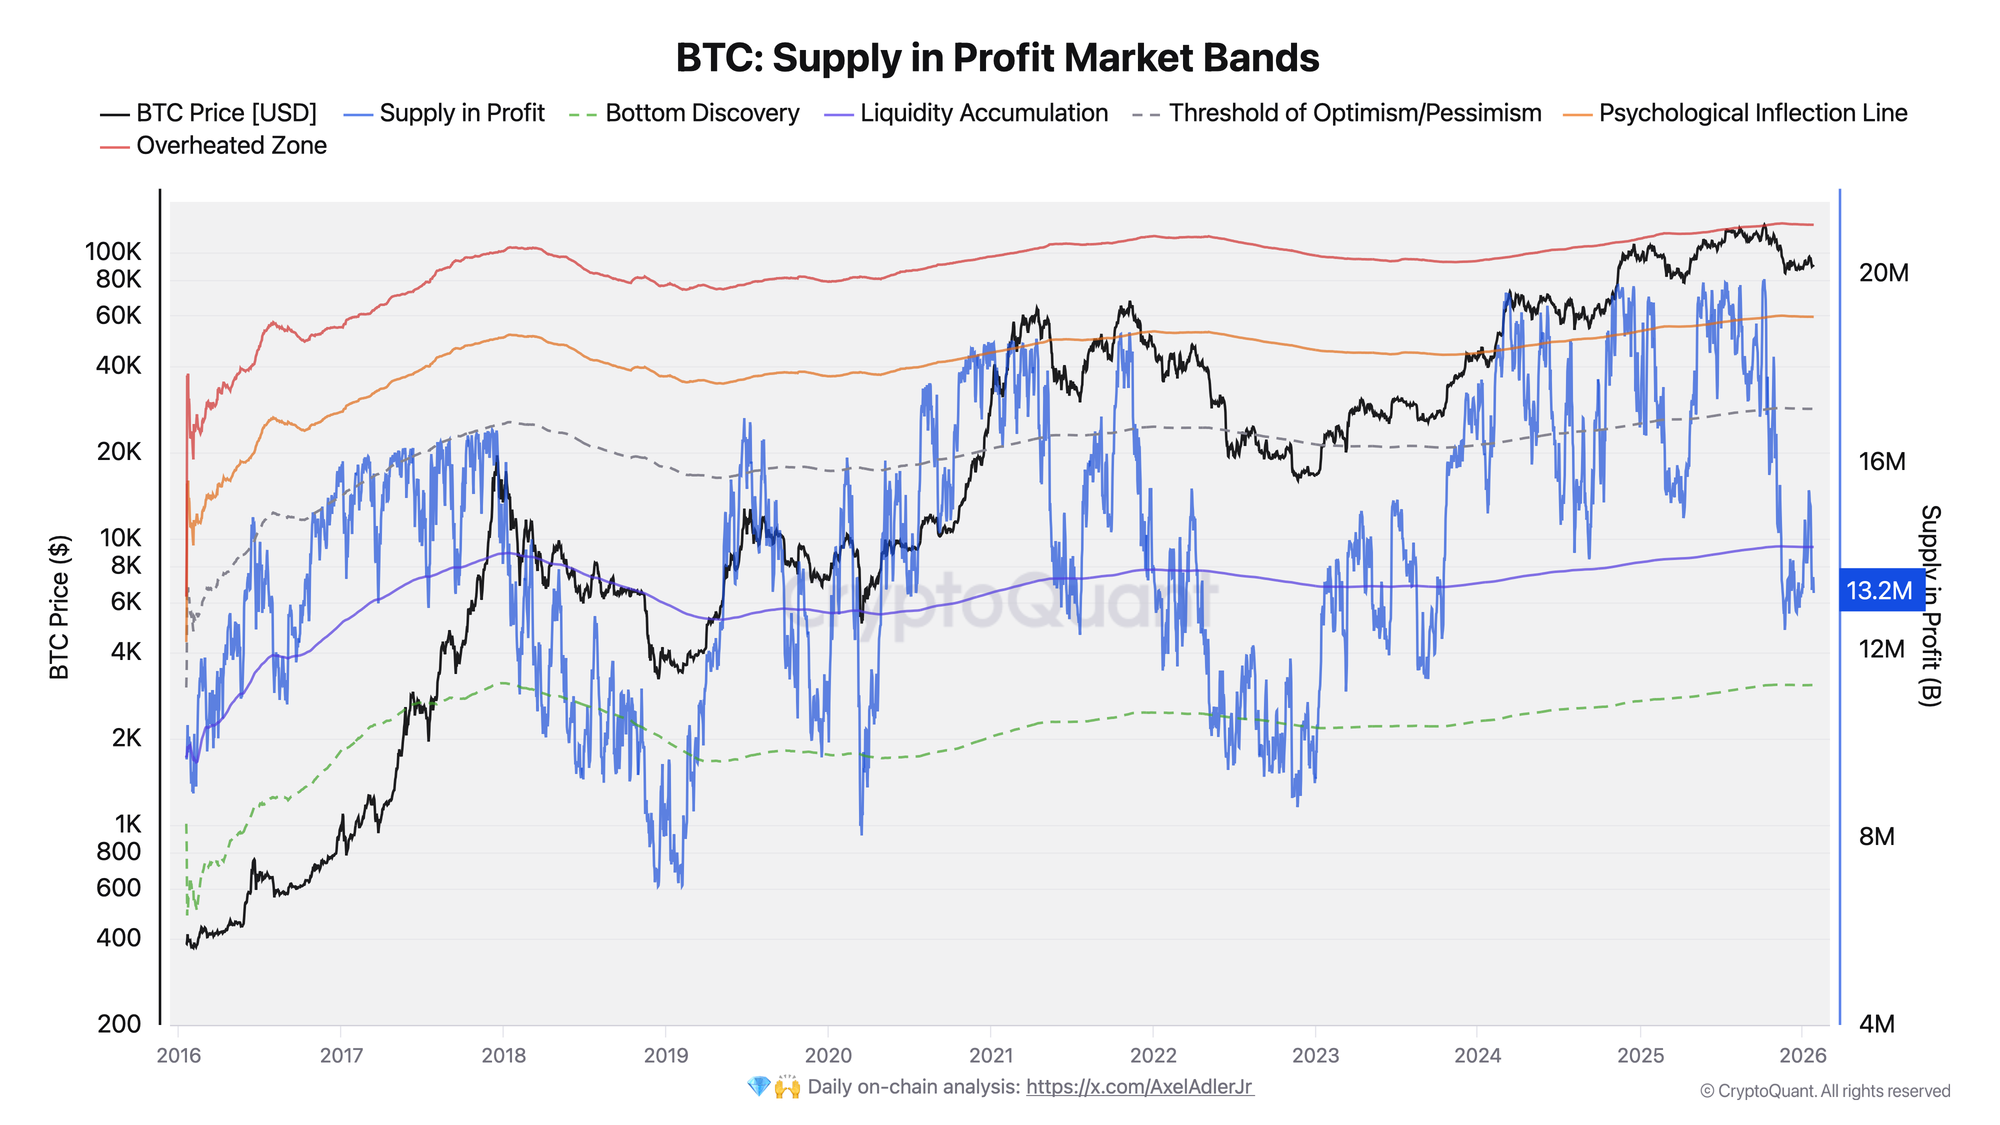
- >95%: Euphoria zone - almost everyone profitable, high distribution risk
- 75-95%: Healthy bull market - sustainable growth
- 50-75%: Transition zone - regime change potential
- <50%: Capitulation - majority underwater, historically strong accumulation zone
Best used for cycle positioning and risk management, not short-term trading.
What is Supply in Profit?
Definition
Supply in Profit answers a simple question: "What percentage of Bitcoin holders are currently in the green?"
Each coin on the Bitcoin blockchain has a cost basis - the price when it last moved. If the current price is above that cost basis, the coin is "in profit."
Supply in Profit (%) = (Coins in Profit / Total Circulating Supply) × 100
How It's Calculated (UTXO Logic)
Bitcoin's UTXO model makes this calculation possible:
- Each UTXO has a timestamp - when it was created (last moved)
- Price at creation = cost basis - the realized price for that coin
- Compare to current price - if current > cost basis, coin is in profit
- Aggregate across all UTXOs - sum of profitable supply / total supply
Example:
- 1 BTC received at $30,000 (cost basis)
- Current price: $90,000
- This coin is "in profit" and contributes to Supply in Profit
This is the same UTXO-based logic that powers NUPL, SOPR, and Realized Price Bands.
Critical Threshold Levels
🔴 >95%: Euphoria Zone
What happens here:
- Nearly all holders are profitable
- Selling becomes psychologically easy ("lock in gains")
- Distribution risk rises sharply
- Market becomes fragile to negative catalysts
Historical Examples:
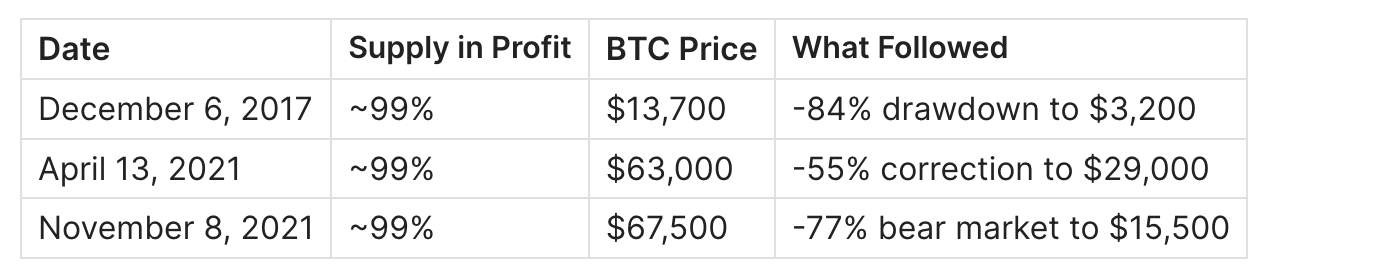
Key insight: Extreme Supply in Profit doesn't mean "sell now" - it means elevated risk regime. These conditions can persist for weeks or months during strong trends.
How to use:
- Not a single sell trigger
- Treat as high-risk environment
- Confirm with SOPR breakdown
- Watch for exchange inflows rising
🟡 75% to 95%: Healthy Bull Market
Most bull markets spend significant time in this zone.
Characteristics:
- Majority of holders in profit
- Trend can sustain without overheating
- Sell pressure is manageable
- FOMO present but not extreme
Historical pattern: Bitcoin spent 34% of its history in this zone - it's the "normal bull market" state.
Warning signs within this zone:
- Supply in Profit rising too fast
- Realized profit spikes appearing
- STH SOPR rolling over from highs
- Exchange reserves rising
🟢 50% to 75%: Transition Zone
This is where market regimes flip - either recovering from bear markets or entering them.
Two scenarios:
Scenario A: Recovery (bullish)
- Supply in Profit climbing from below 50%
- Price stabilizing or rising
- Long-term holders accumulating
- Breaking above 75% often confirms new bull
Scenario B: Deterioration (bearish)
- Supply in Profit falling from above 75%
- Price breaking key supports
- Distribution accelerating
- Dropping below 50% confirms bear dominance
Key level: 70%
Historically, sustained readings above 70% tend to support bullish structure. Drops below 70% often signal trouble.
Current reading (January 2026): ~68% - firmly in transition zone
🔵 <50%: Capitulation Zone
What happens here:
- Majority of supply is underwater
- Fear and despair dominate sentiment
- Forced selling and exhaustion occur
- Media narratives turn extremely bearish
Historical Examples:
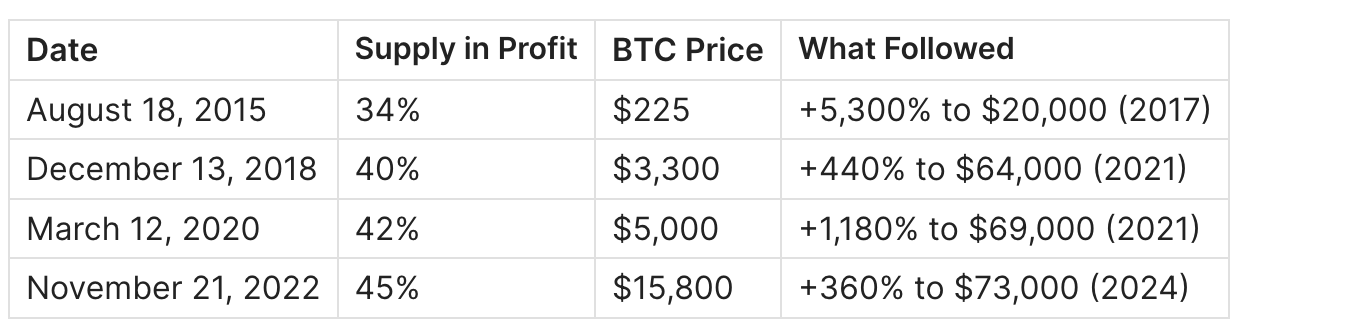
Pattern: Every time Supply in Profit dropped below 50%, it marked a major accumulation opportunity. No exceptions.
How to act:
- Scale-in strategy, not single-shot entries
- Combine with MVRV green zone confirmation
- Watch for selling exhaustion signals
- Patience required - bottoms are processes, not events
Historical Zone Distribution
Bitcoin's entire history broken down by Supply in Profit zones:
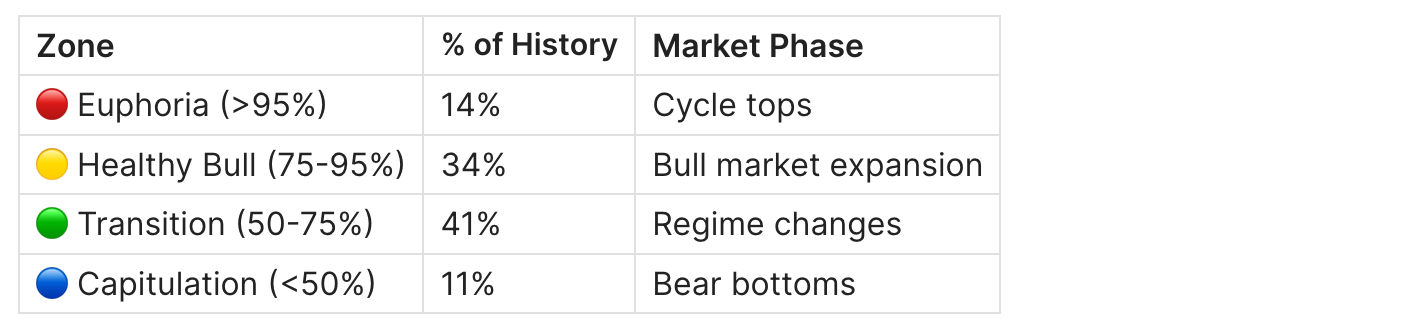
Key insight: Bitcoin spends most time (41%) in the transition zone - the zone of uncertainty. This is where patience and framework-based analysis matter most.
The Alpha: Supply in Profit Patterns
Pattern #1: Price-Supply Divergence
Bearish divergence: Price makes higher high, but Supply in Profit makes lower high.
What it means:
- New buyers entering at higher prices (raising average cost basis)
- Distribution occurring under the surface
- Rally on weakening foundation
Historical example:
- November 2021: BTC reached $69,000 (new ATH), but Supply in Profit was lower than April 2021 peak at $64,000. This bearish divergence preceded the 77% bear market.
Bullish divergence: Price makes lower low, but Supply in Profit makes higher low.
What it means:
- Strong hands absorbing supply at lower prices
- Accumulation despite price weakness
- Foundation strengthening
Pattern #2: Breakout Confirmation
When Supply in Profit breaks above 80% after extended time below, it often confirms structural recovery.
Why it works:
- Majority flipping to profit creates positive sentiment
- Reduces panic selling potential
- Trend becomes self-reinforcing
How to use:
- Allow position sizing to increase
- Confirm with NUPL entering "Optimism" zone
- Watch for exchange outflows (accumulation signal)
Pattern #3: Bear Market Bottom Setup
The classic bottom formation:
- Supply in Profit falls below 50% - majority underwater
- Price stabilizes - selling exhausts
- Volatility compresses - indifference phase
- Supply in Profit begins climbing - new accumulation
Confirmation signals:
- STH SOPR < 1 (selling at loss) then recovering
- LTH accumulation increasing
- Exchange reserves declining
- NUPL recovering from negative
STH vs LTH Supply in Profit
Most analysts look at total Supply in Profit. The real edge comes from separating Short-Term Holders (STH) and Long-Term Holders (LTH).
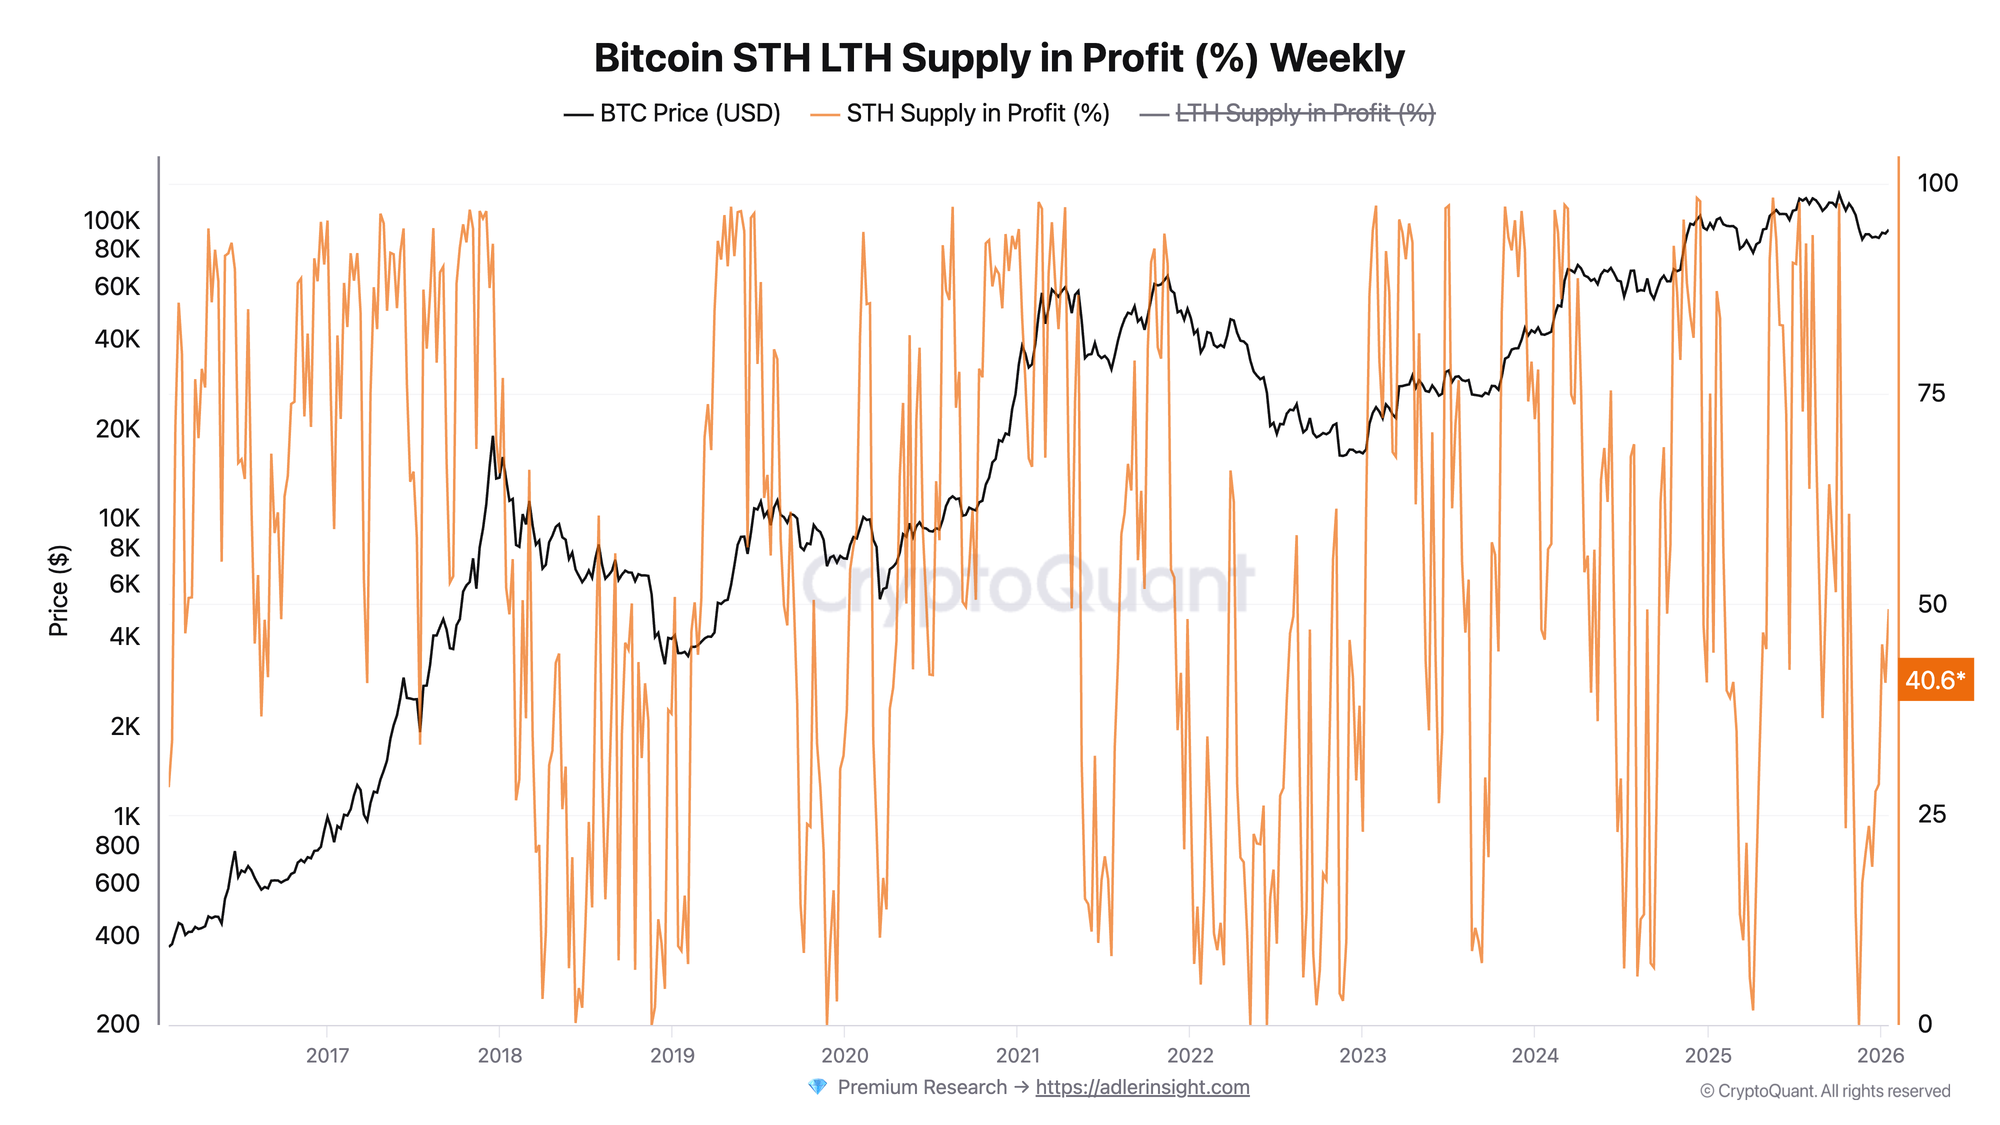
Short-Term Holder Supply in Profit
Characteristics:
- Very sensitive to price changes
- Coins held < 155 days
- Reflects recent buyer sentiment
Uses:
- Early warning for overheating (STH Supply in Profit >95%)
- Panic detection (STH Supply in Profit dropping sharply)
- Risk-on vs risk-off regime shifts
Signal example: When STH Supply in Profit drops below 50%, it often marks local bottoms - recent buyers are underwater and selling pressure peaks.
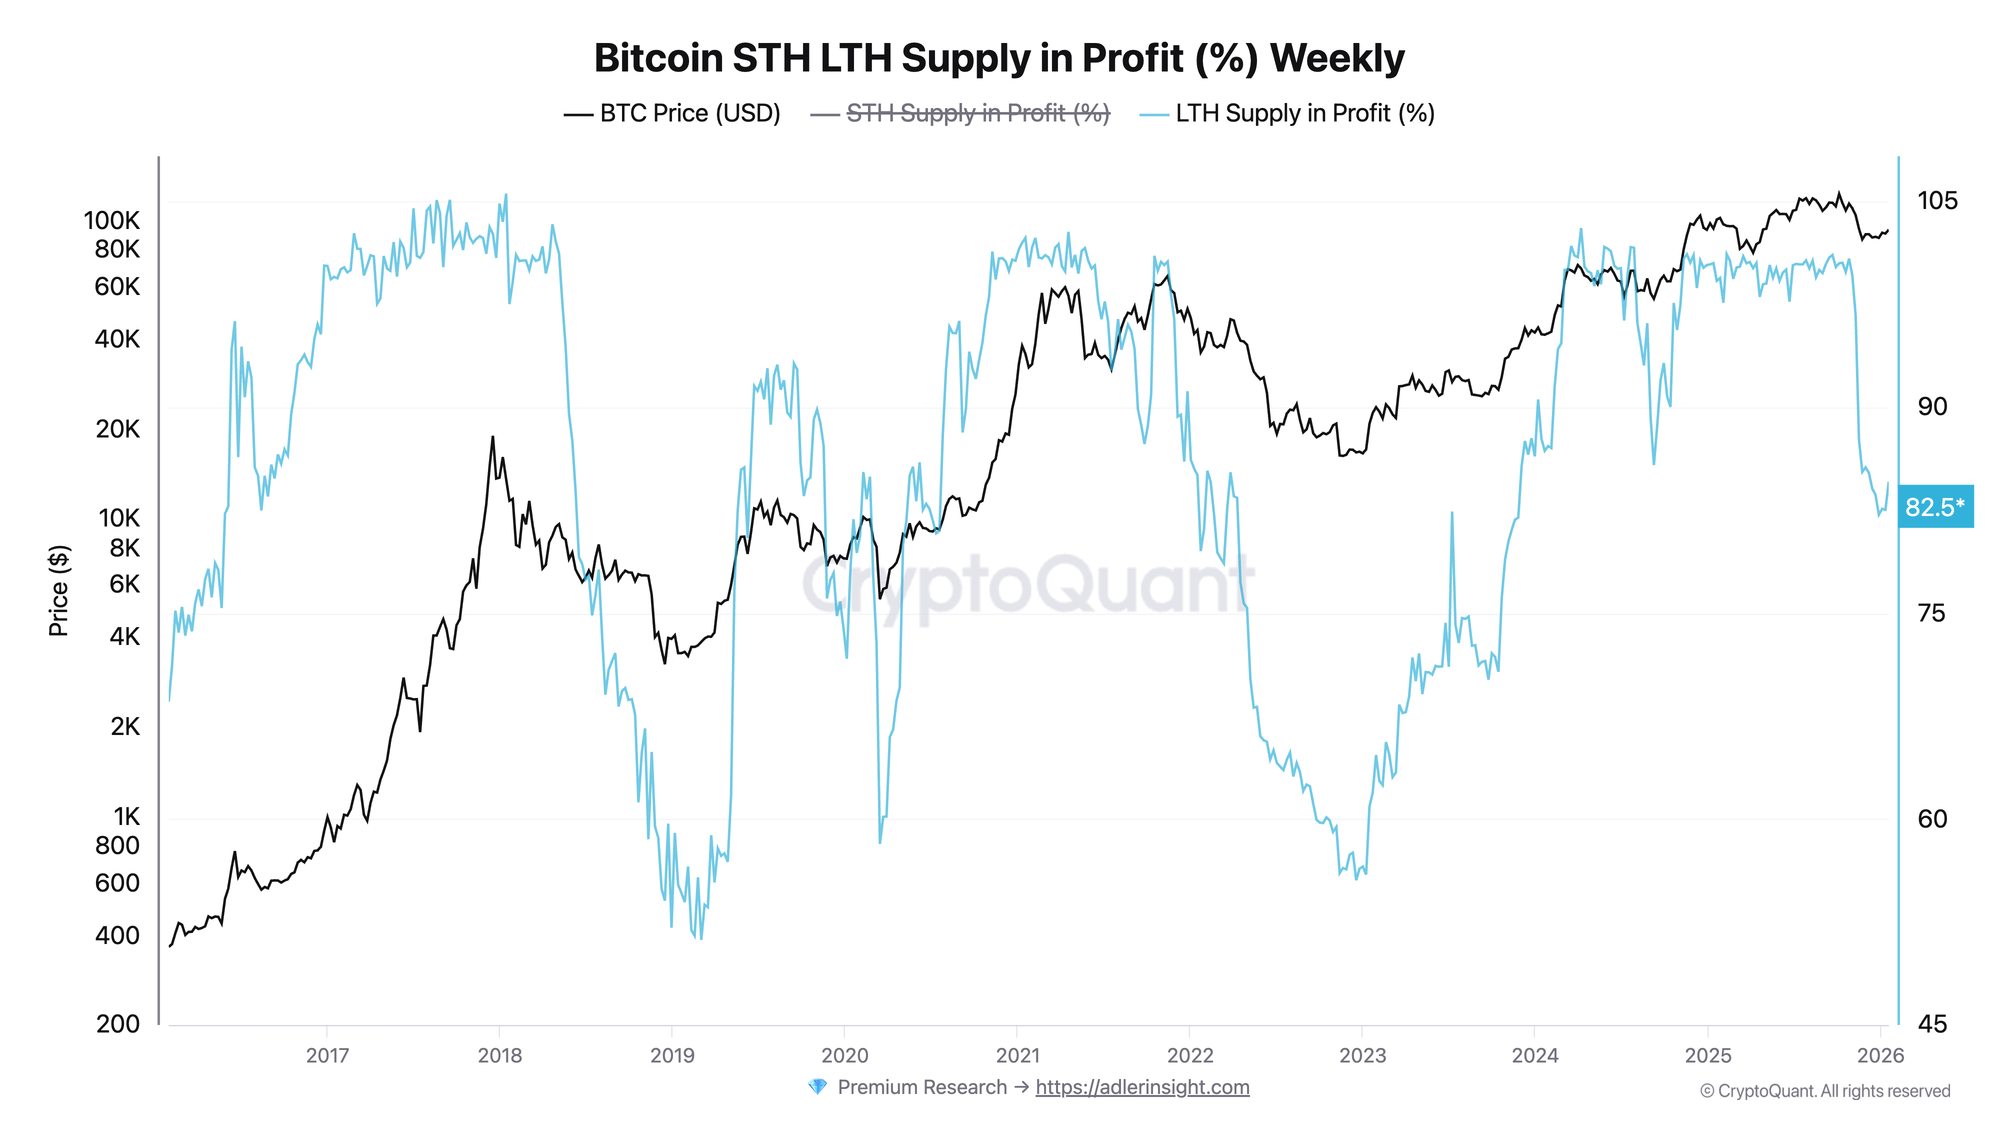
Long-Term Holder Supply in Profit
Characteristics:
- More stable, slower moving
- Coins held > 155 days
- Reflects conviction-based holding
Uses:
- Macro regime health
- Structural bull/bear confirmation
- Cycle positioning
Signal example: LTH Supply in Profit rarely drops below 60% even in deep bears - these are the strongest hands. When it does drop significantly, it marks generational opportunities.
Common Mistakes
Mistake #1: Treating 95% as Instant Sell Signal
Supply in Profit can stay above 95% for weeks or months during strong bull markets.
December 2017 example: Supply in Profit was above 95% from October through mid-December - selling in October would have missed 100%+ gains.
Fix: Use confirmation signals:
- STH SOPR breaking down
- Exchange inflows spiking
- Realized profit reaching extreme levels
- Price momentum failing
Mistake #2: Ignoring Rate of Change
The speed of change often matters more than absolute level.
Dangerous pattern: Supply in Profit drops from 90% to 70% in 2 weeks - rapid deterioration signals panic, not healthy correction.
Healthy pattern: Supply in Profit drifts from 90% to 80% over 2 months - normal profit-taking, not structural breakdown.
Fix: Track rate of change, not just level.
Mistake #3: Using for Short-Term Trading
Supply in Profit is a positioning tool, not a day-trading indicator.
Why it fails for short-term:
- Updates daily, not real-time
- Reflects structural state, not momentum
- Noise in small moves masks signal
Fix: Use for:
- Cycle identification
- Risk regime assessment
- Position sizing decisions
- NOT entry/exit timing
Mistake #4: Applying to Altcoins
Supply in Profit is most reliable for Bitcoin due to:
- Longest UTXO history
- Most robust on-chain data
- Deepest liquidity
- Most consistent holder behavior patterns
Fix: For altcoins, use different metrics or adjust expectations significantly.
Multi-Indicator Framework
Supply in Profit works best when combined with other metrics:
Supply in Profit + MVRV
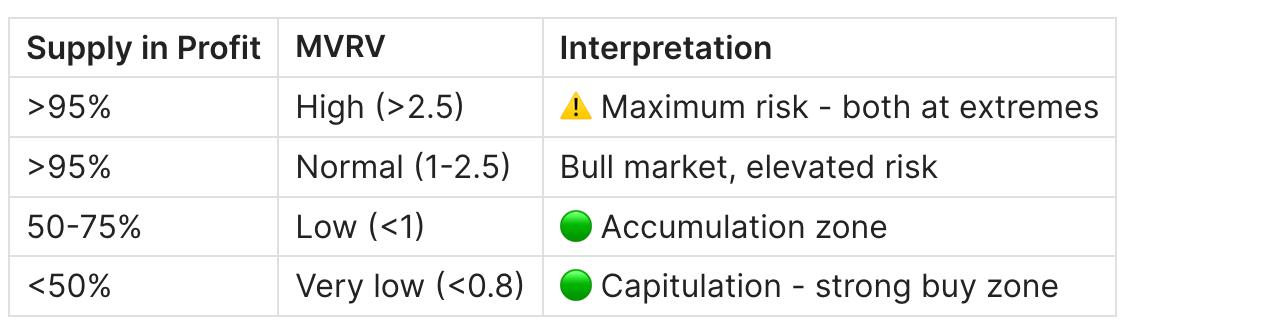
See: MVRV Ratio Guide
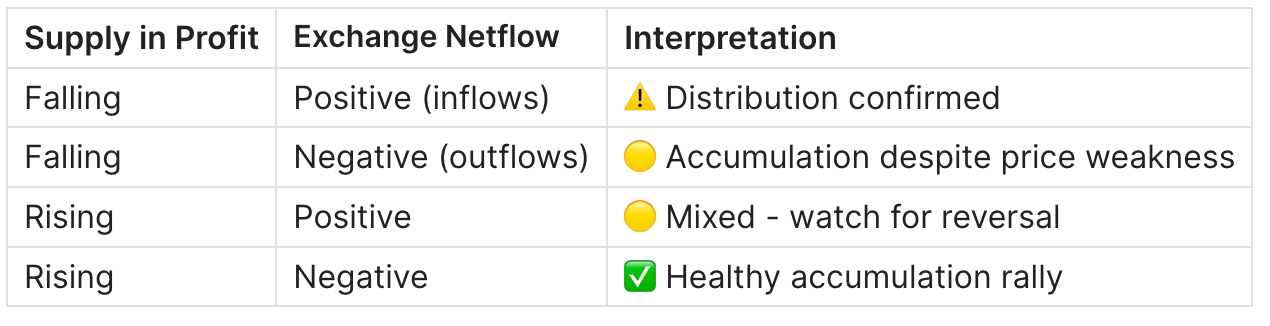
Supply in Profit + Exchange Netflow
Supply in Profit + STH SOPR
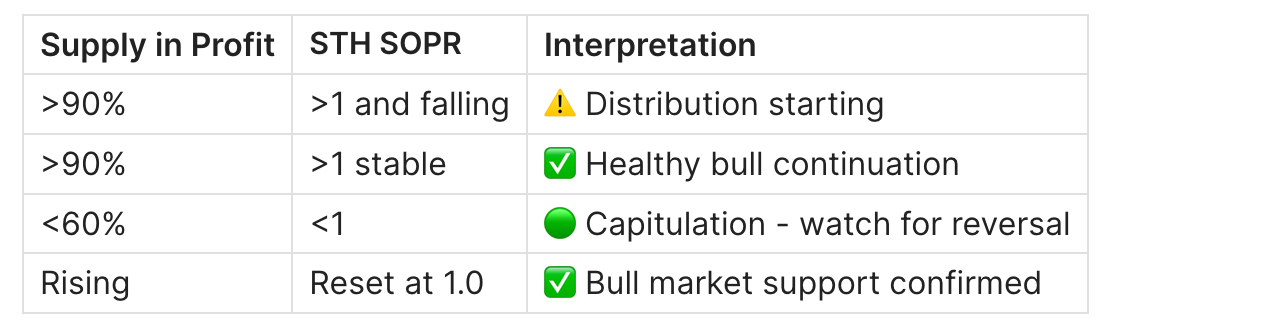
See: STH SOPR Guide
Practical Application
When to Use Supply in Profit
✅ Cycle positioning - where are we in the macro cycle? ✅ Risk management - should I reduce exposure? ✅ Accumulation timing - is this a good zone to add? ✅ Sentiment confirmation - does on-chain match narrative?
When NOT to Use Supply in Profit
❌ Intraday trading - too slow, too noisy ❌ Precise entry/exit timing - it's a zone indicator ❌ Altcoin analysis - different dynamics, less reliable data ❌ Isolated decision-making - always combine with other metrics
Current Market Context
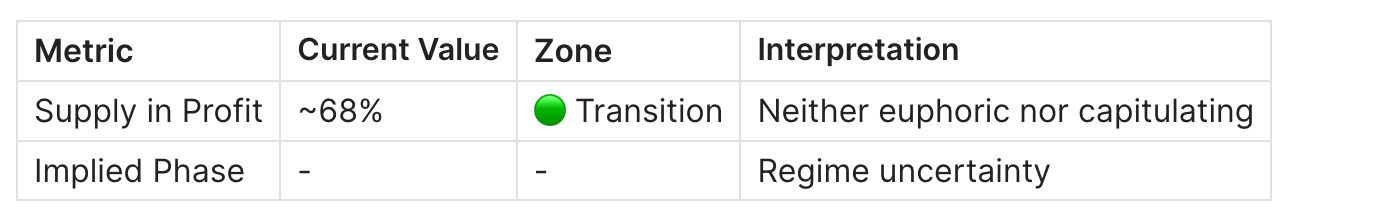
Reading
Current Supply in Profit sits in the transition zone (50-75%). This typically indicates:
- If recovering from bear: Potential for continued expansion if 75% breaks
- If correcting from bull: Watch for defense of 65-70% level
- Neutral stance: Framework favors patience over aggressive positioning
What to Monitor
- Break above 75% → Bullish confirmation, increase exposure
- Break below 60% → Bearish warning, reduce risk
- STH Supply in Profit → Early warning of regime shift
- Exchange flows → Distribution vs accumulation confirmation
- NUPL → Sentiment regime validation
Where to Track Supply in Profit
Glassnode - Most comprehensive, includes STH/LTH variants
CryptoQuant - Good alternative, strong exchange data
Bitcoin Magazine Pro - Educational context included
FAQ
What is Bitcoin Supply in Profit?
The percentage of Bitcoin's circulating supply that is currently valued above its on-chain cost basis (the price when each coin last moved). It answers: "How many holders are in the green?"
Is 95% Supply in Profit bearish?
It's a risk zone, not a guaranteed reversal. Markets can sustain >95% for weeks during strong bulls. Treat it as elevated risk requiring confirmation signals, not an automatic sell trigger.
What's the lowest Supply in Profit ever recorded?
In mature market history (post-2013), the lowest readings occurred during the 2015 bear market (~34%) and the 2018-2019 bottom (~40%). The November 2022 bottom reached approximately 45%.
How does Supply in Profit differ from NUPL?
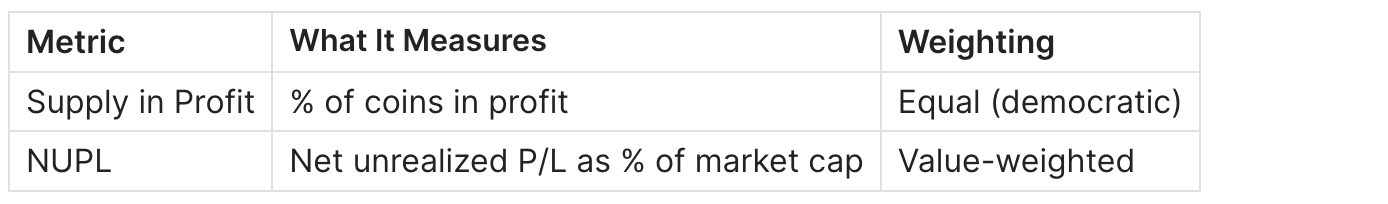
Supply in Profit counts coins equally. NUPL weights by value (larger positions matter more). They usually move together but can diverge when whales and retail have different cost bases.
Can Supply in Profit stay below 50% for extended periods?
Yes. The 2014-2015 bear market saw Supply in Profit below 50% for several months. These extended capitulation periods have historically been the best long-term accumulation opportunities.
How quickly can Supply in Profit change?
During volatile events, it can shift 10-20% within days. The March 2020 COVID crash saw Supply in Profit drop from ~75% to ~42% in about two weeks. This is why combining with other metrics and using proper risk management is essential.
Should I sell when Supply in Profit hits 95%?
Not necessarily. The question isn't "should I sell?" but "what's my risk exposure?" In euphoria zones, consider:
- Reducing leverage
- Tightening stop losses
- Taking partial profits
- NOT going all-in on new positions
Related Metrics
Build a complete on-chain analysis framework:
- Bitcoin NUPL: What It Is and How to Use It
- Bitcoin MVRV Ratio: Definition, Formula & Cycle Signals
- Bitcoin STH SOPR: What It Is and How to Use It
- Bitcoin Exchange Netflow: What It Is and How to Use It
- Bitcoin LTH vs STH: Supply Dynamics & Market Structure
- Bitcoin Realized Price Bands Explained
Key Takeaways
- Supply in Profit measures holder profitability - simple but powerful
- >95% = risk zone, not sell signal - requires confirmation
- <50% = accumulation zone - historically excellent opportunities
- Transition zone (50-75%) dominates - patience and frameworks matter
- Rate of change matters - speed often signals more than level
- Combine with other metrics - never use in isolation
- Best for positioning, not timing - macro tool, not day-trading
Historical Cycle Deep Dive
2017-2018 Cycle: Classic Euphoria-to-Capitulation
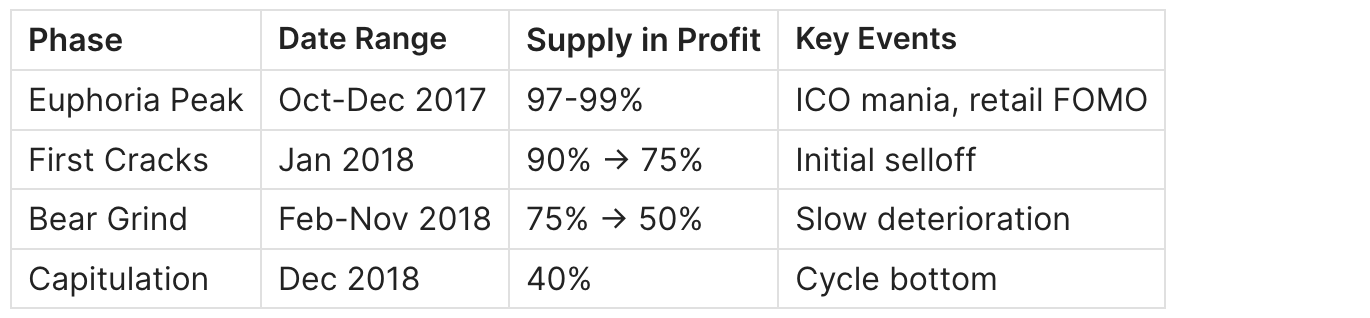
Key lesson: The drop from 99% to 40% took a full year. Capitulation is a process, not an event.
2020-2021 Cycle: COVID Crash and Recovery
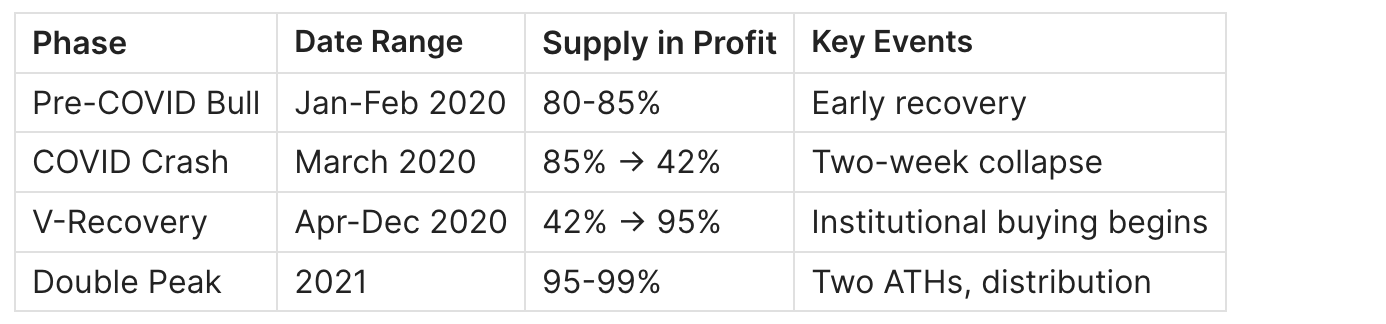
Key lesson: The COVID crash was the fastest drop in Supply in Profit history - 43 percentage points in two weeks. Speed matters.
2022 Cycle: LUNA/FTX Capitulation
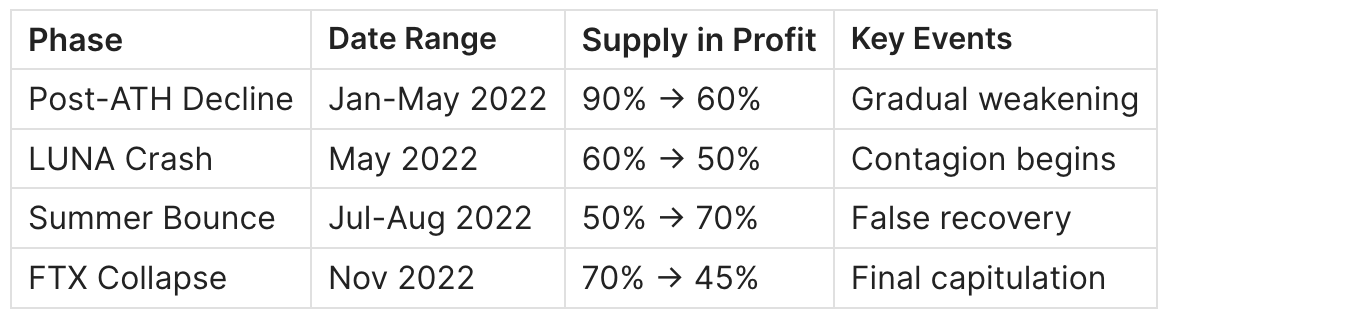
Key lesson: Bear markets often have false recoveries (summer 2022). Supply in Profit bouncing doesn't guarantee bottom - need sustained recovery above 75%.